
Drawing trend lines by hand means redrawing them every time a new swing forms. The trend line alert indicator does that part for you. It connects the two most recent confirmed swing highs into a resistance line and the two most recent swing lows into a support line, then watches for a close through either one.
This build ships as a compiled .ex4 for MT4 and .ex5 for MT5; the screenshots below come from EURUSD H1.
| Platforms | MT4 (.ex4) + MT5 (.ex5) |
|---|---|
| Chart window | Main price chart |
| Plots | 2: TL Break Up, TL Break Down |
| Alerts | popup, push notification, email, sound |
| Inputs | 13 |
Everything visible
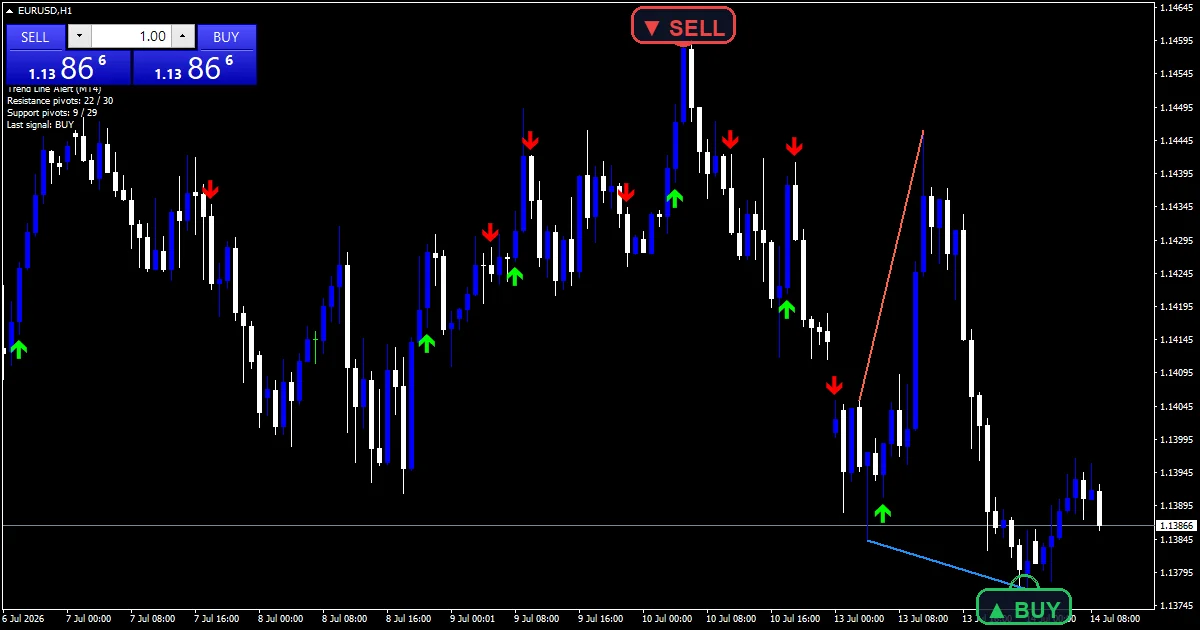
Two trend line objects: a tomato resistance line across the swing highs and a dodger blue support line across the swing lows.
TL Break Up marks a lime arrow beneath a bar that closes above the resistance line.
TL Break Down marks a red arrow above a bar that closes below support.
Both lines redraw as new pivots confirm, so they always reflect the two latest swings.
- TL Break Up: arrow, lime, width 2, arrow code 233
- TL Break Down: arrow, red, width 2, arrow code 234
The logic, one stage at a time
Confirming the pivots
Fr takes MathMax(1, `FractalStrength`), then the scan checks each candidate against its neighbours. sh survives only while high[i] holds at or above high[i + k] and strictly above high[i – k] across the window, with sl doing the mirror for lows. scanMax bounds the search at MathMin(`LookbackBars`, n – 1), so a long history does not slow the chart down.
Turning two pivots into a line
Given the two most recent swing highs the code works out the slope m as (high[rh2] – high[rh1]) divided by their bar distance. From that it projects the line’s value at any bar: vi takes high[rh1] + m * (i – rh1). The support line uses the same arithmetic on the two latest swing lows. Because both lines are recomputed from the current pivots, they move whenever a new swing confirms.
Detecting the break
A break needs two bars to disagree. vi holds the line’s value at the current bar and vi1 at the one before. An up-break requires close[i] above vi while close[i + 1] sat at or below vi1, so price crossed rather than merely sat above. `BreakCooldown` then blocks a second same-side arrow for a few bars, which stops one messy crossing producing a cluster.
What matters on screen
The lines are only as good as the two pivots behind them. Check which swings they connect before trusting a break.
An arrow means a close through the line, not a wick through it.
Both lines shift when a new pivot confirms, so a break marked yesterday was measured against the line as it stood then.
Long gaps between arrows usually mean the cooldown is doing its job rather than the market going quiet.
Alert channels in this build: popup, push notification, email and sound, one message per closed bar.
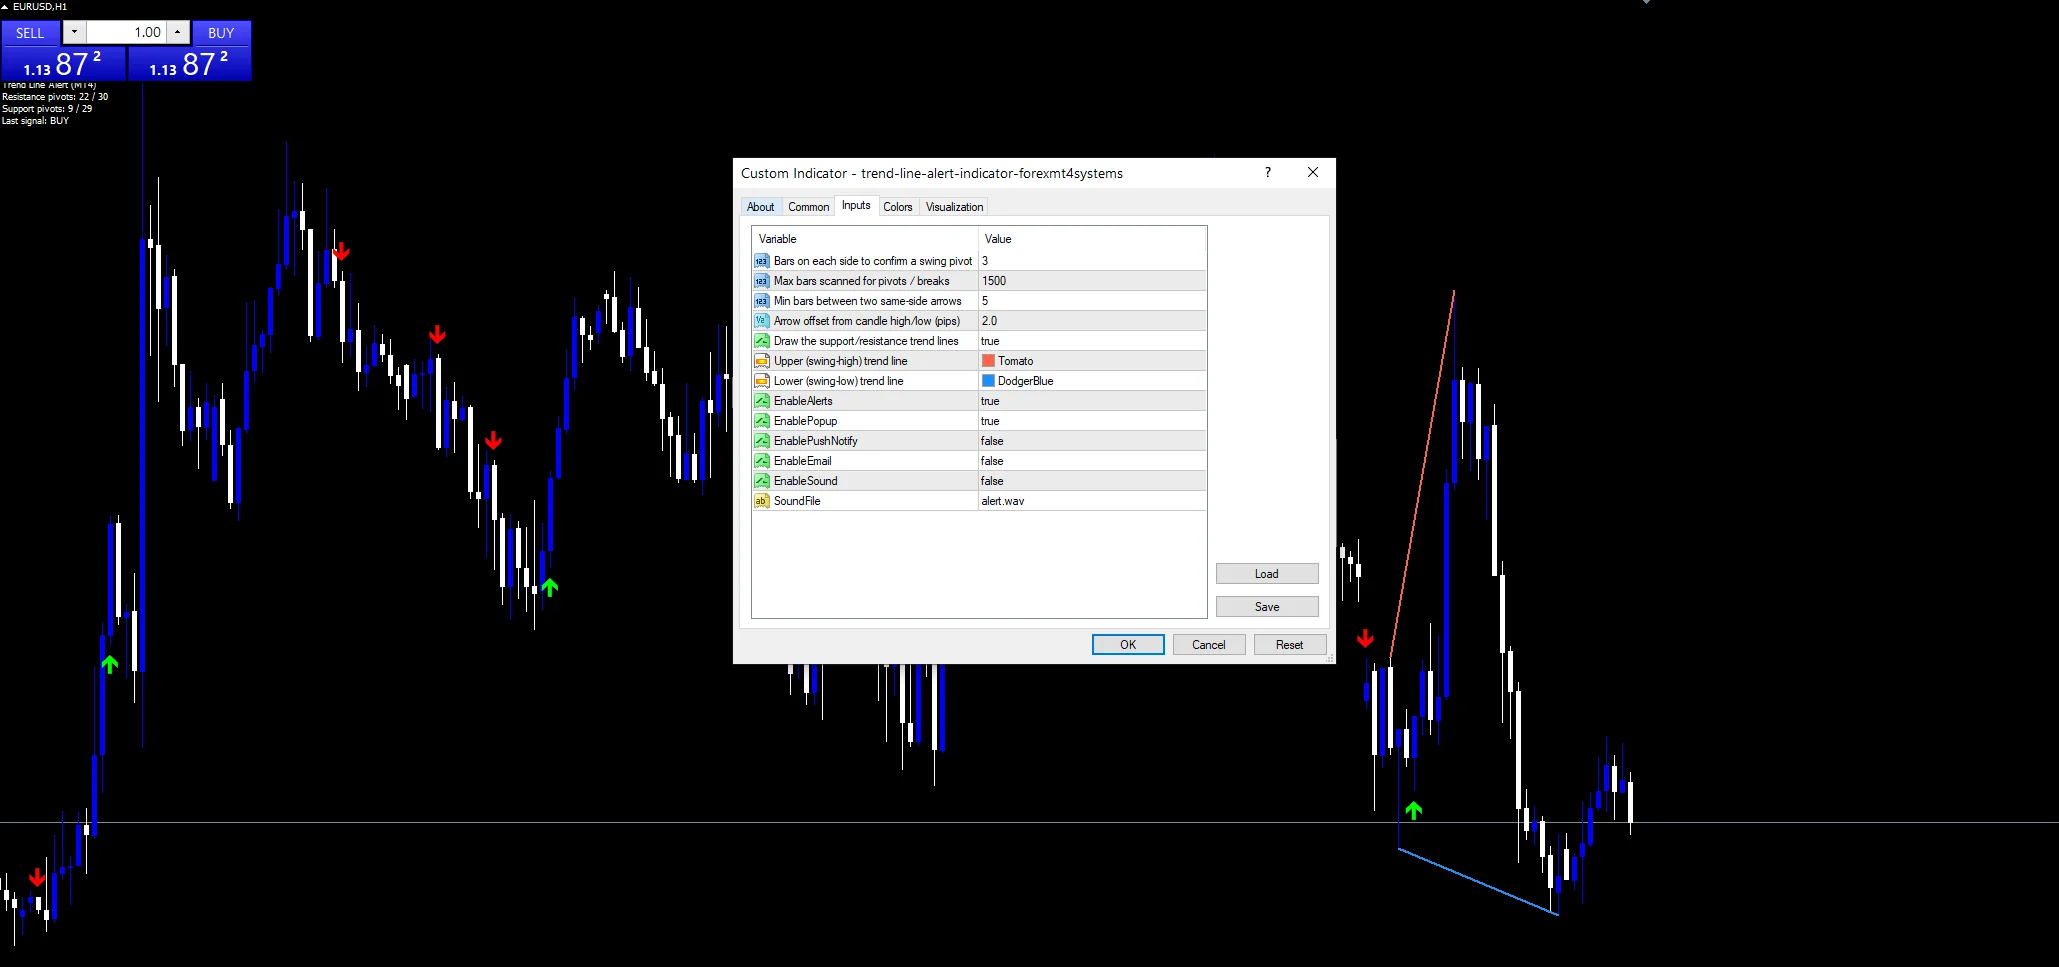
Four channels sit beneath `EnableAlerts`: popup, push notification, email and sound, with `SoundFile` naming the clip. Popup ships enabled and the rest ship off. The source header is explicit that the alert fires once per closed bar, so a wick through a line stays silent.
Every Trend line alert Indicator input
Core settings
| Setting | What it does | Default |
|---|---|---|
FractalStrength |
Bars on each side to confirm a swing pivot. Bars required either side of a swing pivot, default `3`. Raise it for fewer, more significant pivots and steadier lines. | 3 |
LookbackBars |
Max bars scanned for pivots / breaks. How many bars the pivot and break scan covers, default `1500`. Lower it if the chart feels slow. | 1500 |
BreakCooldown |
Min bars between two same-side arrows. Minimum bars between two arrows on the same side, default `5`. This is what keeps a choppy crossing from producing a run of arrows. | 5 |
Display settings
| Setting | What it does | Default |
|---|---|---|
ArrowGapPips |
Arrow offset from candle high/low (pips). Distance between candle and arrow, default `2.0` pips. | 2.0 |
ShowTrendLines |
Draw the support/resistance trend lines. Set it `false` to keep the arrows and hide the lines themselves. | on |
ResistanceColor |
Upper (swing-high) trend line. | tomato |
SupportColor |
Lower (swing-low) trend line. | dodger blue |
Alert settings
| Setting | What it does | Default |
|---|---|---|
EnableAlerts |
(see inputs panel) | on |
EnablePopup |
(see inputs panel) | on |
EnablePushNotify |
(see inputs panel) | off |
EnableEmail |
(see inputs panel) | off |
EnableSound |
(see inputs panel) | off |
SoundFile |
(see inputs panel) | alert.wav |
Where the defaults make sense
Trend lines need swings that are far enough apart to draw between, which suits H1 and above. EURUSD H1 is the reference chart. On M5 a strength of 3 finds pivots every few bars and the lines swing wildly. On H4 and daily the pivots are rare enough that a line can stand for weeks, which is closer to how most traders draw them by hand.
Where it falls short
Only two pivots define each line. A trend line most traders would draw through four touches is invisible to this method if the two most recent swings point elsewhere.
Lines move as pivots confirm, so a break can look obvious in hindsight on a line that did not exist at the time.
In a range the two most recent highs and lows can produce lines that cross each other, and breaks then fire in both directions.
Copy the compiled Trend line alert Indicator file into your MQL4/Indicators folder, and the MT5 build into MQL5/Indicators, then restart the terminal and drag it onto a chart. The step-by-step guide with screenshots is at how to install MT4 and MT5 indicators.
Download the Trend line alert Indicator for MT4 and MT5
The zip holds the compiled Trend line alert Indicator build for MT4 and MT5, plus a short README. Compiled files only, no source. Enter your email below and the download link arrives in your inbox.
Download this indicator free
Enter your email and the file is yours. You also get the full MT4 and MT5 library.
FAQ
Which swings does the resistance line connect?
The two most recent confirmed swing highs, and only those. The code takes their prices and bar distance to work out a slope, then projects the line forward. A third or fourth touch further back plays no part, which is the main difference between this and a line you would draw by hand.
What does BreakCooldown at 5 prevent?
A cluster of arrows from one messy crossing. When price wobbles across a line over several bars, each close through it would otherwise qualify. The cooldown blocks a second same-side arrow for five bars. Raise it on faster charts where price tends to straddle a level rather than clear it.
Why does the arrow need a close rather than a touch?
Because the test compares two bars. close[i] must sit beyond the line’s value at that bar while close[i + 1] sat on the other side of its own value. A wick through the line leaves both closes on the same side, so nothing prints. That is what keeps the alerts tied to settled moves.
How does FractalStrength change the lines?
It sets how many bars either side a pivot must beat, defaulting to `3`. A higher value means a swing has to stand out across a wider window, so pivots become rarer and the lines steadier. A lower value gives more pivots and lines that redraw constantly.
Are results guaranteed?
No. Trading involves risk. Results are not guaranteed; past performance is not indicative of future results. Use the Trend line alert Indicator as one input. Always backtest before trading live.
Category: this is part of our Trend collection. Browse more Trend for MetaTrader, or explore every MT4 indicator and MT5 indicator on the site.
External references
- Learn more about the underlying method in Foreign exchange aggregator on Wikipedia.
- For wider market background, see New 52 Week Highs And Lows For Exchanges at StockCharts ChartSchool.

About the author
Written by Dominic Walsh, a Forex trader and MT4/MT5 indicator, Expert Advisor and script developer. Every tool on forexmt4systems.com is tested on live charts before release and ships with ready-to-use compiled MT4 (.ex4) and MT5 (.ex5) files. Learn more about the trader and developer behind this site.
How we build, test and correct every tool: Editorial & Testing Policy. Trading carries risk; see the disclaimer.