
The vwap indicator plots a volume weighted average price line over the candles. It adds up price times volume from the start of the session and divides by the volume total. The line changes colour depending on which side of it price closes. ResetDaily starts that sum again at each new trading day.
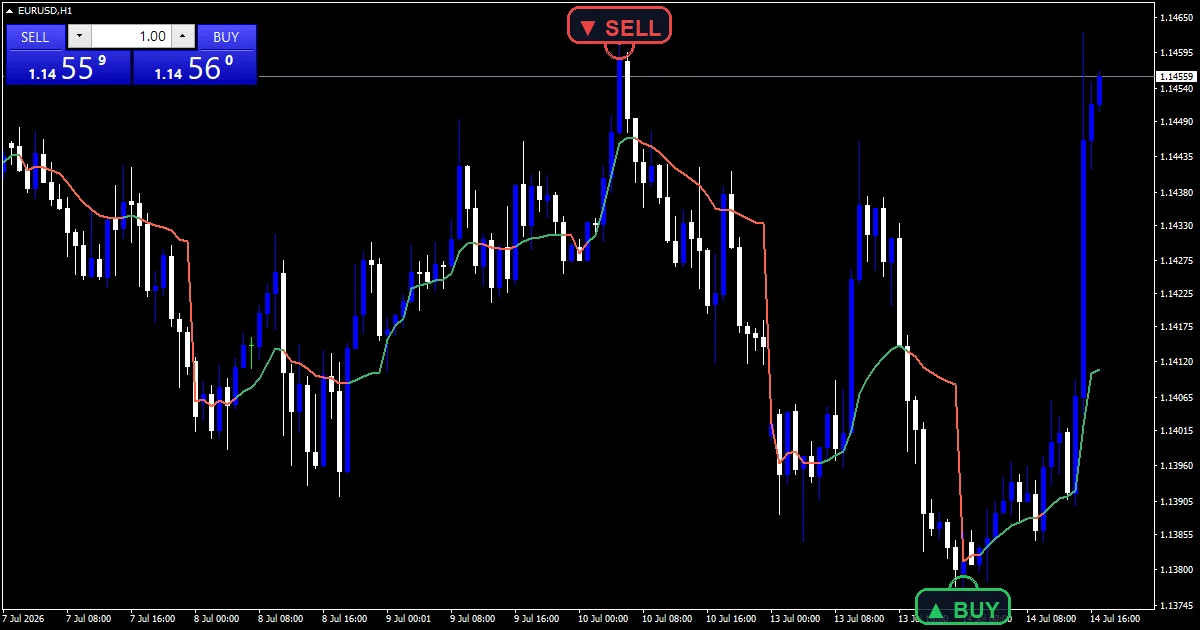
This build ships as a compiled .ex4 for MT4 and .ex5 for MT5; the screenshots below come from EURUSD H1.
| Platforms | MT4 (.ex4) + MT5 (.ex5) |
|---|---|
| Chart window | Main price chart |
| Plots | 2: VWAP (price above), VWAP (price below) |
| Alerts | popup, push notification, email, sound |
| Inputs | 11 |
Everything the VWAP Indicator draws
VWAP (price above) is the green segment, used while the close sits at or above the line.
VWAP (price below) is the red segment, used when the close is underneath it.
The two plots carry the same value. What you see is one line whose colour is decided by the side price closed on.
- VWAP (price above): line, medium sea green, width 2
- VWAP (price below): line, tomato, width 2
How it all fits together
The running sum
Each bar contributes its price times its volume to one total, and its volume alone to another. Dividing the first by the second gives the line.
PriceMode picks which price goes into that product. The default is the typical price, meaning the high, low and close on the bar averaged together.
Where the session starts again
ResetDaily compares the date on one bar with the date on the bar before it. When those differ, both totals go back to zero.
That is what makes the line start fresh each day rather than dragging the whole chart history behind it. Turn ResetDaily off and the sums run from the oldest bar loaded.
Tick volume against real volume
UseRealVolume decides which volume figure feeds the sum. It defaults to false, so the tool weights by tick volume.
Switch it on only when your broker feed carries a real volume figure for that symbol. If the field comes through empty the totals break down and the line stops meaning anything.
How to read the pane
Price closing above the line paints it green, and price closing below paints it red.
The line flattens as a day goes on. Early bars move it easily, later ones barely shift it.
A wide gap between price and the line means the session has trended away from its own average.
The first bars after a reset move fast, because the totals behind the line are still small.
Alert channels in this build: popup, push notification, email and sound, one message per closed bar.
Alerts cover popup, push, email and sound, and they fire when the close crosses the line. A bar time guard keeps it to one alert per closed bar.
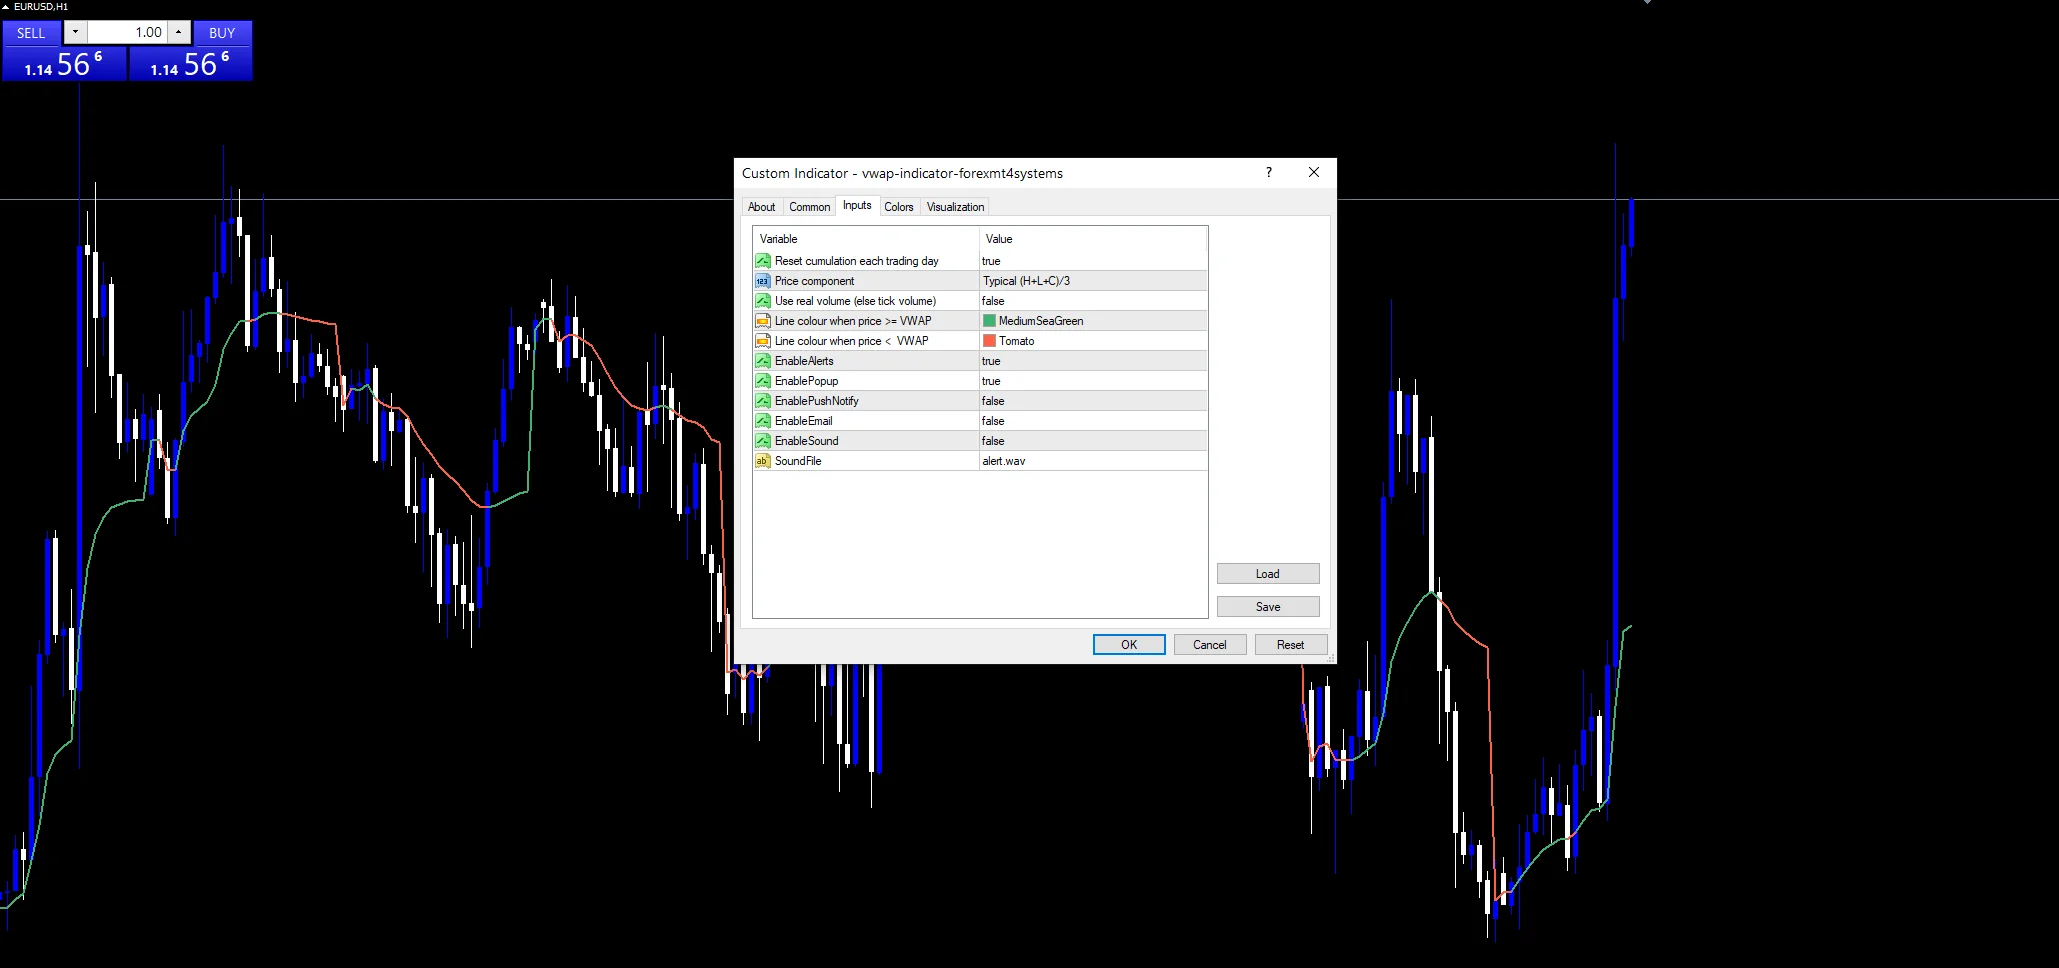
Every VWAP Indicator input
Core settings
| Setting | What it does | Default |
|---|---|---|
ResetDaily |
Reset cumulation each trading day. ResetDaily clears the running totals at each new trading day. It defaults to true, which matches normal session behaviour. | on |
PriceMode |
Price component. PriceMode chooses the price component fed into the sum. It defaults to the typical price, the high, low and close averaged. | VWAP_TYPICAL |
UseRealVolume |
Use real volume (else tick volume). UseRealVolume swaps tick volume for the broker real volume field. It defaults to false. | off |
Display settings
| Setting | What it does | Default |
|---|---|---|
ColorAbove |
Line colour when price >= VWAP. ColorAbove is the colour used while price closes above the line. It defaults to clrMediumSeaGreen. | medium sea green |
ColorBelow |
Line colour when price < VWAP. ColorBelow is the matching colour for closes underneath, clrTomato by default. | tomato |
Alert settings
| Setting | What it does | Default |
|---|---|---|
EnableAlerts |
(see inputs panel) | on |
EnablePopup |
(see inputs panel) | on |
EnablePushNotify |
(see inputs panel) | off |
EnableEmail |
(see inputs panel) | off |
EnableSound |
(see inputs panel) | off |
SoundFile |
(see inputs panel) | alert.wav |
Picking a chart for it
The screenshot uses EURUSD H1. A daily resetting average works best on intraday charts, where a session holds enough bars for the line to settle. M5 through H1 give it room. On daily and weekly charts a daily reset leaves the line sitting on each bar, which tells you nothing. Turn ResetDaily off if you want a running average across the whole loaded history instead.
When the VWAP Indicator fails
Tick volume counts price updates, not traded size. The weighting is a rough proxy on a forex chart rather than a record of what changed hands.
The line stiffens as a session fills up. Late in the day it barely responds, even to a sharp move.
Right after a reset the line sits almost on top of price, so early crosses carry very little information.
Gaps and thin holiday sessions distort the totals, and the line carries that distortion for the rest of the day.
Copy the compiled VWAP Indicator file into your MQL4/Indicators folder, and the MT5 build into MQL5/Indicators, then restart the terminal and drag it onto a chart. The step-by-step guide with screenshots is at how to install MT4 and MT5 indicators.
Download the VWAP Indicator for MT4 and MT5
The zip holds the compiled VWAP Indicator build for MT4 and MT5, plus a short README. Compiled files only, no source. Enter your email below and the download link arrives in your inbox.
Download this indicator free
Enter your email and the file is yours. You also get the full MT4 and MT5 library.
FAQ
What does PriceMode set to typical price actually use?
Typical price is the high, the low and the close on a bar added together and divided by three. That figure is multiplied by the bar volume and added to the running total. Other modes swap in a different price component, but the weighting step stays exactly the same.
Why does the VWAP line flatten later in a session?
Every bar adds to a total that already holds the session so far. Early on that total is small, so one bar shifts the average a lot. By the end of a day the same bar is a small fraction of the sum, and the line barely reacts to it.
Should I turn UseRealVolume on for a forex pair?
Only if your broker publishes a real volume figure for that symbol. UseRealVolume defaults to false and the tool falls back on tick volume, which counts price updates. If the real volume field arrives empty, the sums break down and the line stops being meaningful.
What happens to the line if I switch ResetDaily off?
The running totals never clear. The average then covers every bar loaded on the chart, so it becomes a long term weighted mean rather than a session line. It moves very slowly and the colour changes far less often than it would with a reset.
Are results guaranteed?
No. Trading involves risk. Results are not guaranteed; past performance is not indicative of future results. Use the VWAP Indicator as one input. Always backtest before trading live.
Category: this is part of our Volume collection. Browse more Volume for MetaTrader, or explore every MT4 indicator and MT5 indicator on the site.
External references
- Learn more about the underlying method in Smithsonian Agreement on Wikipedia.
- For wider market background, see Technical Analysis at StockCharts ChartSchool.

About the author
Written by Dominic Walsh, a Forex trader and MT4/MT5 indicator, Expert Advisor and script developer. Every tool on forexmt4systems.com is tested on live charts before release and ships with ready-to-use compiled MT4 (.ex4) and MT5 (.ex5) files. Learn more about the trader and developer behind this site.
How we build, test and correct every tool: Editorial & Testing Policy. Trading carries risk; see the disclaimer.