
The xsupertrend candles indicator draws the familiar trailing band and pays attention to one detail most builds skip. At every flip it seeds the ending segment with the new value, so the lime and red runs join rather than leaving a gap where the direction changed.
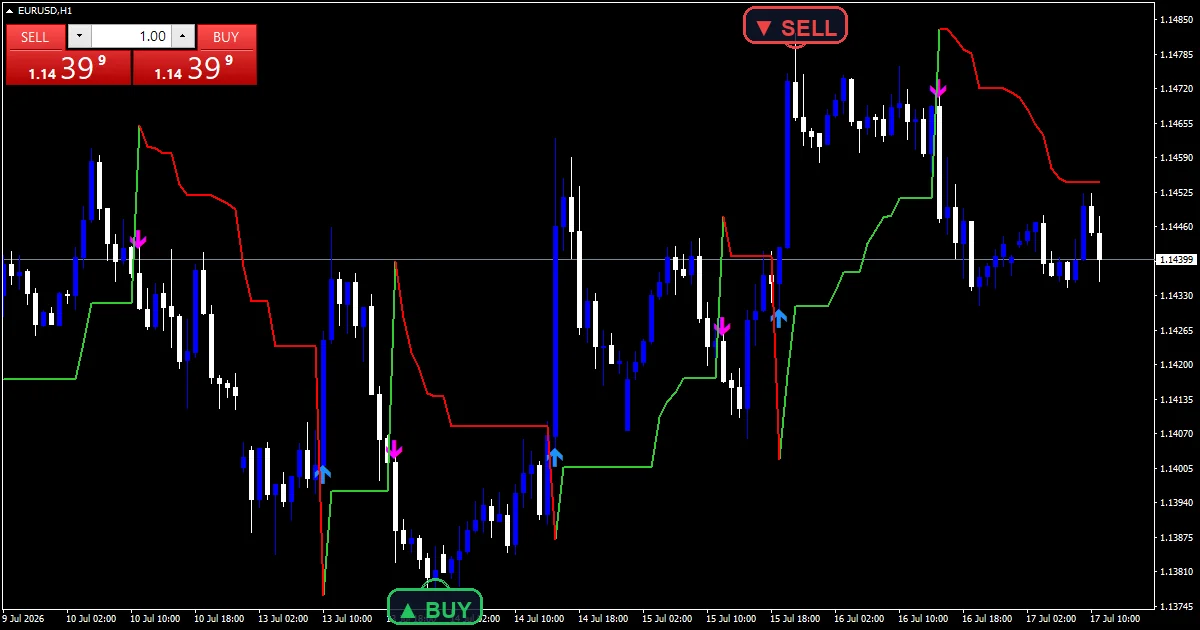
This build ships as a compiled .ex4 for MT4 and .ex5 for MT5; the screenshots below come from EURUSD H1.
| Platforms | MT4 (.ex4) + MT5 (.ex5) |
|---|---|
| Chart window | Main price chart |
| Plots | 4: Buy, Sell, SuperTrend Up, SuperTrend Down |
| Alerts | popup, push notification, email, sound |
| Inputs | 9 |
What the build shows
SuperTrend Up is the lime green line below price in an uptrend.
SuperTrend Down is the red line above price in a downtrend.
Buy places a dodger blue arrow and Sell places a magenta one at each flip.
Marks sit `ArrowGapPts` `10` from the candle.
- Buy: arrow, dodger blue, width 2, arrow code 233
- Sell: arrow, magenta, width 2, arrow code 234
- SuperTrend Up: line, lime green, width 2
- SuperTrend Down: line, red, width 2
What the file computes
Placing the raw bands
mid takes high plus low over two. The upper band adds `Multiplier` `3.0` times iATR at `AtrPeriod` `10`, and the lower band subtracts it. Both get recomputed fresh on every bar.
Ratcheting them
FinalUp keeps the tighter of the new band and the previous one, unless the earlier close broke through. FinalLo mirrors that. Neither band can drift back toward price while the direction holds.
Bridging the flip
At a change of direction the code writes the new line value into the ending segment as well. Without that step the two coloured buffers would leave a one-bar hole exactly where the flip happened.
Using it on a chart
Line colour is the direction reading and the arrows mark the change.
The bridged segments make the flip point easy to see at a glance.
A ten-bar ATR reacts quickly, so the band width moves within a session.
Three ATR is a wide distance, which suits sitting through a pullback.
Alert channels in this build: popup, push notification, email and sound, one message per closed bar.
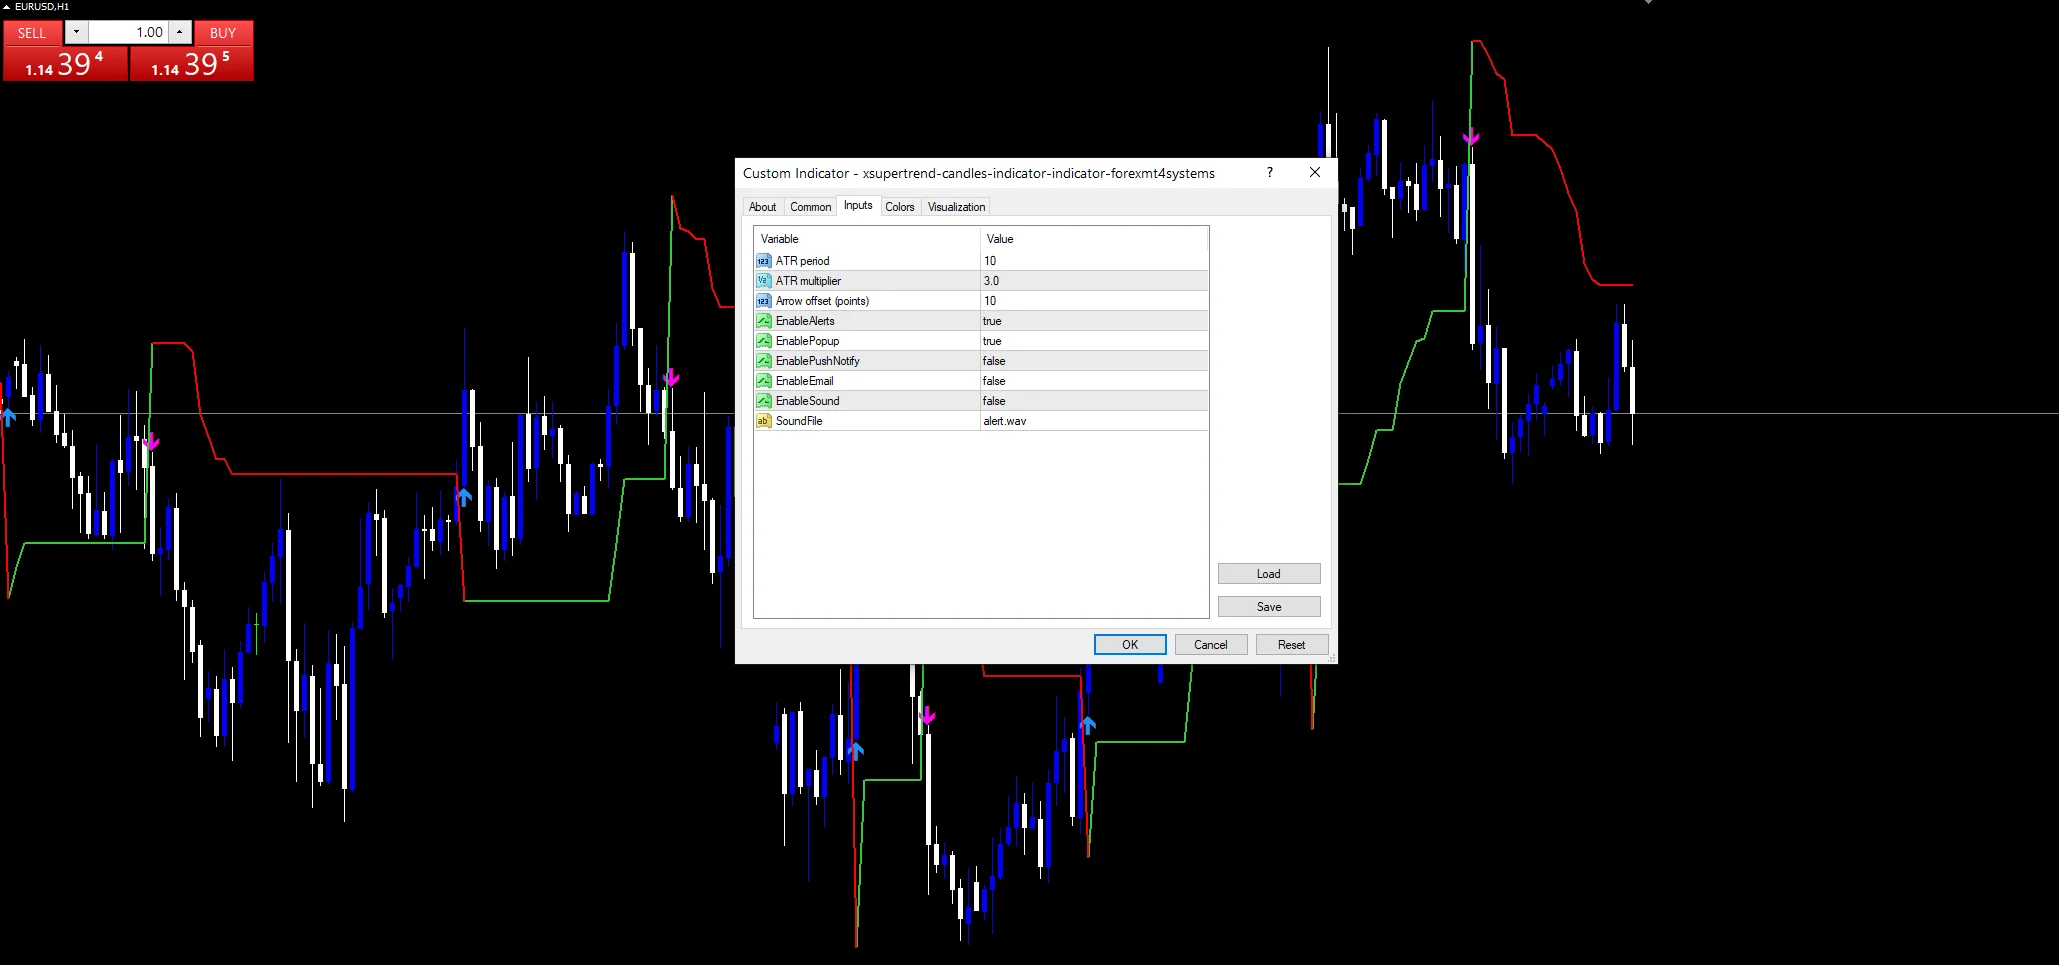
`EnableAlerts` arrives switched on and `EnablePopup` does the talking. `EnablePushNotify`, `EnableEmail` and `EnableSound` all begin false. `SoundFile` picks the clip. The flip test reads a closed bar, one message per bar.
Every Xsupertrend Candles Indicator input
Core settings
| Setting | What it does | Default |
|---|---|---|
AtrPeriod |
ATR period. How many bars the range average covers, default `10`. | 10 |
Multiplier |
ATR multiplier. How far the band hangs from the midpoint, in ATR units, default `3.0`. | 3.0 |
Display settings
| Setting | What it does | Default |
|---|---|---|
ArrowGapPts |
Arrow offset (points). Gap between a flip mark and the candle, in points, default `10`. | 10 |
Alert settings
| Setting | What it does | Default |
|---|---|---|
EnableAlerts |
Master switch for the line flip alerts, default `true`. | on |
EnablePopup |
Terminal dialog on a line flip, default `true`. | on |
EnablePushNotify |
Phone push on a line flip, default `false`. | off |
EnableEmail |
Mail delivery on a line flip, default `false`. | off |
EnableSound |
Sound playback on a line flip, default `false`. | off |
SoundFile |
Wav clip for the flip alert, default `alert.wav`. | alert.wav |
Home chart
A trailing band rewards markets that run. EURUSD H1 is the reference chart, where `AtrPeriod` at `10` covers under half a day. On M5 the flips arrive often and each gives back three ATR. On H4 one colour run can hold for a fortnight.
When it is unreliable
A short ATR window makes the band widen sharply after one busy bar.
Ranges produce repeated flips, each giving back the band distance.
Bridging fixes the drawing, not the lag. The flip still confirms after the turn.
Copy the compiled Xsupertrend Candles Indicator file into your MQL4/Indicators folder, and the MT5 build into MQL5/Indicators, then restart the terminal and drag it onto a chart. The step-by-step guide with screenshots is at how to install MT4 and MT5 indicators.
Background reading on the method behind the Xsupertrend Candles Indicator: Asset-backed commercial paper program on Wikipedia, Distance From Highs at StockCharts ChartSchool.
Download the Xsupertrend Candles Indicator for MT4 and MT5
The zip holds the compiled Xsupertrend Candles Indicator build for MT4 and MT5, plus a short README. Compiled files only, no source. Enter your email below and the download link arrives in your inbox.
Download this indicator free
Enter your email and the file is yours. You also get the full MT4 and MT5 library.
FAQ
What does the SuperTrend Up bridge fix?
A one-bar gap in the drawing. Two coloured buffers cannot share a bar, so the line normally breaks where the direction changes. Writing the new value into the ending segment closes that hole without touching the calculation.
Why does AtrPeriod default to 10?
It is short enough for the band to adapt within a session. The trade is jumpiness, since one large candle widens the band noticeably. Lengthen it toward 20 for a steadier distance that ignores a single busy hour.
Does AtrPeriod ever let the up line fall?
Not while the direction reads up. FinalLo keeps the higher of the new band and the previous one, so the line holds or rises. It only leaves that side once price closes through the opposite band.
Is Multiplier at 3.0 too wide for M5?
It often is. Three ATR on a fast chart means giving back a large share of each move at the flip. Traders on M5 usually pull it toward 2.0, which tightens the line and produces more flips.
Are results guaranteed?
No. Trading involves risk. Results are not guaranteed; past performance is not indicative of future results. Use the Xsupertrend Candles Indicator as one input. Always backtest before trading live.
Category: this is part of our Trend collection. Browse more Trend for MetaTrader, or explore every MT4 indicator and MT5 indicator on the site.
External references
- For background on this concept, see Asset-backed commercial paper program on Wikipedia.
- For broader market context, see Distance From Highs at StockCharts ChartSchool.

About the author
Written by Dominic Walsh, a Forex trader and MT4/MT5 indicator, Expert Advisor and script developer. Every tool on forexmt4systems.com is tested on live charts before release and ships with ready-to-use compiled MT4 (.ex4) and MT5 (.ex5) files. Learn more about the trader and developer behind this site.
How we build, test and correct every tool: Editorial & Testing Policy. Trading carries risk; see the disclaimer.