
A Heikin Ashi strategy uses averaged candles to strip noise out of a chart. A trend then shows up as a clean run of same-coloured bodies, instead of a jumble of red and green. The name means “average bar” in Japanese, and the maths behind it is simple arithmetic. This guide gives you the exact formula, the classic candle reads, and a practical way to trade with them. It also covers the one limitation that matters most: Heikin Ashi prices are not real market prices.
What Heikin Ashi candles are
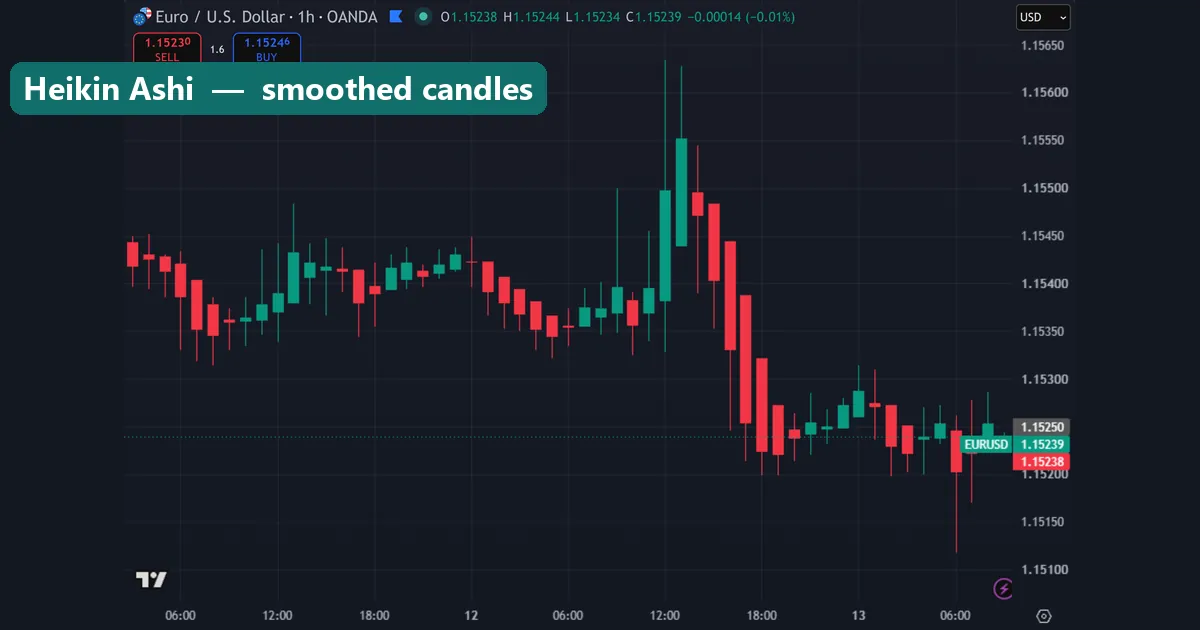
Heikin Ashi candles look like normal candlesticks, yet each one blends the current bar with the bar before it. That blending smooths the chart. Small counter-moves get absorbed, so a trending market produces long runs of one colour, and a choppy market produces short bodies with wicks on both sides.
Standard candlesticks show four raw numbers per bar: open, high, low and close. Heikin Ashi replaces all four with calculated values. New to reading bars? Start with our guide on how to read candlestick charts first. Classic patterns behave differently once the prices are averaged.
The Heikin Ashi formula
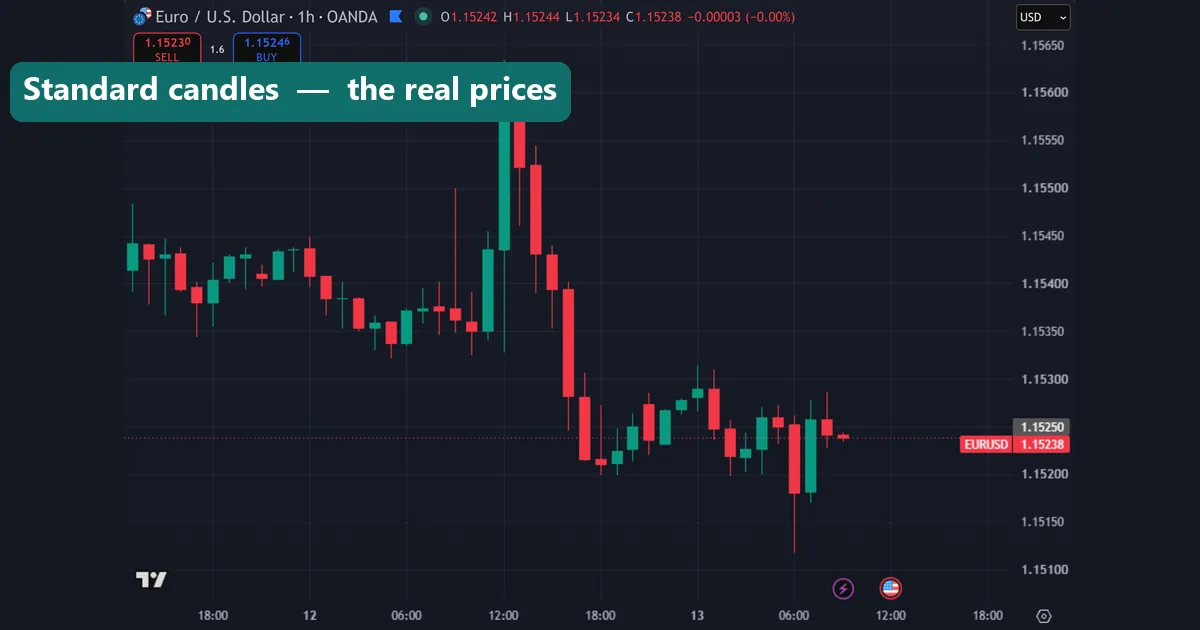
Four short equations build every candle. Here they are, exactly as the platform calculates them:
HA close = (open + high + low + close) / 4, using the current bar’s real values. It is the average of the whole bar rather than the closing print.
HA open = (previous HA open + previous HA close) / 2. Note the inputs: the previous Heikin Ashi values, not the previous real prices. This recursion is what carries smoothing forward through the chart.
HA high = the highest of the real high, the HA open and the HA close. HA low = the lowest of the real low, the HA open and the HA close. Both extremes include the candle’s own body, so the wick always encloses it.
The very first candle needs a seed, since no previous Heikin Ashi values exist. Platforms usually set the first HA open to the average of the first bar’s real open and close. After that, the recursion takes over and the seed’s influence fades quickly.
What the smoothing actually does
Averaging removes most of the flicker. A single sharp candle against the trend rarely flips the colour, because three of the four inputs still point the original way. Traders therefore see structure instead of noise, and a trend becomes visually obvious from across the room.
That clarity costs you something, though. Each candle carries information from the bar before it, so the plot lags. Turns show up a candle or two late, and the size of a body no longer reflects the real range of that bar. Smoothing and lag are the same mechanism viewed from two sides.
Reading Heikin Ashi candles
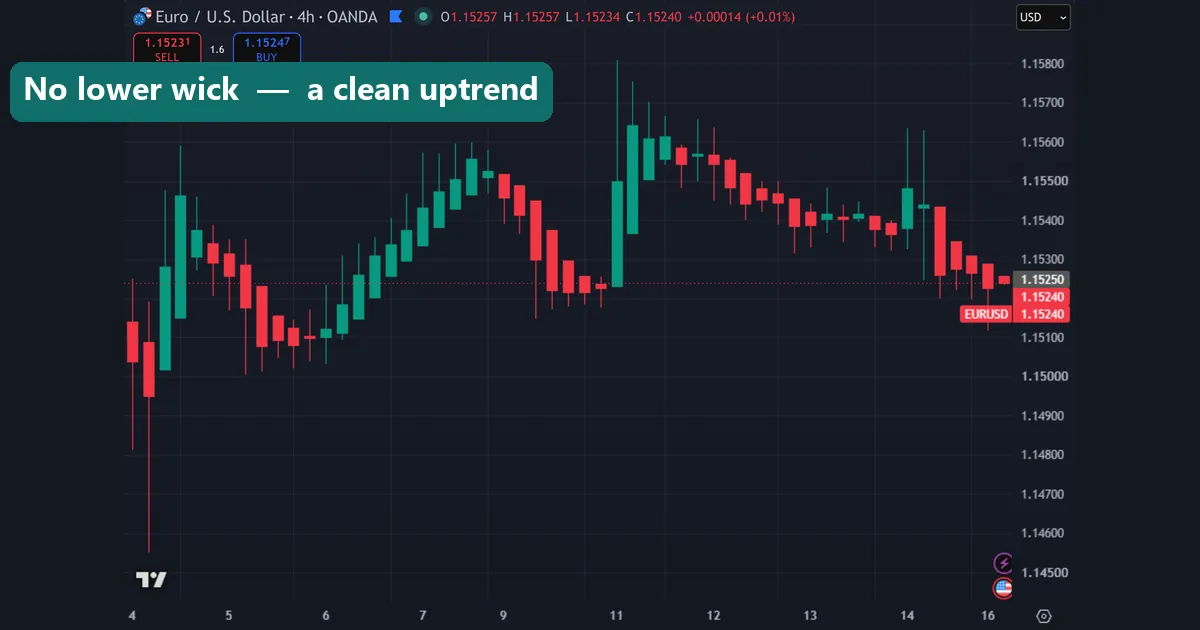
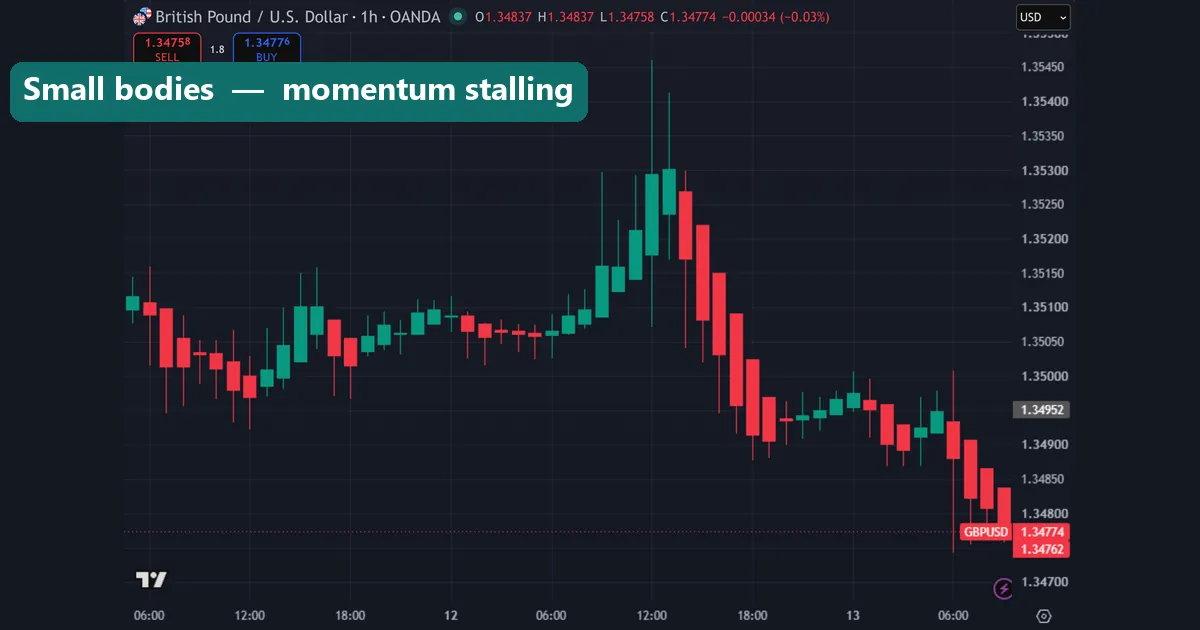
Three reads do most of the work. First, a run of green candles with no lower wick signals a strong uptrend, since price never traded below the body during those bars. The mirror image, red candles with no upper wick, marks a strong downtrend. Second, small bodies with wicks on both sides show indecision. Momentum has stalled, and ranges or reversals often follow. Third, a change of colour flags a possible turn, especially when it arrives after a doji-style candle.
None of those reads is a signal on its own. Colour changes happen constantly in a range, so context decides. Ask what the higher timeframe is doing, and whether price sits at a level that matters, before you act on any of them.
A practical Heikin Ashi strategy
Most traders use Heikin Ashi as a filter rather than a trigger. Put the smoothed candles on a higher timeframe, such as H4, and let the colour define your bias. Then drop to H1 or M15 with standard candles and take entries only in that direction. You get the trend clarity without trading blind on averaged prices.
The second common use is trade management. Minor pullbacks rarely flip the colour. So a run of same-coloured candles helps you hold a winner through ordinary noise, rather than exiting at the first red bar. Many traders exit when two opposite-coloured candles close, or when a body shrinks and wicks appear on both sides.
Combine that with a mechanical stop placed on the real chart. Our guide on how to use ATR as a stop loss shows a volatility-based method that suits this style. The forex position sizing calculator then converts that stop distance into lots.
Heikin Ashi candle types and what they suggest
| Candle | Appearance | What it suggests | What to do |
|---|---|---|---|
| Strong up | Green body, no lower wick | Buyers in control, trend healthy | Hold longs, look for pullback entries |
| Strong down | Red body, no upper wick | Sellers in control, trend healthy | Hold shorts, avoid counter-trend buys |
| Weakening | Shrinking body, wick appearing | Momentum fading | Tighten stops, stop adding |
| Indecision | Small body, wicks both sides | Balance between buyers and sellers | Stand aside, wait for a break |
| Colour change | First opposite-coloured body | Possible turn, often just a pause | Confirm on the real chart before acting |
| Long wick both ends | Small body, wide range | Volatility without direction | Widen stops or skip the session |
Download the complete indicator database
Put these concepts on your charts. One email unlocks the full library of 1,380+ indicators with compiled MT4 and MT5 files, plus my TradingView scripts. No paywall, no spam, unsubscribe any time.
Get free access to my indicator database
One email unlocks 1,380+ free MT4, MT5 and TradingView indicators — the complete library. No single-tool download; you get the whole database.
The critical limitation: these are not real prices
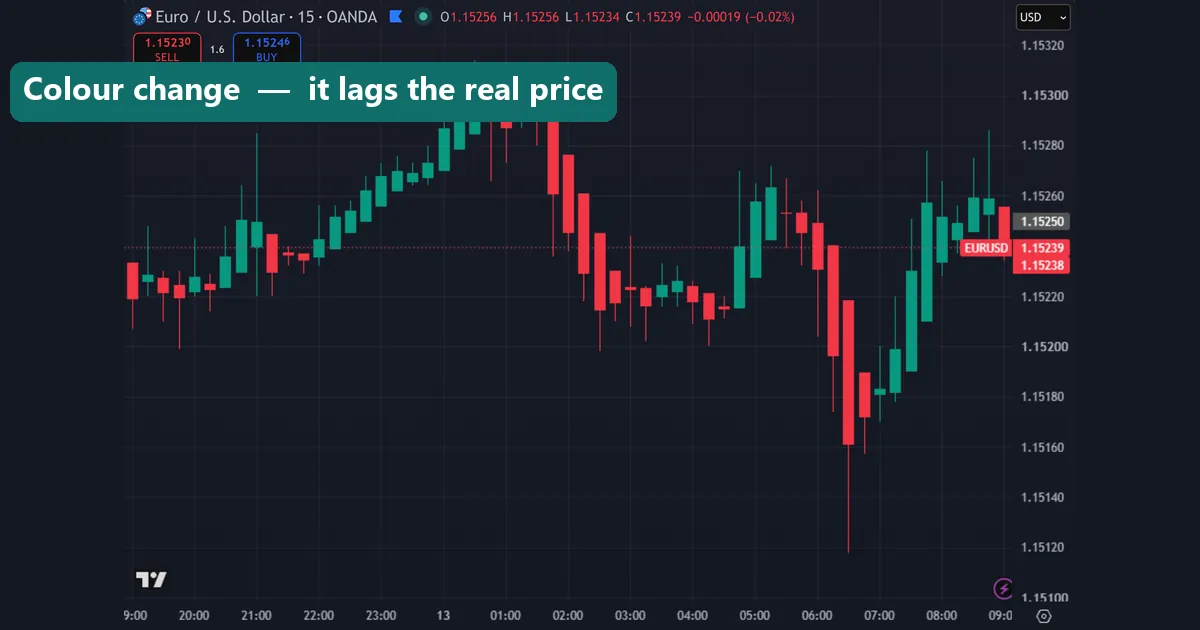
Read this section twice, because it is where traders lose money. Every value on a Heikin Ashi candle is an average. The open you see never occurred. The close you see never occurred either. Those two numbers are arithmetic outputs, and no order ever filled at them.
Several consequences follow, and each one is practical. You cannot use a Heikin Ashi open or close as an entry price, a stop level or a target. Your broker trades the real market, and it knows nothing about the smoothed series. Gaps disappear as well. A weekend gap gets averaged into the candle, so the chart hides a jump that genuinely happened. Support and resistance drawn from HA bodies will sit at levels the market never touched.
Lag is the second cost. A colour change arrives after the real turn, sometimes by two or three bars. Entries taken purely on colour therefore start late, and exits taken purely on colour finish late. Backtesting compounds the problem: a test run against Heikin Ashi values fills orders at prices that never existed, which produces results no live account can reproduce.
So keep the rule simple. Use Heikin Ashi to read direction, and place every order — entry, stop and target — using the real candlestick chart. Many traders keep two windows open side by side for exactly that reason, or overlay the smoothed candles on a standard chart.
Common Heikin Ashi mistakes
Three errors show up again and again. Treating HA prices as tradeable levels tops the list, and it leads directly to stops placed where price never traded. Backtesting on Heikin Ashi data comes next, since averaged fills flatter every result. Ignoring the lag finishes the set: traders enter on a colour flip near the end of a move, then wonder why the trend reverses immediately. Add a fourth if you like — using Heikin Ashi alone. Pair it with structure, a level, or a momentum tool, and it becomes far more useful.
Where to go next
Heikin Ashi works best inside a wider method. Browse our forex currency trading strategies for complete rule sets. Our roundup of the best day trading technical indicators covers tools that pair well with smoothed candles. To add a custom version to your platform, follow the guide on how to install MT4 and MT5 indicators. For further reading, Investopedia compares Heikin Ashi and standard candlesticks at Investopedia, and the candlestick chart article on Wikipedia covers the original format.
FAQ
What is the Heikin Ashi formula?
HA close equals the average of the current bar’s open, high, low and close. The HA open equals the average of the previous HA open and previous HA close. For the wicks, take the extremes of the real high or low together with the HA open and close.
Are Heikin Ashi prices real market prices?
No. Every value is calculated, so the displayed open and close never traded. Read direction from the smoothed candles, then place entries, stops and targets using the real candlestick chart your broker actually fills against.
Which timeframe suits a Heikin Ashi strategy?
H4 and daily charts work well, because smoothing needs room to help. Many traders set bias on the higher timeframe, then execute on H1 or M15 with standard candles to keep entries precise.
Do Heikin Ashi candles repaint?
No. Once a bar closes, its values are fixed, since the formula uses only completed data. The current bar updates in real time like any candle, so wait for the close before you judge a colour change.
Can I backtest a strategy on Heikin Ashi candles?
Not reliably. A test that fills orders at averaged prices reports results the market could never deliver. Generate signals from Heikin Ashi if you wish, but always fill and measure the trades on real prices.
Will a Heikin Ashi strategy always work?
No. Smoothing improves clarity and nothing more, and the lag it adds can cost you the start of a move. Trading involves risk, results are not guaranteed, and past performance is not indicative of future results.

About the author
Written by Dominic Walsh, a Forex trader and MT4/MT5 indicator, Expert Advisor and script developer. Every tool on forexmt4systems.com is tested on live charts before release and ships with ready-to-use compiled MT4 (.ex4) and MT5 (.ex5) files. Learn more about the trader and developer behind this site.