
The MetaTrader 4 Strategy Tester replays stored historical price data against an Expert Advisor, so you can see how a set of rules would have behaved before you risk a cent. It is built into MT4, needs no extra software, and finishes a year of H1 bars in well under a minute. This guide walks through every field in the tester. It explains the three modelling modes, shows which report numbers matter, and sets out — plainly — what MT4 backtesting cannot tell you.
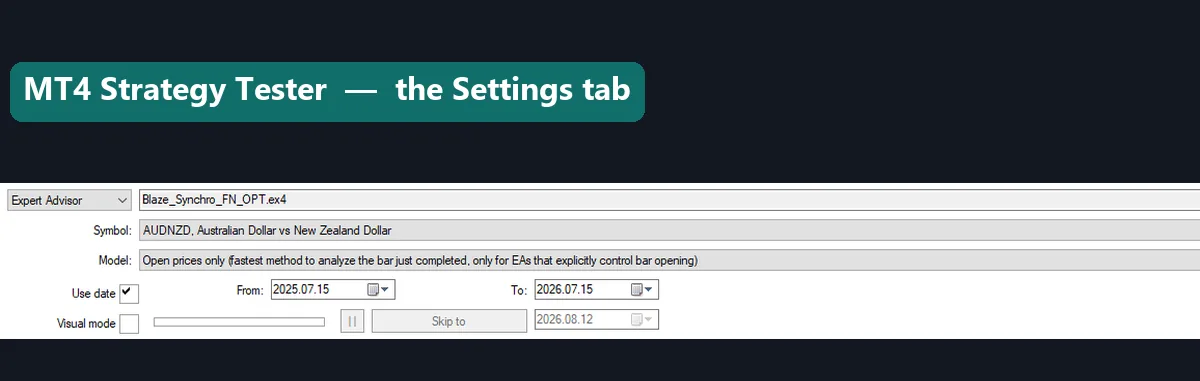
What the MetaTrader 4 Strategy Tester does
The tester loads the bars sitting in your terminal. It then feeds them to your Expert Advisor one step at a time. Your EA reacts exactly as it would live. It opens orders, trails stops, and closes positions, while MT4 records each trade and builds a report at the end. Because the run happens offline, you can compare ten variations of an idea in an afternoon.
Indicators can be tested too, but only in visual mode. There the tester draws a chart and steps through it, so you watch your indicator plot bar by bar. That makes repainting obvious. For anything involving orders, though, you need an EA, because the tester places trades through EA code and never through an indicator.
How to open the tester and load history
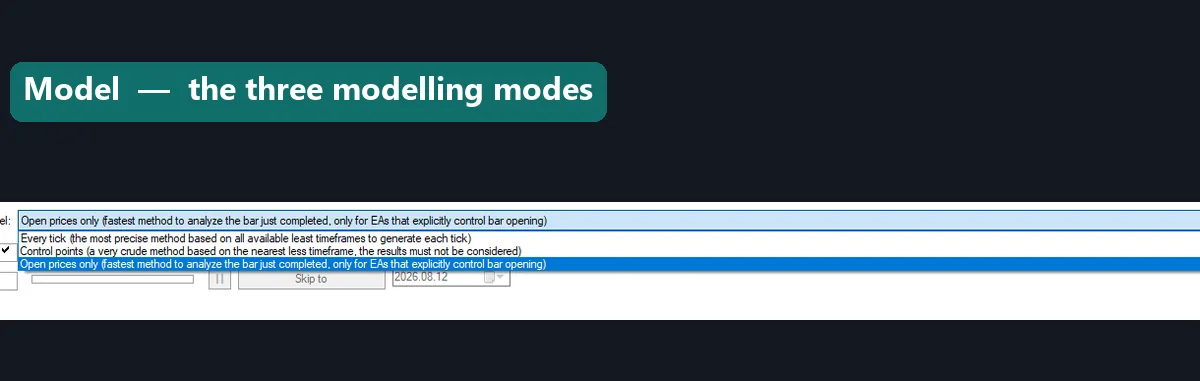
Open MT4, then click View → Strategy Tester on the top menu. The keyboard shortcut Ctrl+R does the same job. A panel docks along the bottom of the terminal. It holds a Settings tab, a Journal tab, and — once a run finishes — Results, Graph and Report tabs. Everything you configure lives on Settings.
Before your first run, download proper history. Go to Tools → History Center, press F2, pick the symbol, select the M1 period and click Download. Data quality matters more than any single setting in the tester. Sparse history creates gaps, and gaps create numbers you cannot trust. If your EA reads custom indicators, install them first — our walkthrough covers how to install MT4 and MT5 indicators into the right folders.
Every Strategy Tester field, explained
| Field | What it controls | Practical advice |
|---|---|---|
| Expert Advisor | The EA (or indicator) MT4 will run | Click Expert properties to set lots, stops and inputs |
| Symbol | The instrument tested | Match the exact symbol you trade, suffix included |
| Model | How ticks inside each bar are simulated | Every tick unless your EA acts only on bar open |
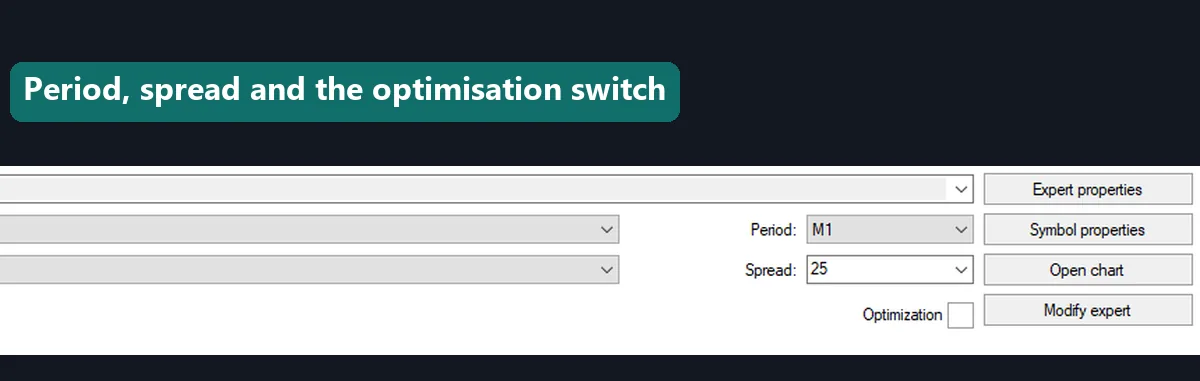
| Period | Chart timeframe the EA runs on | Use the timeframe the strategy was designed for |
| Spread | Fixed spread applied to every trade, in points | Set it above your broker’s average, never below |
| Use date | Start and end of the test window | Include calm and volatile years, not just one trend |
| Visual mode | Draws the chart and animates the run | Great for debugging, far slower for long tests |
| Optimization | Repeats the test across ranges of inputs | Powerful, and the fastest route to curve-fitting |
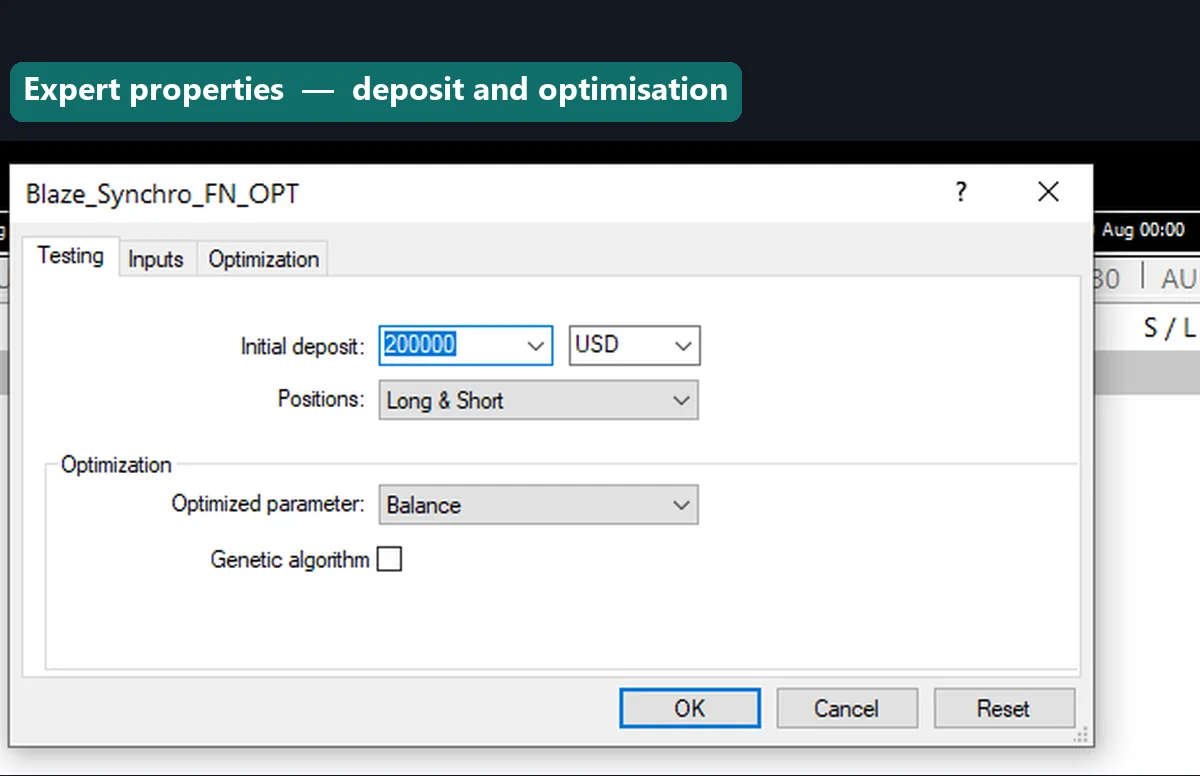
Two buttons sit beside these fields. Expert properties holds your inputs. It also holds the start balance and the ranges you optimise. Symbol properties shows the contract specification, including tick value and stop level.
The three modelling modes
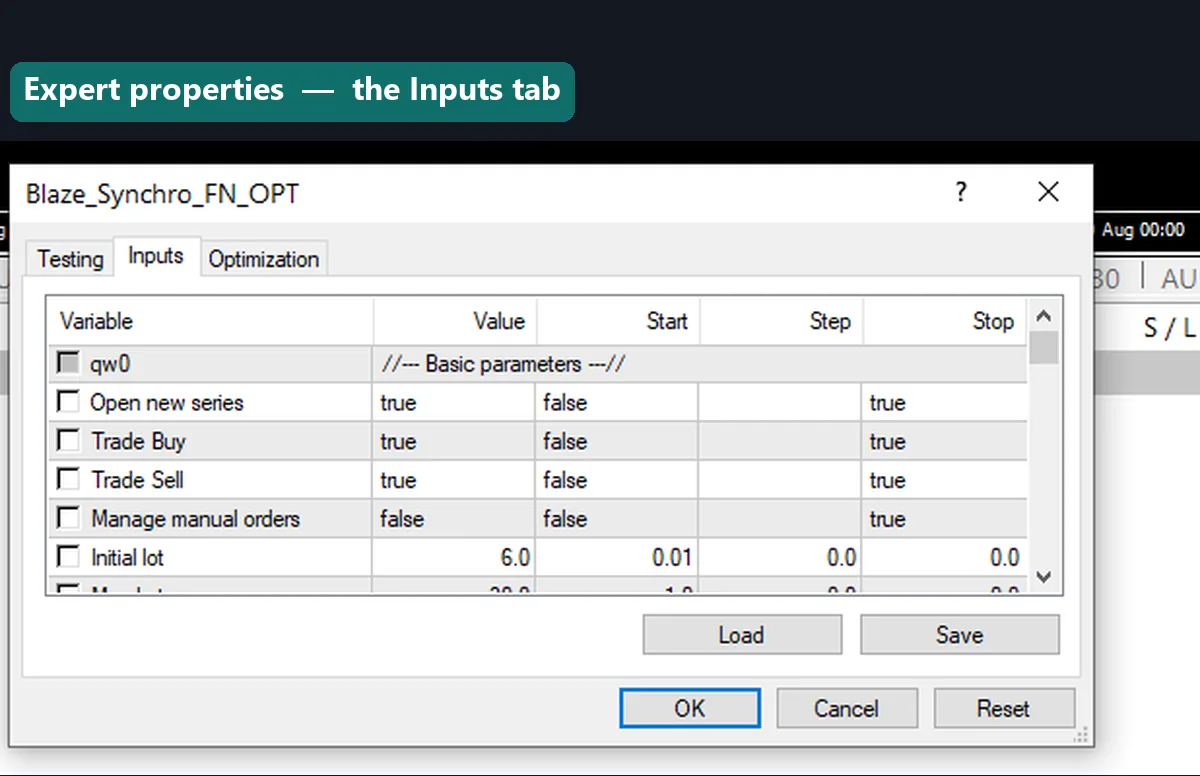
Every tick is the most accurate mode and the slowest. MT4 builds a synthetic tick stream inside each bar. It uses the smaller timeframes you have downloaded, so intrabar highs and lows arrive in plausible order. Any EA that uses stops, targets or intrabar entries needs this mode. Choose it by default.
Control points is an approximation. MT4 uses the nearest smaller timeframe and generates a handful of points per bar instead of a full stream. Runs finish much faster, yet intrabar sequence becomes guesswork. Treat control-point results as a rough filter, never as evidence.
Open prices only is the fastest mode by a wide margin, and it is valid in exactly one case: an EA that makes every decision at the open of a bar and never reacts inside it. Many bar-close systems fit that description perfectly, so the mode is genuinely useful. Run a stop-and-target EA this way, however, and the results are meaningless.
Modelling quality and the 90% figure
After each run the report prints a modelling quality percentage. It measures how well the tester could reconstruct price movement inside each bar, not how good your strategy is. With complete M1 history, Every tick tops out at 90%. Control points reports 25%. Open prices only reports n/a, since no intrabar modelling happened at all.
So treat the number as a data-health check. Anything below 90% on Every tick means your M1 history has holes, and MT4 filled them by interpolation. Download the missing data and run again. Also watch the Journal tab for “mismatched chart errors” — that count tells you how many bars failed to line up with the smaller timeframe.
How to read the MT4 backtest report
Net profit grabs attention first, and it deserves the least. A single oversized trade can carry an entire equity curve, so read the supporting numbers before you believe the headline.
Start with maximal drawdown. It records the deepest peak-to-trough fall in the account, in both currency and percent. That number decides whether you could have held the position through the bad months. A curve that gains 40% while dropping 35% along the way is not tradeable for most people. Next, check total trades. Thirty trades prove almost nothing; several hundred across varied conditions start to mean something. Then read profit factor, which divides gross profit by gross loss. Values near 1.0 show a strategy barely covering its costs, while suspiciously high values usually reveal a fitted test rather than a robust one.
Finally, open the Graph tab. A steady curve with shallow dips tells a very different story from a flat line ending in one enormous spike. Size positions against that drawdown, not against the profit — our forex position sizing calculator turns the percentage into an actual lot size.
Download the complete indicator database
Put these concepts on your charts. One email unlocks the full library of 1,380+ indicators with compiled MT4 and MT5 files, plus my TradingView scripts. No paywall, no spam, unsubscribe any time.
Get free access to my indicator database
One email unlocks 1,380+ free MT4, MT5 and TradingView indicators — the complete library. No single-tool download; you get the whole database.
The honest limits of MT4 backtesting
Here is the part most tutorials skip. A backtest describes one broker’s recorded history under one fixed spread. It does not describe the market, and it certainly does not describe your future account.
Spread and commission are simplified. MT4 applies a single spread value across the whole run, yet real spreads widen at the session rollover, around news, and on thin holiday sessions. A scalping EA that clears a 1-point spread in testing can lose money at 3 points live. Slippage and requotes are worse, because the tester models neither. Every order fills at the modelled price, which never happens during fast moves.
Curve-fitting is the biggest trap of all. Optimization tries thousands of input combinations and hands you the best one. Often the best one just fitted the noise in that specific window. Guard against it: optimise on one period, then test the untouched settings on a later period the optimiser never saw. Prefer broad plateaus of decent results over one razor-sharp peak. Keep the number of tunable inputs small.
There are structural limits too. MT4 tests one symbol at a time, so multi-pair baskets and correlation effects fall outside it. Swap charges vary. So do latency and broker stop levels. A strong backtest is evidence that rules were coded correctly and survived history. It never predicts what the next quarter will do.
Forward testing on demo comes next
Once a backtest looks solid, run the same EA on a demo account for several weeks. Forward testing exposes everything the tester hides: real spread behaviour, real fills, weekend gaps and platform disconnects. Compare the demo trades against the backtest over the same dates. Similar behaviour builds confidence, while a large gap points to slippage sensitivity or a coding assumption that only held offline. Use volatility-based exits to keep both tests comparable, as explained in our guide on how to use ATR as a stop loss.
Common backtesting mistakes
Four mistakes cause most bad results. Testing on incomplete M1 history comes first, because interpolated bars invent price action. Setting an optimistic spread comes second; use a pessimistic figure instead. Testing one quiet year comes third, since a single regime tells you nothing about the next. Running an intrabar EA on Open prices only comes fourth. Fix those four and your reports get far more honest.
Where to go next
Backtesting works best alongside a clear method. Browse our forex currency trading strategies for rule sets worth coding. See also our roundup of the best day trading technical indicators for the tools those rules use. Investopedia explains backtesting at Investopedia. The backtesting article on Wikipedia covers the maths.
FAQ
How do I open the Strategy Tester in MT4?
Click View → Strategy Tester on the MT4 menu bar, or press Ctrl+R. The tester docks at the bottom of the terminal. Pick your Expert Advisor, symbol, model and date range on the Settings tab, then press Start.
Which modelling mode should I use?
Use Every tick for almost everything, because it models intrabar movement and respects stops and targets. Open prices only is valid solely for EAs that act at bar open. Control points sits between the two and suits quick sanity checks.
What does 90% modelling quality mean?
It means MT4 reconstructed intrabar price movement from complete M1 history, which is the maximum the platform reports for Every tick. Lower figures signal missing data. Download the M1 history again through the History Center and rerun the test.
Can I backtest an indicator rather than an EA?
Yes, but only in visual mode, where MT4 draws the chart and plots the indicator bar by bar. That reveals repainting clearly. No trades are placed, so you get no performance report from an indicator test.
Why do my live results differ from the backtest?
Live trading adds variable spreads, slippage, requotes, latency and swap charges that the tester simplifies or ignores completely. Optimised settings also tend to fit past noise. Expect live performance to sit below a backtest, sometimes far below.
Does a good backtest mean the strategy will work?
No. A backtest confirms that your rules were coded correctly and survived one broker’s history under one spread. Trading involves risk, results are not guaranteed, and past performance is not indicative of future results.

About the author
Written by Dominic Walsh, a Forex trader and MT4/MT5 indicator, Expert Advisor and script developer. Every tool on forexmt4systems.com is tested on live charts before release and ships with ready-to-use compiled MT4 (.ex4) and MT5 (.ex5) files. Learn more about the trader and developer behind this site.
How we build, test and correct every tool: Editorial & Testing Policy. Trading carries risk; see the disclaimer.