
The stochastic momentum index measures where price closed relative to the midpoint of the recent high-low range, instead of relative to the bottom of that range. That single change makes the SMI indicator far smoother than a raw stochastic %K line. Readings travel roughly between -100 and +100, with a meaningful zero line in the middle. This guide explains how the stochastic momentum index works, how it differs from the classic stochastic, which settings suit scalping, day trading and swing trading, and how to load it on TradingView, MT4 and MT5.
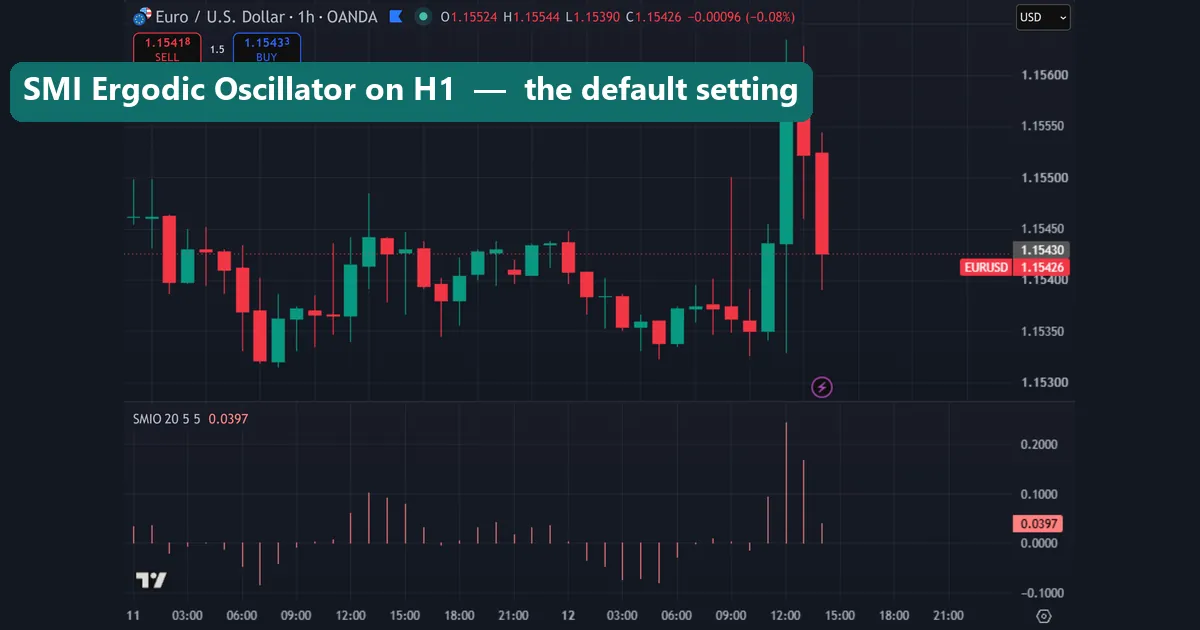
What the stochastic momentum index measures
William Blau introduced the stochastic momentum index in 1993 as a fix for a specific weakness in the original stochastic oscillator. The classic %K compares the close to the lowest low of the lookback window. Every reading therefore sits between 0 and 100, always measured from one edge of the range. Blau moved the reference point to the centre of the range instead.
So the SMI asks a different question: how far above or below the midpoint did price close? Above the midpoint, the value turns positive. Below it, the value turns negative. The formula then double-smooths that distance with exponential averages, divides it by half the range (also double-smoothed), and multiplies by 100. You end up with an oscillator centred on zero.
Two things follow from that design. First, the zero line carries real information, because it marks the midpoint of recent trading. Second, the double smoothing strips out much of the twitchiness that makes a raw stochastic hard to trade.
Stochastic momentum index vs stochastic: the practical difference
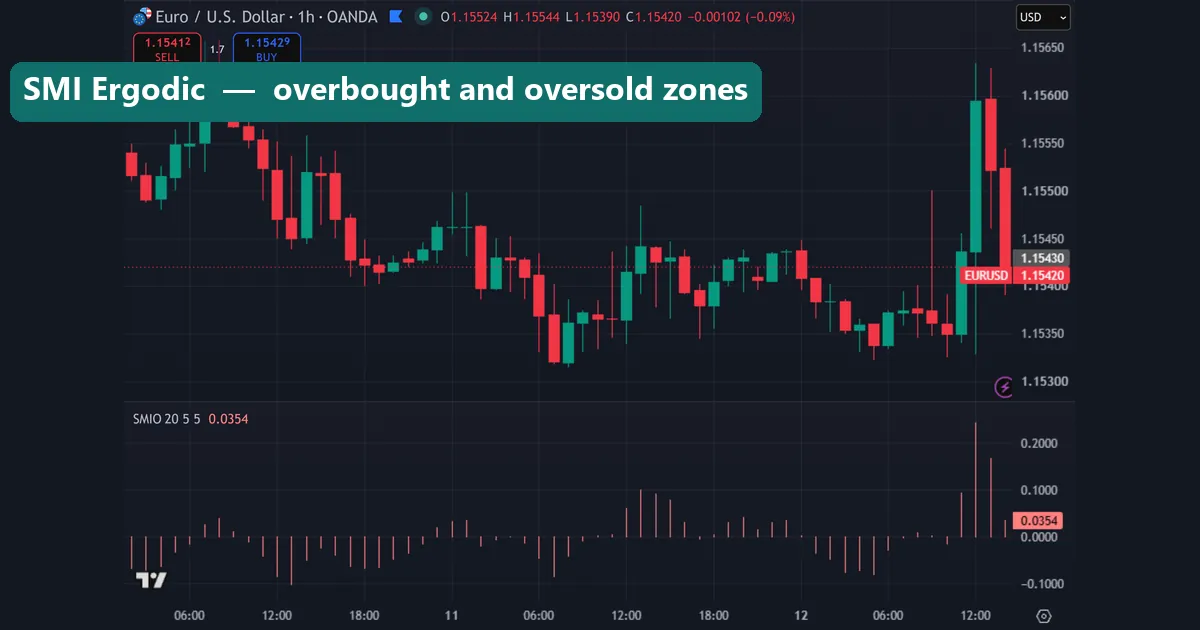
Put both oscillators on the same chart and the contrast is immediate. The standard stochastic slams into the 80 and 20 zones constantly, especially on lower timeframes. Meanwhile the SMI curls rather than snaps. It crosses zero less often, and its swings map more closely to the actual swing highs and lows in price.
Here is the short version of the difference. The classic stochastic answers “where in the range are we?” The SMI answers “which side of the range are we on, and by how much?” Because the second question has a natural neutral point, the SMI works well as a momentum-bias tool and not only as an overbought-oversold gauge.
That smoothing has a cost, though, and it is worth stating plainly. Double exponential smoothing adds lag. The SMI turns later than the raw stochastic, so you will give up a few pips at every reversal. Traders who need the earliest possible signal usually stay with a fast %K and accept the noise. If you want a comparison of the original tool first, see our breakdown of the best stochastic settings.
Default SMI settings and what each input does
Most platforms ship the SMI with a 10/3/3 or 14/3/3 configuration plus a signal line. The numbers are less confusing than they look:
- Length (10 or 14) — the lookback window used to find the highest high and lowest low. Shorter reacts faster.
- First smoothing (3) — the initial EMA applied to the close-minus-midpoint distance.
- Second smoothing (3) — the second EMA, which produces the “double smoothed” character of the line.
- Signal line (3 to 5) — an EMA of the SMI itself, used for crossover signals.
Blau’s original work leaned on longer lookbacks with heavier smoothing. Modern charting packages default to shorter values because intraday traders demanded them. Neither choice is wrong. Just change one input at a time, and test on the pair and timeframe you actually trade.
How to read the SMI on a chart
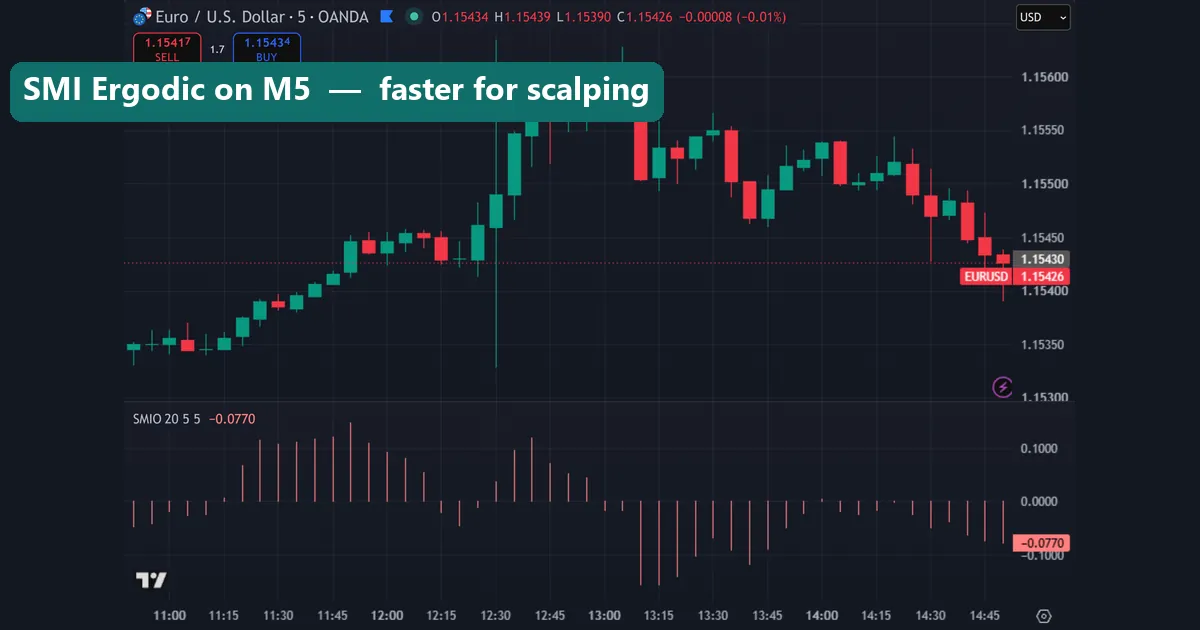
Four readings do most of the work. Take them in order of reliability rather than order of excitement.
Zero-line bias. Above zero, buyers control the recent range. Below zero, sellers do. Many traders use nothing else, treating the SMI as a simple bias filter for entries taken from price structure.
Extreme zones. Readings above +40 mark a stretched advance; readings below -40 mark a stretched decline. These are stretch markers, not sell and buy buttons. In a strong trend the SMI can sit beyond +40 for dozens of candles.
Signal-line crosses. When the SMI crosses above its signal line from an oversold reading, momentum has begun to turn up. The reverse applies at the top. Crosses that happen near zero tend to be noise, so filter them out.
Divergence. Price prints a lower low while the SMI prints a higher low, and selling pressure is fading. Divergence is a warning about momentum, never an entry on its own. Wait for price to confirm with a break of the prior swing high.
Best stochastic momentum index settings by trading style
| Style | Timeframe | Length | Smoothing | Signal | Zones |
|---|---|---|---|---|---|
| Scalping | M1–M5 | 5–8 | 3 / 3 | 3 | ±40 |
| Day trading | M15–H1 | 10 | 3 / 3 | 3 | ±40 |
| Swing trading | H4–D1 | 14 | 3 / 3 | 5 | ±40 to ±50 |
| Position | D1–W1 | 21 | 5 / 5 | 5 | ±50 |
Treat the table as a starting grid. Shorter lengths give earlier turns and more false crosses; longer lengths give cleaner swings and later entries. Volatile symbols such as gold usually need the wider ±50 zones, because ordinary spikes push a ±40 setting into the extreme band too easily.
How to add the SMI on TradingView, MT4 and MT5
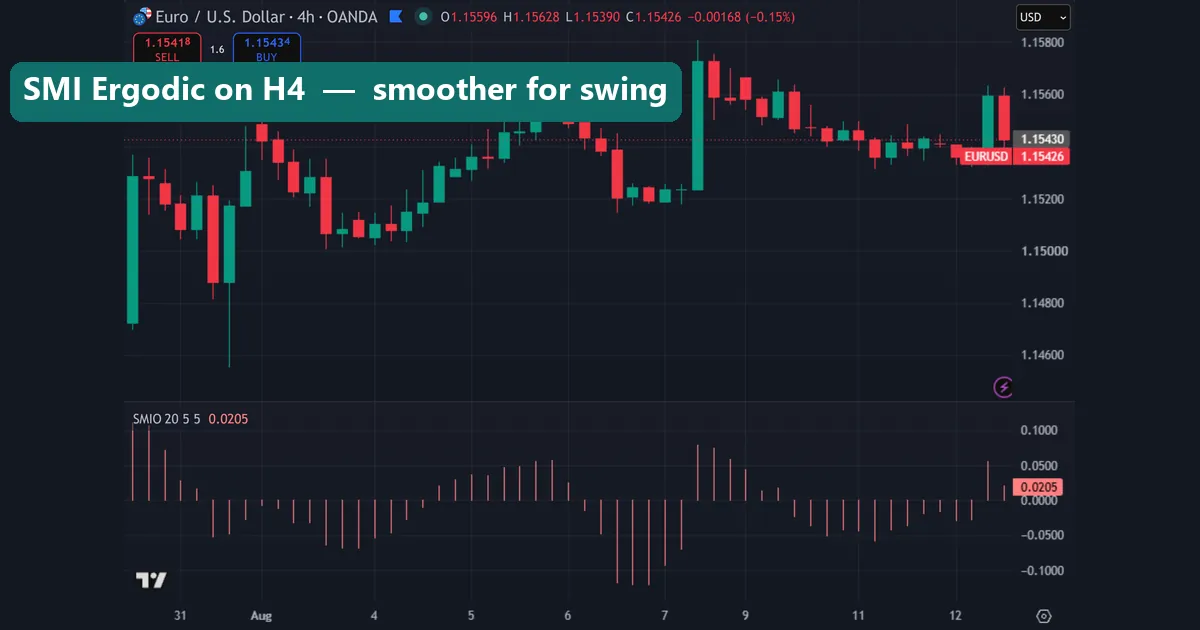
TradingView is the easy one. Open the indicator search, type “Stochastic Momentum Index”, and add the built-in study. Then click the settings gear to edit the lengths, the smoothing values and the extreme levels. Community versions exist too, and many of them add colour fills or alerts.
MetaTrader is where honesty matters. The SMI is not a stock MT4 or MT5 indicator. Insert → Indicators → Oscillators gives you the standard Stochastic Oscillator only, so you need a custom build to get the momentum-index version. Once you have the compiled file, place the .ex4 in the terminal’s MQL4/Indicators folder or the .ex5 in MQL5/Indicators, restart, and the SMI appears under Custom in the Navigator. Our walkthrough on how to install MT4 and MT5 indicators covers the folder paths step by step.
One warning about custom MetaTrader builds: they do not all use identical maths. Some skip the second smoothing pass; others scale the output 0–100 instead of -100 to +100. Compare any file you install against a TradingView chart of the same symbol and timeframe before you trust its levels.
Combining the SMI with a trend filter
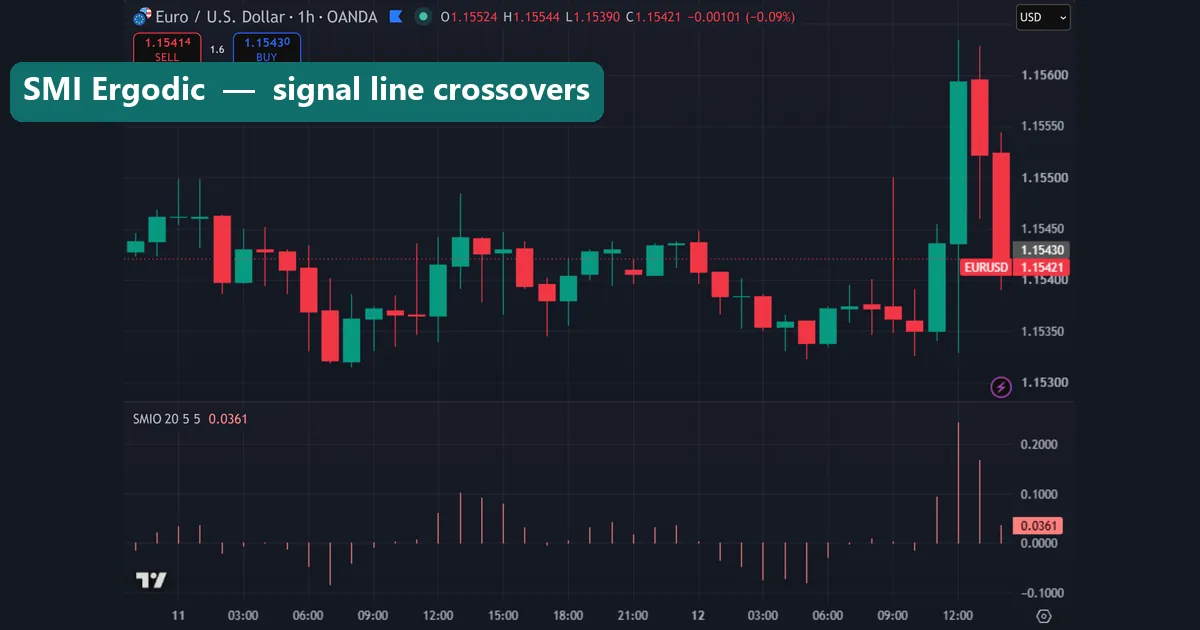
The SMI is an oscillator, so it has the classic oscillator problem. Oversold means nothing in a market that keeps falling. Adding a directional filter fixes most of that.
A 200-period EMA on the trading timeframe is the simplest option. Above the EMA, take only SMI signals from the oversold side. Below the EMA, take only signals from the overbought side. Alternatively, use MACD for the trend read and let the SMI handle timing — our guide to the best MACD settings explains that pairing. Candlestick confirmation helps too, and reading candlestick charts properly turns an SMI cross into an actual entry trigger with a defined stop.
Download the complete indicator database
Put these concepts on your charts. One email unlocks the full library of 1,380+ indicators with compiled MT4 and MT5 files, plus my TradingView scripts. No paywall, no spam, unsubscribe any time.
Get free access to my indicator database
One email unlocks 1,380+ free MT4, MT5 and TradingView indicators — the complete library. No single-tool download; you get the whole database.
Common stochastic momentum index mistakes
Three errors show up again and again. The first is treating ±40 as a reversal instruction. Strong trends pin the SMI in the extreme band, and fading them repeatedly drains an account. The second is stacking the SMI with the classic stochastic and RSI at once. All three measure roughly the same thing, so agreement between them is not independent confirmation. The third is over-shortening the length to remove lag. Drop below about five and the double smoothing loses its purpose, leaving you with a noisier line than the plain stochastic you were trying to improve on.
Where to go next
Momentum tools work best inside a wider toolkit. Start with our roundup of the best day trading technical indicators, then compare the SMI against the original in our stochastic settings guide. For background reading, Investopedia explains the stochastic oscillator at Investopedia, and Wikipedia documents the underlying stochastic oscillator on Wikipedia, including its history and formula.
FAQ
What is the stochastic momentum index in simple terms?
It is a momentum oscillator that plots how far the close sits above or below the midpoint of the recent high-low range. Positive values mean price closed in the upper half of that range; negative values mean the lower half.
How is the SMI different from the normal stochastic?
The classic stochastic measures the close against the lowest low and produces a 0–100 reading. The SMI measures against the range midpoint and produces a reading around zero, roughly -100 to +100. Double smoothing also makes the SMI line calmer.
What are the best stochastic momentum index settings?
Use 10/3/3 with a 3-period signal line for intraday charts, and 14/3/3 with a 5-period signal for swing trading. Shorten the length toward 5–8 for scalping, but expect more false crosses in return.
Is the SMI built into MT4 or MT5?
No. MetaTrader ships the standard Stochastic Oscillator only, so the momentum-index version needs a custom indicator file dropped into the Indicators folder. Verify its output against a known-good chart, because custom builds vary.
Does the stochastic momentum index repaint?
A correctly written SMI does not repaint. It calculates from closed highs, lows and closes, so past values stay fixed. Only the current unfinished candle updates, which every oscillator does.
Are SMI signals guaranteed to work?
No. The SMI describes momentum that has already happened; it does not predict the next move, and it stays pinned in extreme zones during strong trends. Trading involves risk, results are not guaranteed, and past performance is not indicative of future results.

About the author
Written by Dominic Walsh, a Forex trader and MT4/MT5 indicator, Expert Advisor and script developer. Every tool on forexmt4systems.com is tested on live charts before release and ships with ready-to-use compiled MT4 (.ex4) and MT5 (.ex5) files. Learn more about the trader and developer behind this site.
How we build, test and correct every tool: Editorial & Testing Policy. Trading carries risk; see the disclaimer.