
The square of nine Gann tool arranges numbers in a spiral and treats the values that line up geometrically as potential support and resistance. W.D. Gann built it in the early twentieth century, and it remains one of the most argued-over techniques in technical analysis. This guide explains how the spiral works, how traders derive levels from it, and what the evidence actually supports.
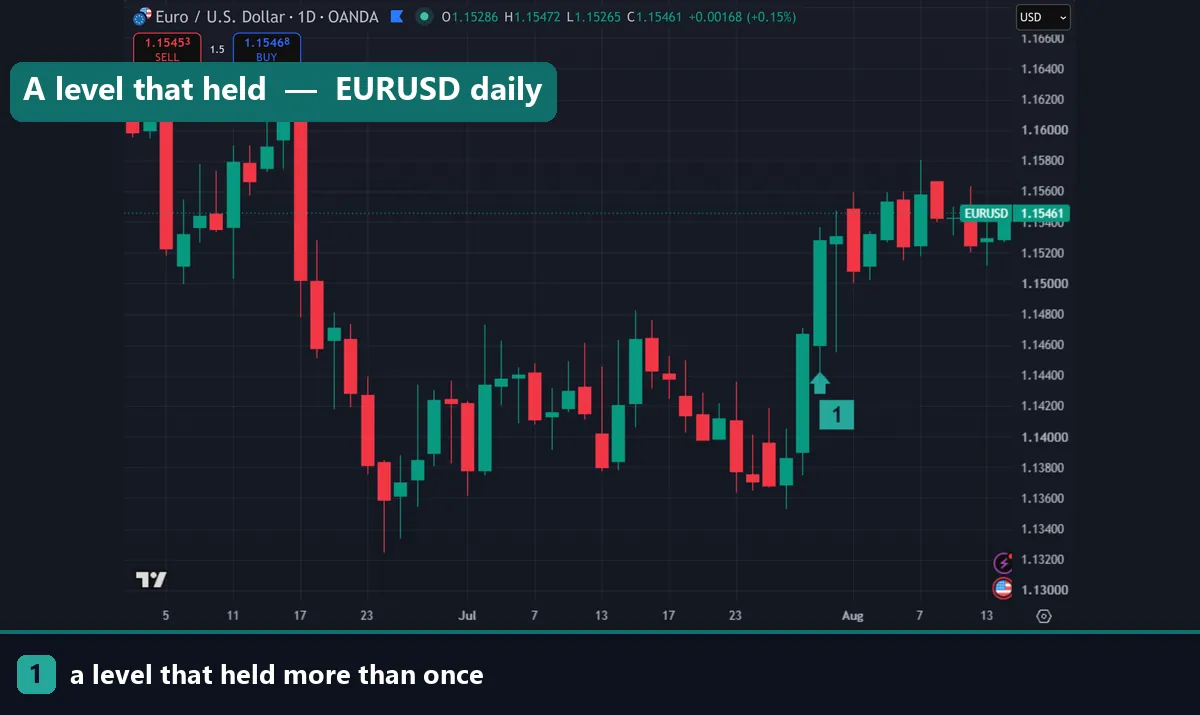
How the square of nine Gann spiral is built
Start with 1 at the centre. Place 2 to its right, then wind outwards counter-clockwise: 3 above, 4 and 5 to the left, 6 and 7 below, 8 and 9 back to the right. Nine completes the first ring, which is why the tool carries that name.
Keep going and the second ring runs from 10 to 25, the third from 26 to 49, and so on. Each complete revolution ends on an odd square: 9, 25, 49, 81, 121. Those values sit on a diagonal running out from the centre.
The structural fact behind the whole method is that one full rotation squares the number. Move 360 degrees around the spiral from any value and you arrive at a predictable relationship to it. Gann treated that geometric alignment as significant for markets.
Deriving levels from it
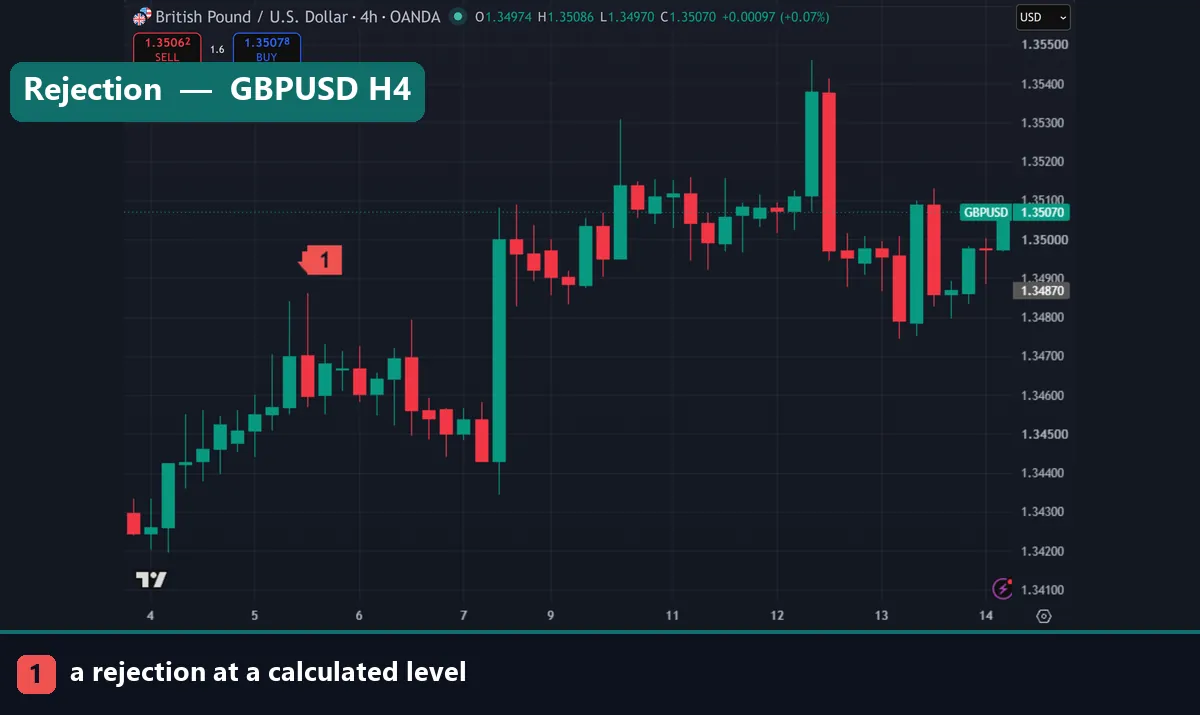
Traders use a formula rather than drawing the spiral by hand. To move a given number of degrees around the spiral from a starting price:
Level = (√start ± degrees ÷ 180)²
Work one through. Take a significant low at 1.1025. Its square root is 1.0500. To project 90 degrees, add 90 ÷ 180 = 0.5, giving 1.5500, and square it back to 2.4025. That is far from the original price, which shows the method needs scaling to the instrument.
In practice traders apply it to the meaningful digits. On EURUSD at 1.1025 you might work with 110.25, whose square root is 10.50. Add 0.5 for 90 degrees to get 11.00, square it to 121.0, and read that as 1.2100.
That scaling step is the method’s first honest weakness: you choose the scale, and different choices produce different levels from the same price.
The angles that matter
Practitioners do not treat every degree equally. Practitioners emphasise the cardinal and diagonal crosses.
| Degrees | Fraction of a rotation | Added to the square root | Emphasis |
|---|---|---|---|
| 45 | One eighth | 0.25 | Minor |
| 90 | One quarter | 0.5 | Major, the cardinal cross |
| 135 | Three eighths | 0.75 | Minor |
| 180 | One half | 1.0 | Major, direct opposition |
| 270 | Three quarters | 1.5 | Major |
| 360 | Full rotation | 2.0 | Strongest, squares the number |
The starting point matters as much as the angle. Gann practitioners anchor to a significant swing high or low rather than an arbitrary price, which means the whole calculation depends on a judgement call before any arithmetic happens.
Time as well as price
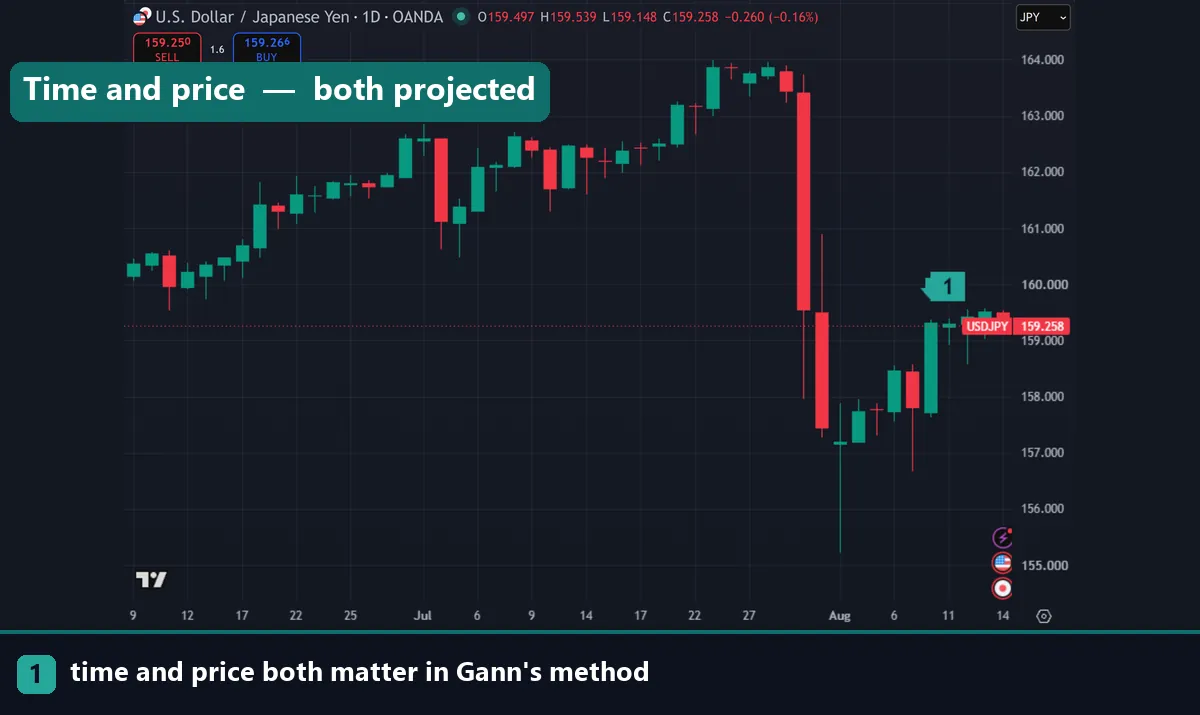
The part most summaries skip is that Gann treated time and price as the same kind of quantity. Gann used the square of nine to project dates as well as levels — count trading days from a significant turn and look for the counts that land on the same geometric angles.
A “time and price square” is where both converge: a projected price level reached on a projected date. Practitioners regard those as the strongest signals the method produces.
This is also where the method becomes hardest to test. With several possible anchors, several scalings, and both price and time projections, the number of candidate levels grows quickly, and something usually lands near any given turn.
Download the complete indicator database
Put these concepts on your charts. One email unlocks the full library of 1,380+ indicators with compiled MT4 and MT5 files, plus my TradingView scripts. No paywall, no spam, unsubscribe any time.
Get free access to my indicator database
One email unlocks 1,380+ free MT4, MT5 and TradingView indicators — the complete library. No single-tool download; you get the whole database.
An honest assessment
Three points, stated plainly.
There is no accepted mechanism. No theory explains why a price that is 90 degrees around a numerical spiral from a prior low should attract orders. Compare that with pivot points, which work partly because thousands of traders calculate the same public number, or with prior highs, where stops genuinely cluster. The square of nine has no equivalent story.
The flexibility is a problem. Choice of anchor, choice of scale, choice of angle, and price or time — that is a large space of candidate levels. When a method can produce many answers, finding one near a turn afterwards proves very little.
Nobody has verified Gann’s own record. The claims about his returns trace back to promotional material of the era, and no independent source confirms them.
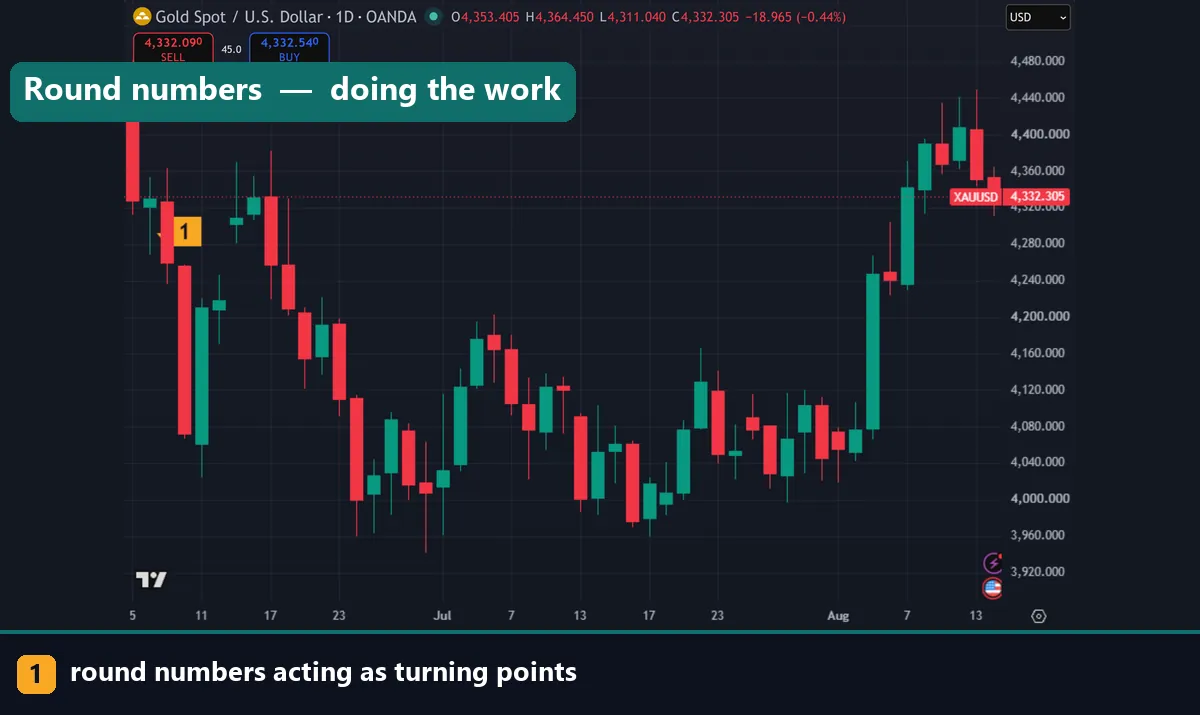
What can be said in its favour: the levels it produces often land on round numbers and prior extremes, which are areas that matter for reasons the method does not need. A trader using it may be finding real levels by an unnecessarily elaborate route.
If you want to use it anyway
Three rules keep it disciplined. Fix your anchor and scale before you calculate, and do not adjust them until a level fails. Require confluence, meaning act only where a Gann level coincides with something independent such as a prior high, a round number or a pivot. And treat the output as a zone rather than a price, with the stop placed on structure, not on the calculated figure.
Test it on your own instrument before committing. A method this flexible needs a recorded sample to distinguish genuine reaction from selective memory.
Common mistakes
Four repeat. Changing the anchor after the fact to make a level fit tops the list, and it makes the method unfalsifiable. Treating calculated levels as exact prices comes second. Third, traders use it without confluence, acting on a number nobody else is watching. Fourth, they assume the level itself carries authority, when the round numbers it often lands on are doing the work.
Where to go next
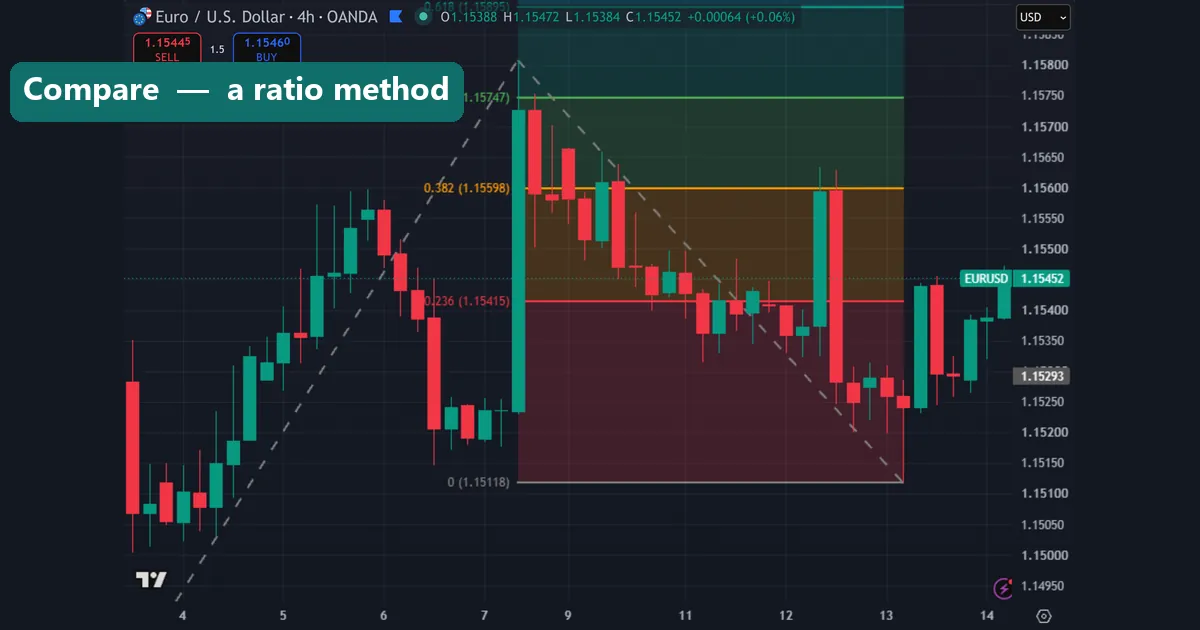
Compare it with methods that have clearer mechanisms. Read pivot calculation for levels many traders share, and how to draw a Fibonacci extension for another ratio-based approach. Our harmonic pattern trading guide covers a measured method with defined invalidation. To add a Gann indicator, follow how to install MT4 and MT5 indicators. For further reading, Investopedia explains Gann angles at Investopedia, and the W.D. Gann article on Wikipedia covers his life and the disputes about his record.
FAQ
What is the square of nine?
A spiral of numbers starting at 1 in the centre and winding outwards, where each full rotation ends on an odd square such as 9, 25 or 49. Traders read values that align geometrically as potential support and resistance.
How do I calculate a level from it?
Take the square root of your starting price, add or subtract the degrees divided by 180, then square the result. Ninety degrees means adding 0.5, and a full rotation means adding 2.
Which angles are considered strongest?
The cardinal cross at 90, 180, 270 and 360 degrees, with the full rotation regarded as strongest because it squares the starting number. Practitioners rank the 45 and 135 degree points as minor.
Does the square of nine work?
There is no accepted mechanism explaining why it should, and the method offers enough choices of anchor, scale and angle that levels can usually be found near any turn afterwards. Treat claims with scepticism.
Can it project time as well as price?
Yes. Gann applied the same geometry to counts of trading days, and practitioners look for a projected level reached on a projected date. This also multiplies the number of candidate signals.
Should I trade using Gann levels alone?
Better to require confluence with a prior high, round number or pivot that matters independently. Trading involves risk, results are not guaranteed, and past performance is not indicative of future results.

About the author
Written by Dominic Walsh, a Forex trader and MT4/MT5 indicator, Expert Advisor and script developer. Every tool on forexmt4systems.com is tested on live charts before release and ships with ready-to-use compiled MT4 (.ex4) and MT5 (.ex5) files. Learn more about the trader and developer behind this site.
How we build, test and correct every tool: Editorial & Testing Policy. Trading carries risk; see the disclaimer.