
Tick scalping is a very short-term trading style that takes small, frequent profits. Its charts are built on transaction counts rather than clock time. Instead of a bar closing every minute, a bar closes every 100, 250 or 500 ticks. So the chart speeds up when the market gets busy and slows down when it goes quiet. That single change suits scalpers, because it strips out the flat bars that clutter a time-based chart during dead hours. This guide explains what a tick chart really is and which conditions a tick scalping strategy needs. It also covers the indicators that fit, and where the approach breaks down on MT4 and MT5.
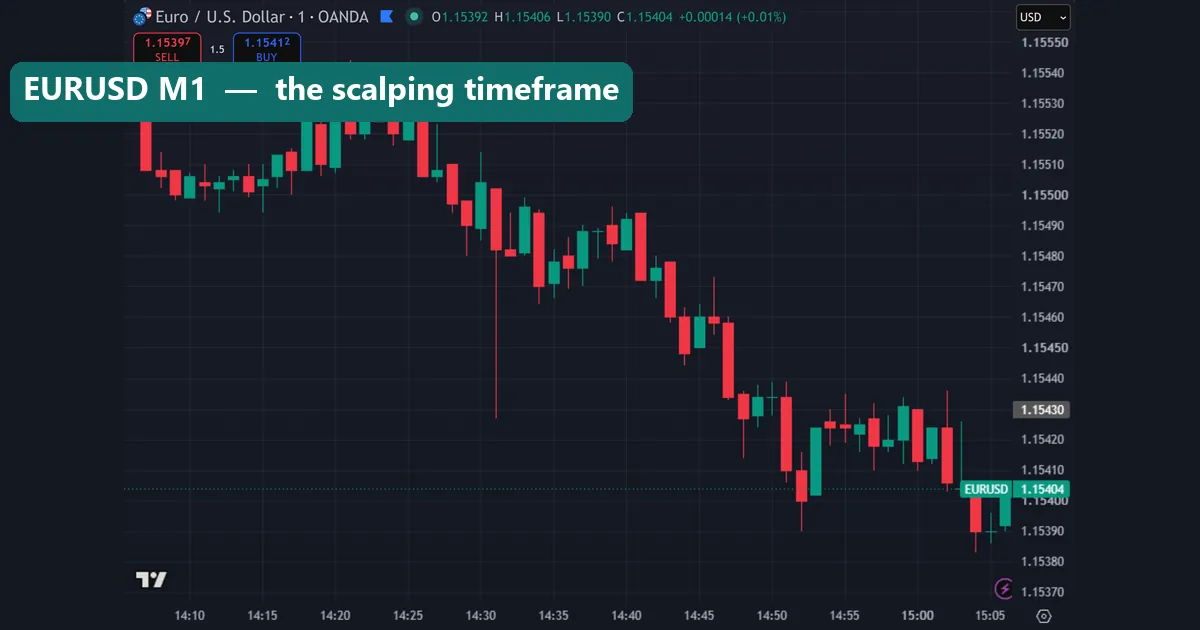
What is tick scalping?
Scalping means holding for seconds or minutes and targeting a handful of pips per trade. Tick scalping adds one specific tool: the tick chart. Traders watch bursts of activity, enter on momentum or a quick mean reversion, then exit fast.
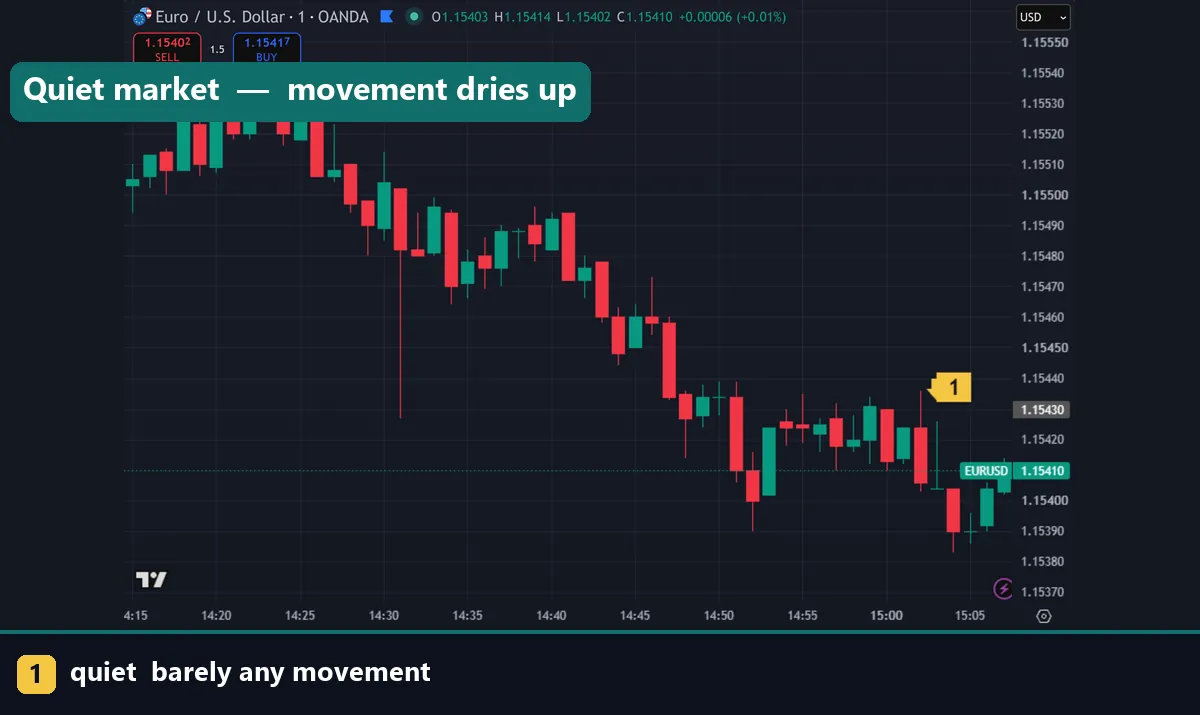
The logic is straightforward. Price does not move at a constant rate through the day. A quiet hour can print twenty near-identical one-minute candles, while a news minute contains more activity than the previous hour combined. Time-based charts flatten that difference. Tick charts do not.
Because of that, a tick scalper reads the chart as a record of participation. Bars appearing rapidly mean traders are transacting. Bars stalling mean nobody is interested, which is usually a signal to stand aside.
What a tick chart is, and how it differs from a time chart
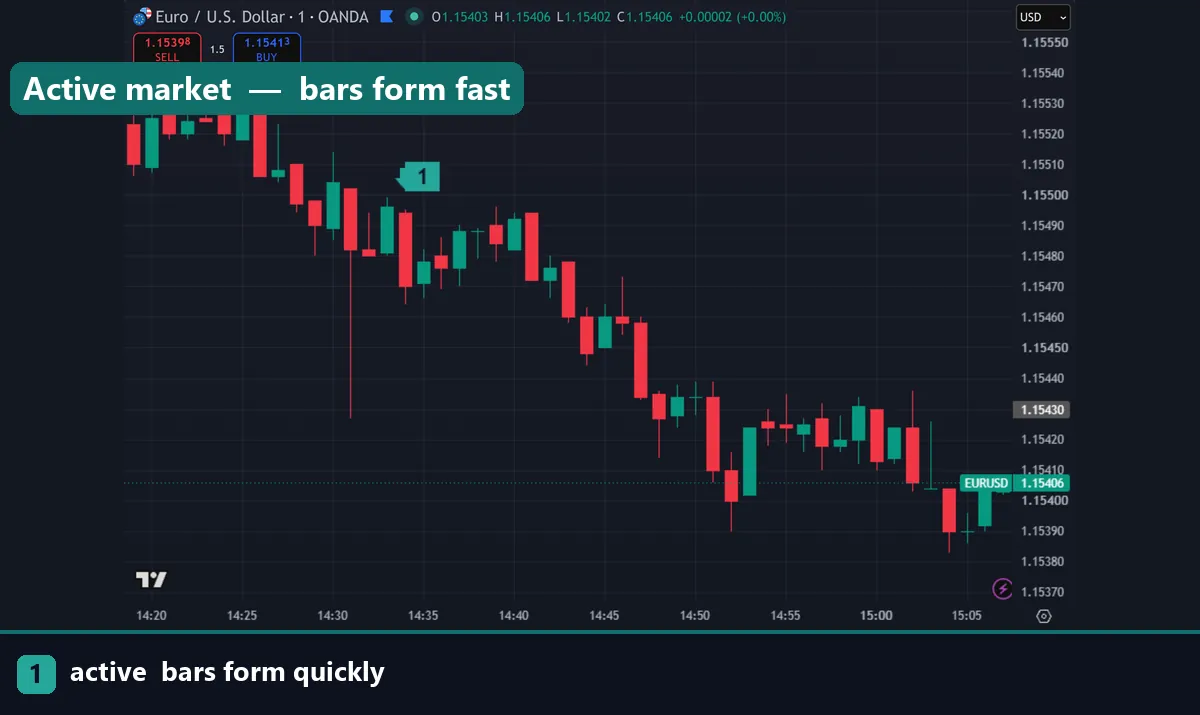
A tick chart completes a bar after a set number of transactions. On a 200-tick chart, the bar closes once 200 ticks have arrived, whether that takes four seconds or forty minutes. A one-minute chart, by contrast, closes on the clock no matter how little happened.
One detail matters in forex. There is no central exchange. So a “tick” here is a quote update from your broker’s feed, not a completed trade on an order book. Two brokers streaming different numbers of updates will therefore print different bars from the same market. That is a real weakness, and it is worth knowing before you build rules around exact bar shapes.
The practical effect is a chart that expands and contracts with activity. Session opens, data releases and the London–New York overlap generate dense clusters of bars. Overnight lulls produce almost none. Candle anatomy still reads the same way, and our guide on how to read candlestick charts applies directly to tick bars.
Tick charts vs 1-minute vs 5-minute charts
| Chart type | Bar closes when | Busy market | Quiet market | Main drawback |
|---|---|---|---|---|
| Tick (100–500) | N price updates arrive | Many bars per minute | One bar can take an hour | Broker-dependent; not native to MetaTrader |
| 1-minute | 60 seconds pass | Detail gets compressed | Rows of flat, empty bars | Noise and dead bars look identical |
| 5-minute | 300 seconds pass | Smoother, slower signals | Readable but late | Too slow for scalp-sized targets |
Neither format is better in the abstract. Tick charts give you activity-normalised bars; time charts give you consistency and easy comparison across sessions. Many scalpers run both, using a 5-minute chart for direction and a tick chart for the entry.
What a tick scalping strategy requires
Conditions matter more than the setup itself. Four requirements come first.
A tight spread. Scalp targets are small, so the spread is a large share of every trade. Raw-spread accounts with a separate commission usually cost less overall than a wide all-in spread, but you must add both together before judging any strategy.
Fast execution. You need market execution that fills at or near the quoted price. Requotes and repeated rejections make short-horizon entries unworkable.
Low latency. Distance to the broker’s server adds milliseconds. Traders who scalp seriously often run a VPS in the same data centre region as their broker, and they check slippage statistics rather than assuming.
Broker permission. Some brokers restrict scalping, apply minimum holding times, or limit orders placed close to market. Read the terms before you build a routine around them.
Indicators that suit tick chart scalping
Keep the chart sparse. At this speed, three indicators are already crowded. A fast moving-average pair gives a directional bias; a short-period momentum tool flags exhaustion; a volatility measure sizes the stop.
ATR works well for the last job, because tick-bar ranges vary wildly between calm and busy conditions. Our guide on how to use ATR as a stop loss explains the mechanics. Recalculate the multiplier on tick data, though, rather than reusing an M15 value.
Momentum oscillators need shortening too. Default periods designed for hourly bars react far too slowly here, so most tick scalpers cut the lookback and accept more signals. Our page on the best RSI indicator settings shows how period length changes sensitivity.
The honest limitation: every indicator on a tick chart is still a lagging average of past prices. Smaller bars deliver that lag sooner; they do not remove it. For a broader shortlist of fast-market tools, see our roundup of the best day trading technical indicators.
The MT4 and MT5 problem: no native tick charts
This is the part most articles skip. MetaTrader 4 and MetaTrader 5 do not offer true tick-count candle charts. Both show a simple tick line in the Market Watch window, and both offer minute charts down to M1. Neither builds a candle that closes after N ticks.
So you need a custom tool. The usual routes are a tick-chart indicator or EA that constructs bars from incoming quotes, or an offline chart generated by a script. MT5 stores real tick history, which makes reconstruction more reliable there than on MT4. Either way, the tool must be installed correctly first, and our walkthrough on how to install MT4 and MT5 indicators covers that step.
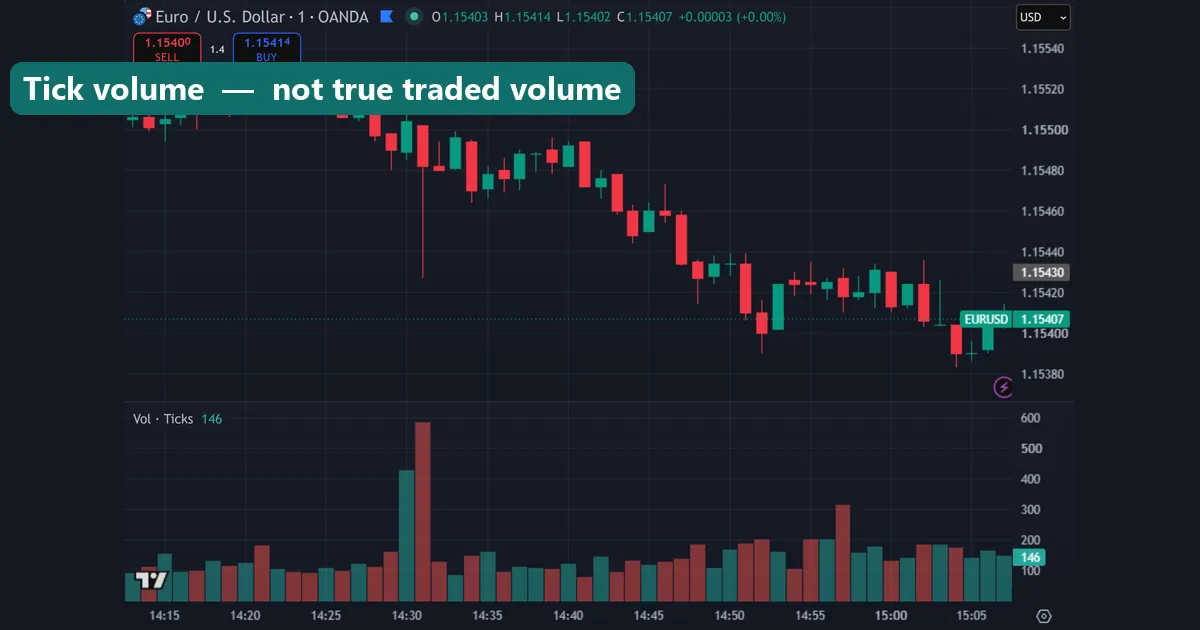
One more caveat: the “Volume” figure on a MetaTrader forex chart is tick volume, meaning the count of price updates in that bar. It is not traded contracts or lots. Tick volume correlates loosely with real activity, yet it varies by broker, so treat it as a rough activity gauge only.
Download the complete indicator database
Put these concepts on your charts. One email unlocks the full library of 1,380+ indicators with compiled MT4 and MT5 files, plus my TradingView scripts. No paywall, no spam, unsubscribe any time.
Get free access to my indicator database
One email unlocks 1,380+ free MT4, MT5 and TradingView indicators — the complete library. No single-tool download; you get the whole database.
The honest limitations of tick scalping
Costs dominate the arithmetic at this scale. When a target is a few pips wide, the round-trip spread plus commission can consume a meaningful slice of every winner, while losers still pay it in full. Raise the frequency and you multiply that drag.
Slippage compounds the problem. Fast markets fill at worse prices exactly when your edge looks strongest, and the difference rarely shows up in a backtest.
Testing is genuinely hard as well. The MT4 Strategy Tester does not reproduce tick-count bars, and any test worth trusting needs real tick data plus realistic cost modelling. Results generated on M1 bars will not transfer.
Finally, the style demands constant attention. Tick scalping produces many decisions per hour, and fatigue degrades execution long before the strategy itself fails.
Common tick scalping mistakes
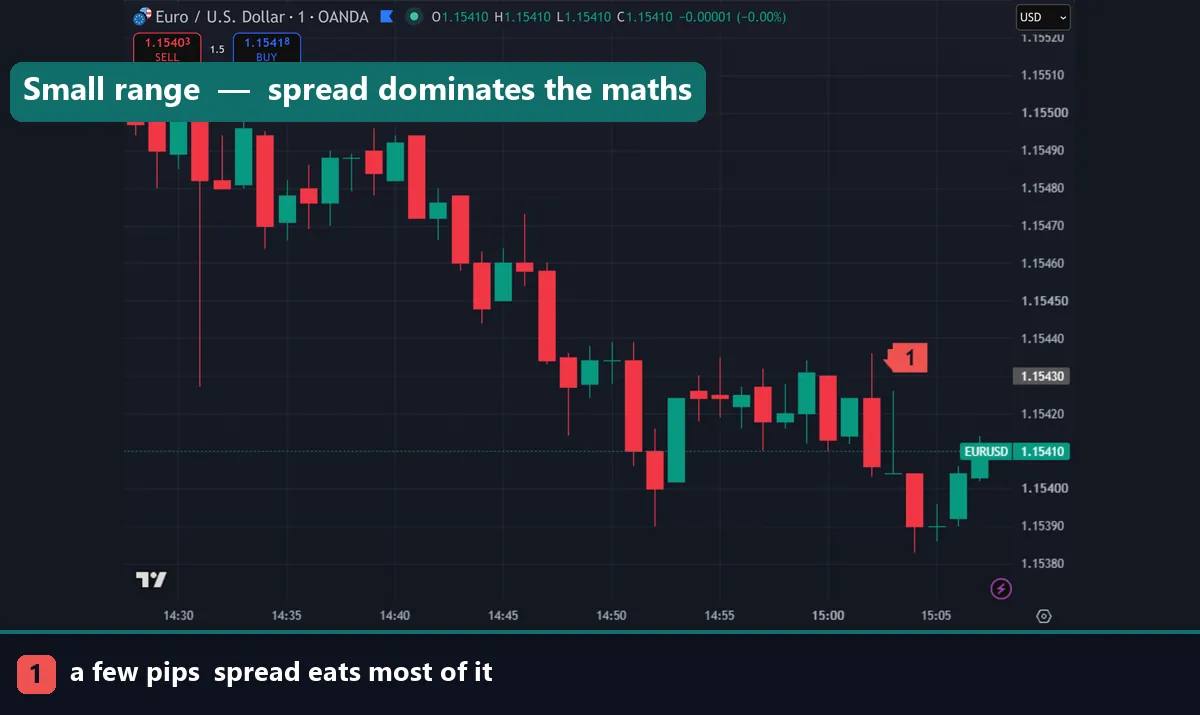
Four mistakes account for most failures. The first is choosing a tick count that is far too small, which turns the chart into pure noise and produces constant false signals. Second comes ignoring spread behaviour around news and session changes, when costs widen precisely as the chart looks most active. Third, over-leveraging because the stop is only a few pips away — small stops invite oversized positions, and one gap erases a long run of small gains. Fourth, reusing one tick setting across every pair and every session, even though a quiet cross and EURUSD during the overlap generate completely different bar rates. Test each instrument separately, and set a daily loss limit before you start.
Where to go next
Build the foundations before you speed anything up. Work through our roundup of the best day trading technical indicators, then size positions with ATR-based stops. Sharpen your reading of individual bars with our guide to candlestick charts. For outside definitions, Investopedia explains scalping at Investopedia, and Wikipedia covers the history of scalping as a trading style on Wikipedia.
FAQ
What is tick scalping in forex?
It is scalping executed on tick charts, where each bar closes after a fixed number of price updates instead of a fixed number of minutes. Traders enter during bursts of activity and exit within seconds or minutes.
What tick setting should I use?
Start around 100 to 500 ticks and adjust per instrument. Choose a count that produces roughly one bar every few seconds during your trading session, then check it again when volatility changes.
Do MT4 and MT5 have tick charts?
Not as candle charts. Both display a tick line in Market Watch and minute charts from M1 upward. Building N-tick bars therefore requires a custom indicator, an EA, or an offline chart script.
Is tick volume the same as real volume?
No. Tick volume counts price updates from your broker’s feed, not traded contracts. Forex has no central exchange, so figures differ between brokers and should be read as an activity estimate.
Is tick scalping better than 1-minute scalping?
It is different, not better. Tick charts remove dead bars and react faster, while 1-minute charts stay consistent and are far easier to test. Many traders combine the two.
Can tick scalping guarantee consistent profits?
No. Costs, slippage and execution quality shape the outcome as much as the chart does, and no method removes uncertainty. Trading involves risk, results are not guaranteed, and past performance is not indicative of future results.

About the author
Written by Dominic Walsh, a Forex trader and MT4/MT5 indicator, Expert Advisor and script developer. Every tool on forexmt4systems.com is tested on live charts before release and ships with ready-to-use compiled MT4 (.ex4) and MT5 (.ex5) files. Learn more about the trader and developer behind this site.
How we build, test and correct every tool: Editorial & Testing Policy. Trading carries risk; see the disclaimer.