
The Tom DeMark sequential indicator counts bars rather than smoothing prices, which makes it unusual among technical tools. It looks for a run of closes pointing one way and flags the point at which that run has gone on long enough to be worth fading. This guide covers how the count works, what the numbers on the chart mean, and where the method holds up against its own logic.

How the count works
The indicator runs in two stages, and they do different jobs.
Setup is the first stage. A bearish setup needs nine consecutive bars whose close is higher than the close four bars earlier. A bullish setup needs nine consecutive bars closing lower than the close four bars back.
Any bar that breaks the condition resets the count to zero. That strictness is the point: a completed nine means the market has pushed in one direction without a single interruption.
Countdown follows a completed setup and runs to thirteen. It uses a looser rule — the close compared against the high or low two bars earlier — and the bars do not need to be consecutive.
A completed thirteen is the exhaustion signal proper. The nine is the earlier warning.
Reading the Tom DeMark sequential indicator on a chart

Most implementations print numbers above or below the bars, which is all the output there is.
| What you see | Stage | What it means |
|---|---|---|
| 1 through 8 | Setup in progress | A run is building, nothing actionable |
| 9 | Setup complete | First exhaustion warning |
| 1 through 12 | Countdown | The move is extending |
| 13 | Countdown complete | The main exhaustion signal |
Numbers above the bars count a rising sequence and point toward a possible top. Numbers below count a falling sequence and point toward a possible bottom.
Colour usually marks direction rather than adding information. Read the stage and the number, and ignore the styling.
Two extras appear in fuller implementations. A TDST line marks the level a completed setup has to break for the signal to be dropped, and a perfected setup adds a condition on bars 8 and 9 relative to bars 6 and 7.
What the method is claiming

The underlying idea is straightforward. A trend that has run without interruption for nine or thirteen bars has drawn in most of the participants who were going to join it, and the marginal buyer eventually runs out.
DeMark’s contribution was making the count mechanical. No judgement about what counts as extended, no drawing, no discretion about whether a run “looks” tired. The bars either satisfy the condition or they do not.
That objectivity is the genuine strength here. Two traders looking at the same chart get the same numbers, which is more than can be said for most pattern-based methods.
The weakness lives in the same place. Bar counts have no view on the size of the move, the timeframe’s context, or whether a central bank meets tomorrow.
Where it fails
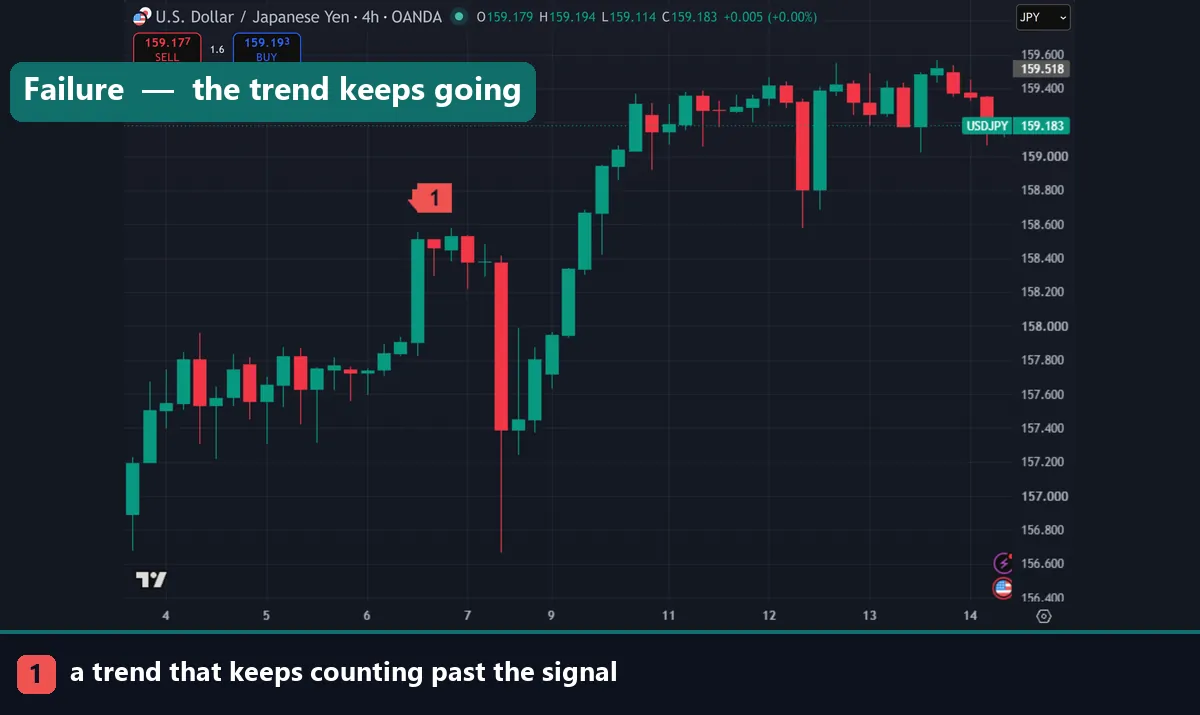
Three failure modes account for most losing trades on this tool.
Strong trends keep counting. A market in a genuine trend completes a nine, pauses briefly, and starts a fresh count. Traders fading each signal in sequence lose repeatedly while the trend continues, which is the classic way to lose money with any exhaustion tool.
Our entry and exit indicators guide covers pairing a counter-trend signal with a trend filter.
The signal has no stop attached. A thirteen tells you a count completed. It does not tell you where you are wrong, so the stop has to come from structure — the extreme of the setup, or the TDST line.
Implementations differ. The full method includes conditions many free versions omit, so the same chart in two platforms can print different numbers. Check what your version implements before trusting it.
Download the complete indicator database
Put these concepts on your charts. One email unlocks the full library of 1,380+ indicators with compiled MT4 and MT5 files, plus my TradingView scripts. No paywall, no spam, unsubscribe any time.
Get free access to my indicator database
One email unlocks 1,380+ free MT4, MT5 and TradingView indicators — the complete library. No single-tool download; you get the whole database.
Using it sensibly
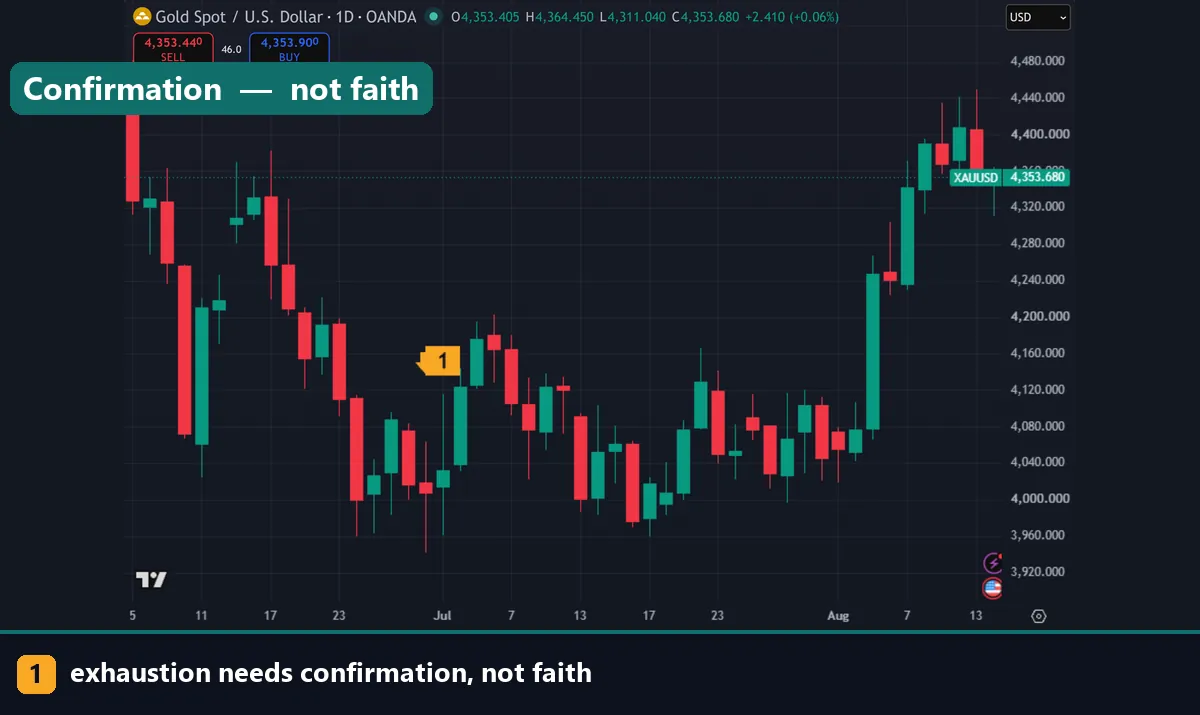
Four rules make the tool workable.
Use it as a warning, not a trigger. A completed count says a move may be tiring. Wait for price to confirm — a close back through the prior bar’s range, or a break of short-term structure.
Trade with the higher timeframe. A bullish thirteen on the four-hour inside a daily uptrend is a pullback ending. The same signal against a strong daily downtrend is a fade of an active trend, which is a different proposition.
Prefer higher timeframes. Counts on the daily and four-hour behave better than counts on the five-minute, where noise resets the sequence constantly.
Combine with a level. A thirteen that completes at a prior swing high or a pivot has confluence behind it. Our pivot calculation guide covers the levels.
Log every signal for a quarter, including the ones you skipped, and you will learn more about whether the tool suits you than any description can tell you.
Common mistakes
Four repeat. Fading every count in a trending market tops the list, since strong trends produce repeated signals and honour none of them. Entering on the nine rather than waiting for confirmation comes second. Third, traders use the tool on very low timeframes where the count resets constantly. Fourth, they assume their platform’s version implements the full method when many free ones do not.
Where to go next
Exhaustion tools need a trend filter beside them. Read our best entry and exit indicators guide for pairing, then pivot calculation for the levels that add confluence. For a different take on exhaustion, see the RSI divergences cheat sheet, and reversal indicators for MT4 covers related tools. For further reading, Investopedia covers the DeMarker indicator at Investopedia, DeMark’s other widely used tool, and the technical analysis article on Wikipedia covers the evidence around such methods.
FAQ
What is the Tom DeMark sequential indicator?
A bar-counting tool that flags exhaustion. Setup counts nine consecutive closes above or below the close four bars earlier, and countdown then runs to thirteen under a looser condition.
What do the 9 and 13 mean?
Nine marks a completed setup, the first warning that a run has extended. Thirteen marks a completed countdown and is the main exhaustion signal.
Should I trade the 9 or the 13?
Neither on its own. Treat both as a warning and wait for price confirmation, such as a close back through the previous bar’s range or a break of short-term structure.
Which timeframe works best?
Daily and four-hour charts. On very low timeframes the strict setup condition resets constantly and the counts carry little meaning.
Why does the indicator fail in trends?
Because a strong trend completes a count, pauses, and starts another. Fading each one in sequence produces repeated losses while the trend continues.
Are all versions of the indicator the same?
No. Many free implementations omit conditions from the full method, so numbers can differ between platforms. Trading involves risk, results are not guaranteed, and past performance is not indicative of future results.

About the author
Written by Dominic Walsh, a Forex trader and MT4/MT5 indicator, Expert Advisor and script developer. Every tool on forexmt4systems.com is tested on live charts before release and ships with ready-to-use compiled MT4 (.ex4) and MT5 (.ex5) files. Learn more about the trader and developer behind this site.
How we build, test and correct every tool: Editorial & Testing Policy. Trading carries risk; see the disclaimer.