
The 3D in the name means three dimensions of momentum, not a visual effect. The 3d oscillator indicator normalises three separate readings onto one 0 to 100 scale, then averages them into a single line. Range position. Relative momentum. And a rate of change divided by ATR. Each answers a different question. The blend gives you one number.
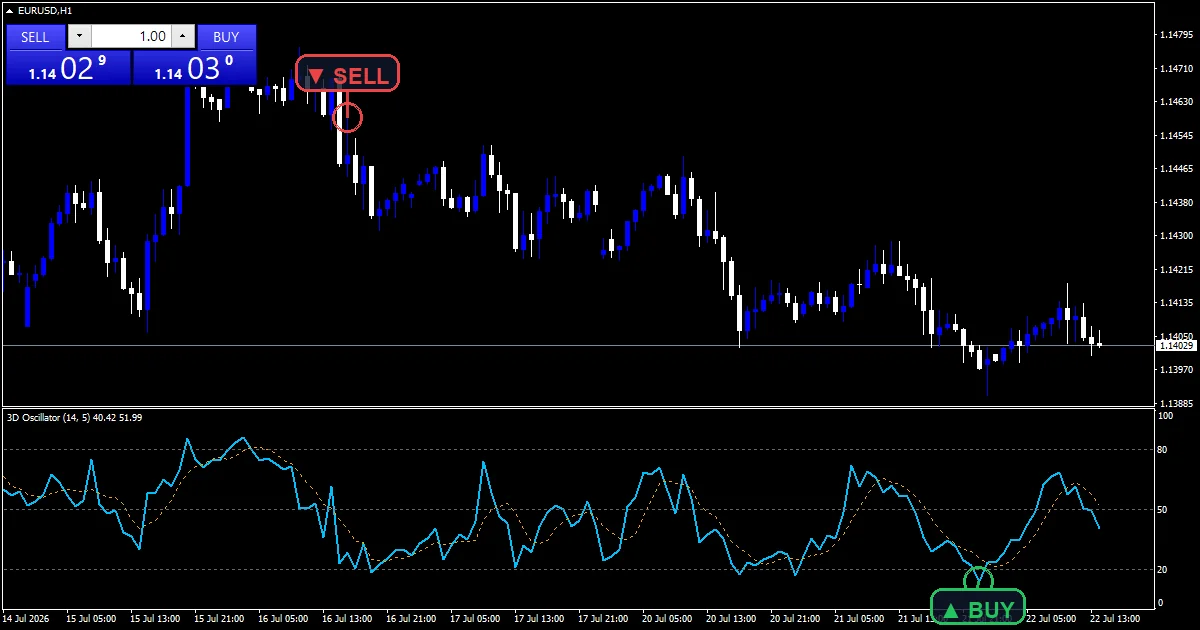
This build ships as a compiled .ex4 for MT4 and .ex5 for MT5; the screenshots below come from EURUSD H1.
| Platforms | MT4 (.ex4) + MT5 (.ex5) |
|---|---|
| Chart window | Separate window (levels 20 / 50 / 80) |
| Plots | 2: 3D Oscillator, Signal |
| Alerts | popup, push notification, email, sound |
| Inputs | 15 |
What lands on your chart
3D Oscillator is the composite line in a separate pane, scaled 0 to 100.
Signal is the slower line, a simple moving average of the composite.
Reference levels sit at 20, 50 and 80, set through level directives rather than constant buffers.
Nothing is drawn on the price chart itself.
- 3D Oscillator: line, width 2
- Signal: line, width 1
How it all fits together
Dimension one and two
d1 takes the raw stochastic %K over `InpPeriod`, which answers where the close sits inside the recent high-low range. d2 takes RSI over the same period, clamped to the 0 to 100 band. Both already live on that scale, so neither needs converting.
Dimension three, scaled by volatility
z takes (close[i] – close[i + InpPeriod]) divided by atr. That turns a raw price distance into a number of average ranges, which is what makes it comparable across symbols. d3 then maps it onto the same scale: 50.0 times (1.0 + z / RocAtrScale), clamped. `RocAtrScale` at `4.0` sets how many ATR multiples reach the 0 and 100 edges.
Blending and smoothing
Osc[i] takes the weighted average. WeightRange times d1, plus WeightRsi times d2, plus WeightRoc times d3, all over the weight sum. With all three at `1.0` it is a plain average. Sig[i] then takes a simple moving average of that over `SignalPeriod`. The alert watches for the two crossing on the last closed bar.
What you are looking at
One line summarising three readings, so a mid-range value can hide two dimensions disagreeing.
The signal line crossing is the event the alerts watch.
Levels at 20 and 80 come from level directives, which keeps the pane’s auto-scale intact.
Setting a weight to zero removes that dimension entirely, which is the quickest way to see what each contributes.
Alert channels in this build: popup, push notification, email and sound, one message per closed bar.
Four channels sit beneath `EnableAlerts`: popup, push notification, email and sound, with `SoundFile` naming the clip. Popup ships enabled. The header states alerts fire on the oscillator and signal crossing, on the last closed bar only, and the guard permits one message per bar.
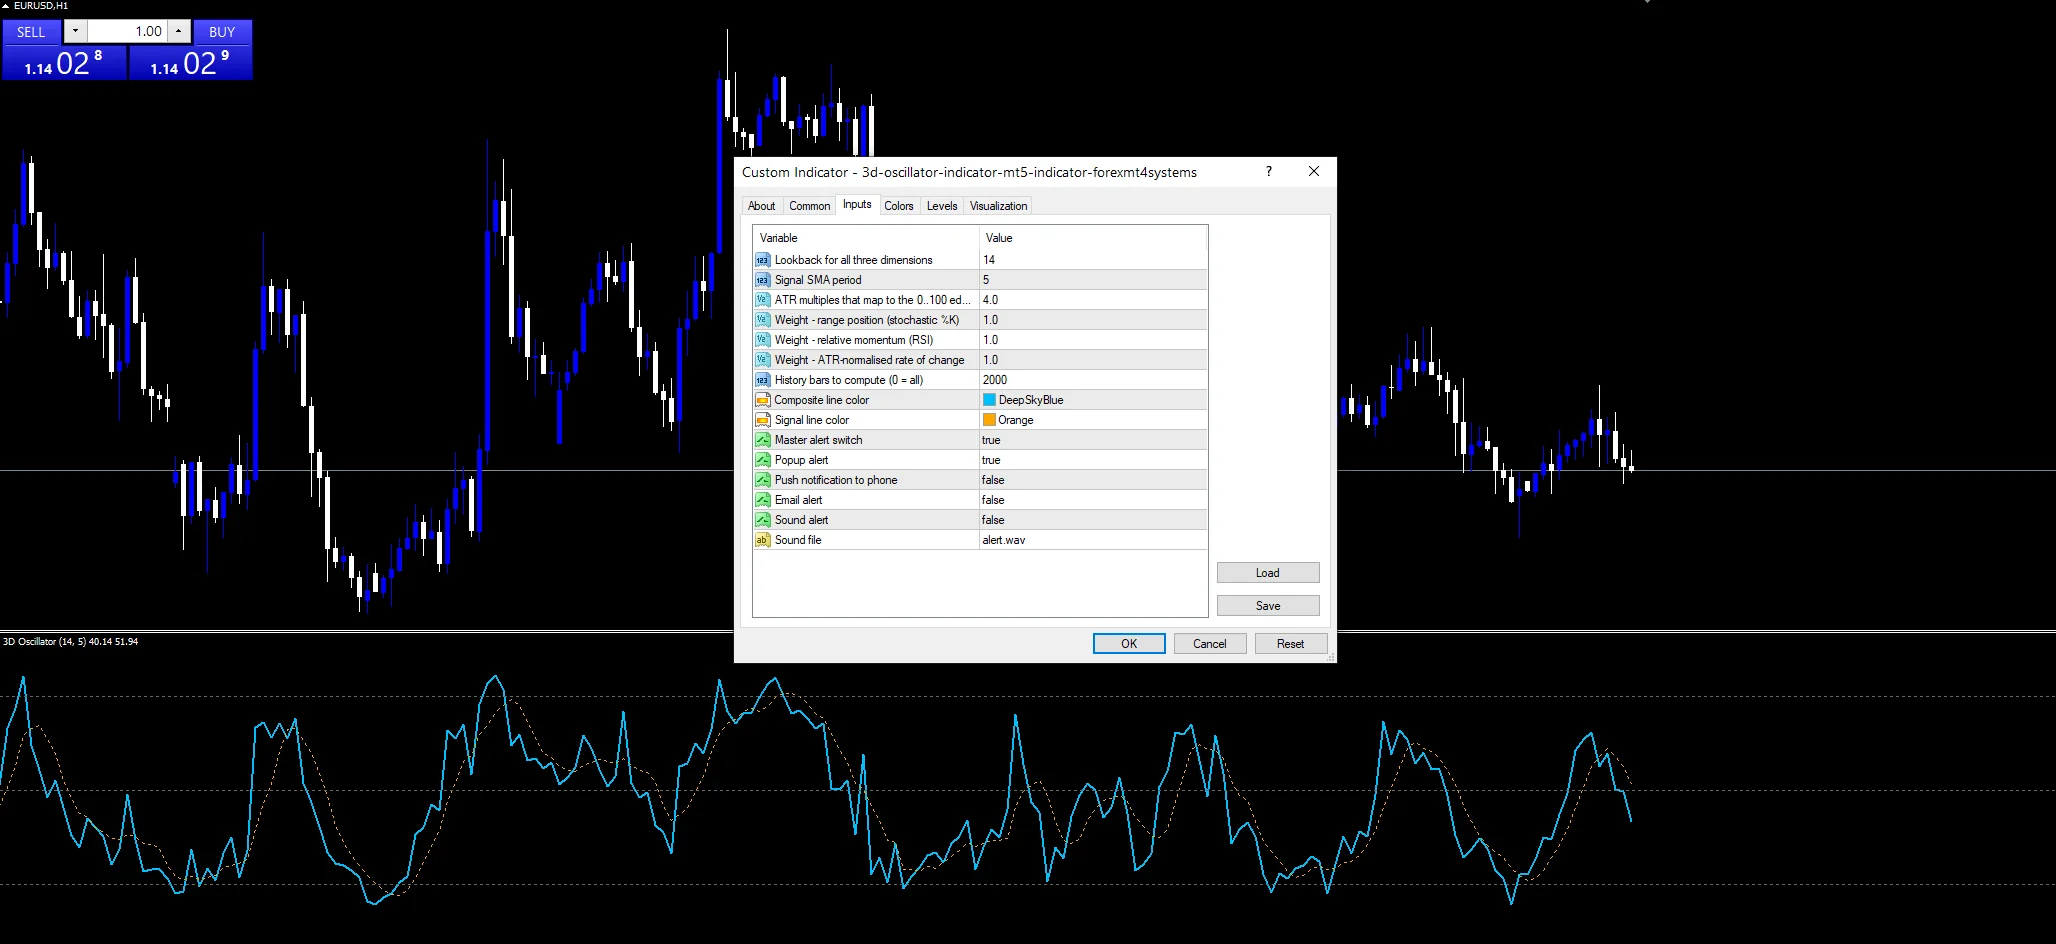
Every 3D Oscillator Indicator input
Core settings
| Setting | What it does | Default |
|---|---|---|
InpPeriod |
Lookback for all three dimensions. Lookback shared by all three dimensions, default `14`. | 14 |
SignalPeriod |
Signal SMA period. Simple moving average length for the signal line, default `5`. | 5 |
RocAtrScale |
ATR multiples that map to the 0..100 edges. How many ATR multiples map to the 0 and 100 edges, default `4.0`. Lower it and the third dimension saturates sooner. | 4.0 |
WeightRange |
Weight – range position (stochastic %K). Weight on the stochastic dimension, default `1.0`, with `WeightRsi` and `WeightRoc` matching it. | 1.0 |
WeightRsi |
Weight – relative momentum (RSI). | 1.0 |
WeightRoc |
Weight – ATR-normalised rate of change. | 1.0 |
Display settings
| Setting | What it does | Default |
|---|---|---|
OscColor |
Composite line color. | deep sky blue |
SignalColor |
Signal line color. | orange |
Alert settings
| Setting | What it does | Default |
|---|---|---|
MaxBars |
History bars to compute (0 = all). History bars computed, default `2000`. | 2000 |
EnableAlerts |
Master alert switch. | on |
EnablePopup |
Popup alert. | on |
EnablePushNotify |
Push notification to phone. | off |
EnableEmail |
Email alert. | off |
EnableSound |
Sound alert. | off |
SoundFile |
Sound file. | alert.wav |
Which markets and timeframes suit it
Because the third dimension divides by ATR, the composite reads the same way across symbols and timeframes. EURUSD H1 is the reference chart. The blend suits instruments that oscillate, since two of the three dimensions are bounded oscillators by nature. On very fast charts all three become noisy together, which the averaging does not fix.
The downsides
Averaging three readings hides disagreement. A composite at 50 can mean all three are neutral, or that two are extreme and cancelling.
Two of the three dimensions come from the same price series over the same window. They are far from independent.
The signal line is a simple average of the composite. That adds a second layer of lag on top of three lagging inputs.
Copy the compiled 3D Oscillator Indicator file into your MQL4/Indicators folder, and the MT5 build into MQL5/Indicators, then restart the terminal and drag it onto a chart. The step-by-step guide with screenshots is at how to install MT4 and MT5 indicators.
Download the 3D Oscillator Indicator for MT4 and MT5
The zip holds the compiled 3D Oscillator Indicator build for MT4 and MT5, plus a short README. Compiled files only, no source. Enter your email below and the download link arrives in your inbox.
Download this indicator free
Enter your email and the file is yours. You also get the full MT4 and MT5 library.
FAQ
What does InpPeriod feed the three dimensions?
Range position, taken as the raw stochastic %K over `InpPeriod`. Relative momentum, taken as RSI over the same period. And a rate of change divided by ATR. Each is normalised to 0 to 100 before blending, so no single dimension can dominate through scale alone.
Why does RocAtrScale divide the change by ATR?
Because a raw price distance means nothing on its own. Forty points is a large move on EURUSD and a small one on gold. Dividing by ATR expresses the change in average ranges instead, so the third dimension reads the same way whatever symbol or timeframe you attach it to.
What does RocAtrScale control?
How far the third dimension has to move to reach the edges of the scale. At `4.0` a change of four ATRs maps to 0 or 100. Lowering it means d3 saturates sooner and spends more time pinned. Raising it keeps the reading nearer the middle and reduces that dimension’s influence on the blend.
Can WeightRange or WeightRoc turn a dimension off?
Yes, set its weight to zero. `WeightRange`, `WeightRsi` and `WeightRoc` all default to `1.0`, and the code divides by their sum, so zeroing one removes it cleanly without unbalancing the scale. That is also the quickest way to see what each dimension was contributing.
Are results guaranteed?
No. Trading involves risk. Results are not guaranteed; past performance is not indicative of future results. Use the 3D Oscillator Indicator as one input. Always backtest before trading live.
Authoritative references
- Learn more about technical indicators.

About the author
Written by Dominic Walsh, a Forex trader and MT4/MT5 indicator, Expert Advisor and script developer. Every tool on forexmt4systems.com is tested on live charts before release and ships with ready-to-use compiled MT4 (.ex4) and MT5 (.ex5) files. Learn more about the trader and developer behind this site.
How we build, test and correct every tool: Editorial & Testing Policy. Trading carries risk; see the disclaimer.