
Three numbers name it and the middle one does most of the work. The 5 34 5 oscillator indicator subtracts a 34-bar median-price average from a 5-bar one, smooths that spread over five bars, and draws the distance between the two as a histogram coloured by direction.
This build ships as a compiled .ex4 for MT4 and .ex5 for MT5; the screenshots below come from EURUSD H1.
| Platforms | MT4 (.ex4) + MT5 (.ex5) |
|---|---|
| Chart window | Separate window (levels 0) |
| Plots | 3: 5/34/5 histogram rising, 5/34/5 histogram falling, 5/34/5 signal line |
| Alerts | popup, push notification, email, sound |
| Inputs | 14 |
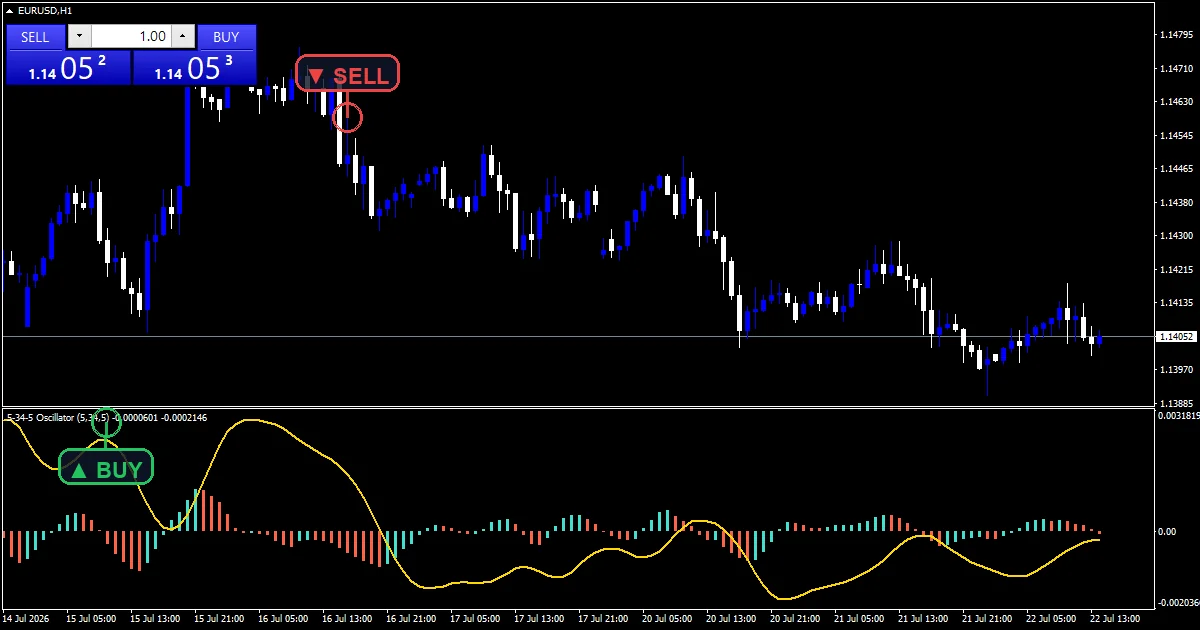
Everything visible
Three plots, in a pane below price.
`5/34/5 histogram rising` fills turquoise at width 2.
`5/34/5 histogram falling` fills tomato beside it.
`5/34/5 signal line` traces gold across the pane.
A reference sits at zero.
Nothing appears on the candles themselves.
- 5/34/5 histogram rising: histogram, width 2
- 5/34/5 histogram falling: histogram, width 2
- 5/34/5 signal line: line, width 2
What the code actually computes
Median price, not close
`FastPeriod` `5` and `SlowPeriod` `34` both average the midpoint between each bar’s high and low. That choice makes the spread respond to a bar’s whole range rather than where it happened to finish.
Smoothing the spread
`SignalPeriod` `5` averages the spread itself, not price. The gold line is that average, and the histogram is how far the raw spread sits from it on each bar.
Colour and scale
Each column meets the one before it. Growing fills turquoise, shrinking fills tomato, and `DisplayScale` `1.0` leaves the values unmultiplied.
How to judge the output
Column height is the gap between spread and signal.
Colour reports direction, not which side of zero.
Above zero the fast average leads the slow one.
The gold line crossing zero is a separate event.
`MaxBars` `1500` limits how far back it draws.
Warm-up needs about forty bars.
Alert channels in this build: popup, push notification, email and sound, one message per closed bar.
The histogram changing direction is what reports. `EnableAlerts` is the master switch over it and `EnablePopup` already carries it in a terminal box. Mobile, mail and the desktop clip named by `SoundFile` all start off, one message per closed bar.
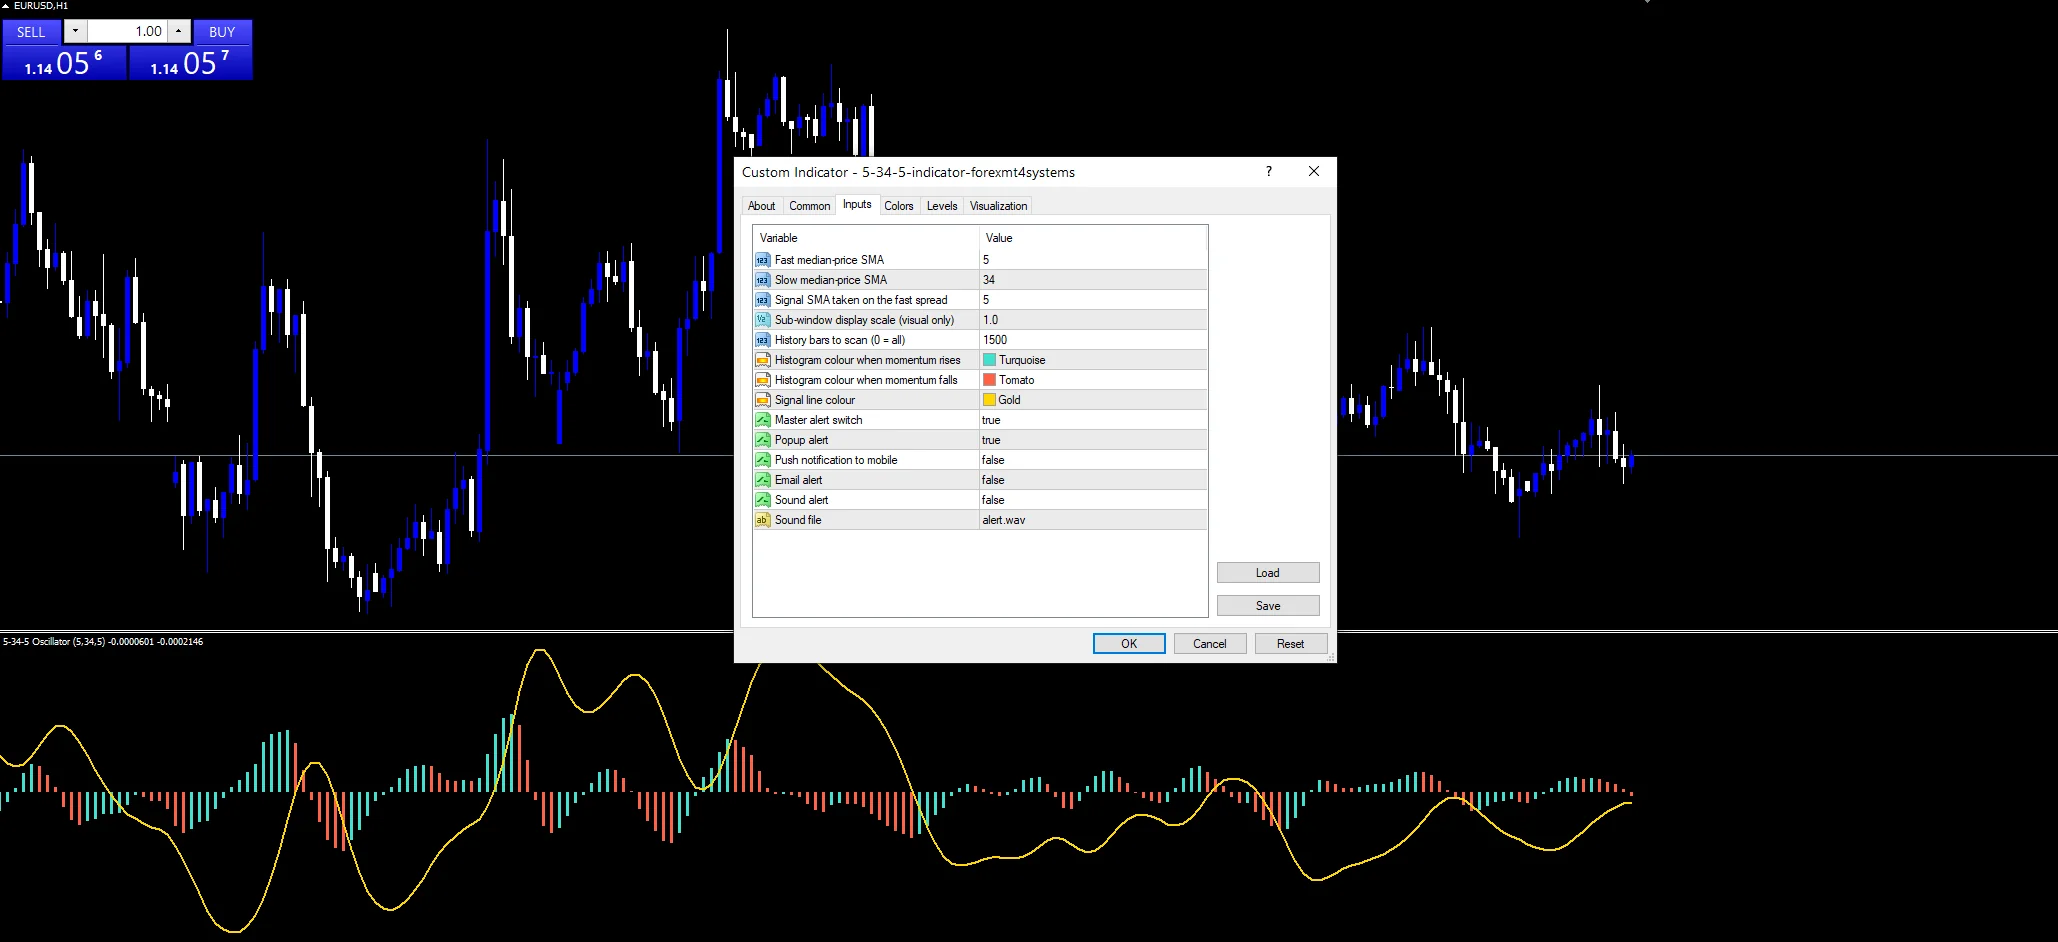
Every 5 34 5 Oscillator Indicator input
Core settings
| Setting | What it does | Default |
|---|---|---|
FastPeriod |
Fast median-price SMA. Quicker median-price average, `5`. | 5 |
SlowPeriod |
Slow median-price SMA. Slower one, `34`. | 34 |
SignalPeriod |
Signal SMA taken on the fast spread. Average laid over the spread, `5`. | 5 |
Display settings
| Setting | What it does | Default |
|---|---|---|
DisplayScale |
Sub-window display scale (visual only). Multiplier applied for readability, `1.0`. | 1.0 |
RisingColor |
Histogram colour when momentum rises. | turquoise |
FallingColor |
Histogram colour when momentum falls. | tomato |
SignalColor |
Signal line colour. | gold |
Alert settings
| Setting | What it does | Default |
|---|---|---|
MaxBars |
History bars to scan (0 = all). History drawn, `1500`. | 1500 |
EnableAlerts |
Master alert switch. Master switch over the histogram message, `true`. | on |
EnablePopup |
Popup alert. A terminal box carries it, `true`. | on |
EnablePushNotify |
Push notification to mobile. A mobile device gets it too, `false`. | off |
EnableEmail |
Email alert. Mail carries it out, `false`. | off |
EnableSound |
Sound alert. | off |
SoundFile |
Sound file. Which clip, `”alert.wav”`. | alert.wav |
Which timeframe to use
Thirty-four bars of median price wants a chart with real swings in it. EURUSD H1 is the reference chart and gives a colour change most days. On M5 the columns alternate constantly. On D1 one colour run can cover a whole month of trade.
The trade-offs
A histogram of a spread lags twice over.
Colour flips on the smallest change in height.
Leaving the scale at one keeps the pane values tiny.
Zero crossings and colour changes rarely agree.
Copy the compiled 5 34 5 Oscillator Indicator file into your MQL4/Indicators folder, and the MT5 build into MQL5/Indicators, then restart the terminal and drag it onto a chart. The step-by-step guide with screenshots is at how to install MT4 and MT5 indicators.
Background reading on the method behind the 5 34 5 Oscillator Indicator: Awesome Oscillator at BabyPips, Momentum (technical analysis) on Wikipedia.
Download the 5 34 5 Oscillator Indicator for MT4 and MT5
The zip holds the compiled 5 34 5 Oscillator Indicator build for MT4 and MT5, plus a short README. Compiled files only, no source. Enter your email below and the download link arrives in your inbox.
Download this indicator free
Enter your email and the file is yours. You also get the full MT4 and MT5 library.
FAQ
Why do FastPeriod and SlowPeriod use median price?
Because the midpoint between high and low describes the bar as a whole. A close-based average ignores a long wick entirely, and this family grew up around where trade actually happened rather than where it stopped.
What is the 5/34/5 signal line averaging?
The spread between the two median-price averages, not price itself. That is why the histogram measures a gap between two derived series rather than between price and an average of it.
Why does DisplayScale default to 1.0 here?
It leaves the values untouched. The spread on a currency pair is small, so you may want to raise this purely to make the pane readable; it changes nothing in the calculation or the colouring.
When does the histogram switch to tomato?
On any bar where the column is shorter than the one before it. The comparison is against height alone, so a tomato column can still sit well above zero while the spread remains positive.
Are results guaranteed?
No. Trading involves risk. Results are not guaranteed; past performance is not indicative of future results. Use the 5 34 5 Oscillator Indicator as one input. Always backtest before trading live.
Authoritative references
- Learn more about technical indicators.

About the author
Written by Dominic Walsh, a Forex trader and MT4/MT5 indicator, Expert Advisor and script developer. Every tool on forexmt4systems.com is tested on live charts before release and ships with ready-to-use compiled MT4 (.ex4) and MT5 (.ex5) files. Learn more about the trader and developer behind this site.
How we build, test and correct every tool: Editorial & Testing Policy. Trading carries risk; see the disclaimer.