
The alfa trend indicator is a Gann HiLo Activator. It keeps two averages running, one of the recent highs and one of the recent lows, and shows you whichever one price is not currently breaking. Alfa Trend Up and Alfa Trend Down colour the line, with arrows at each flip.
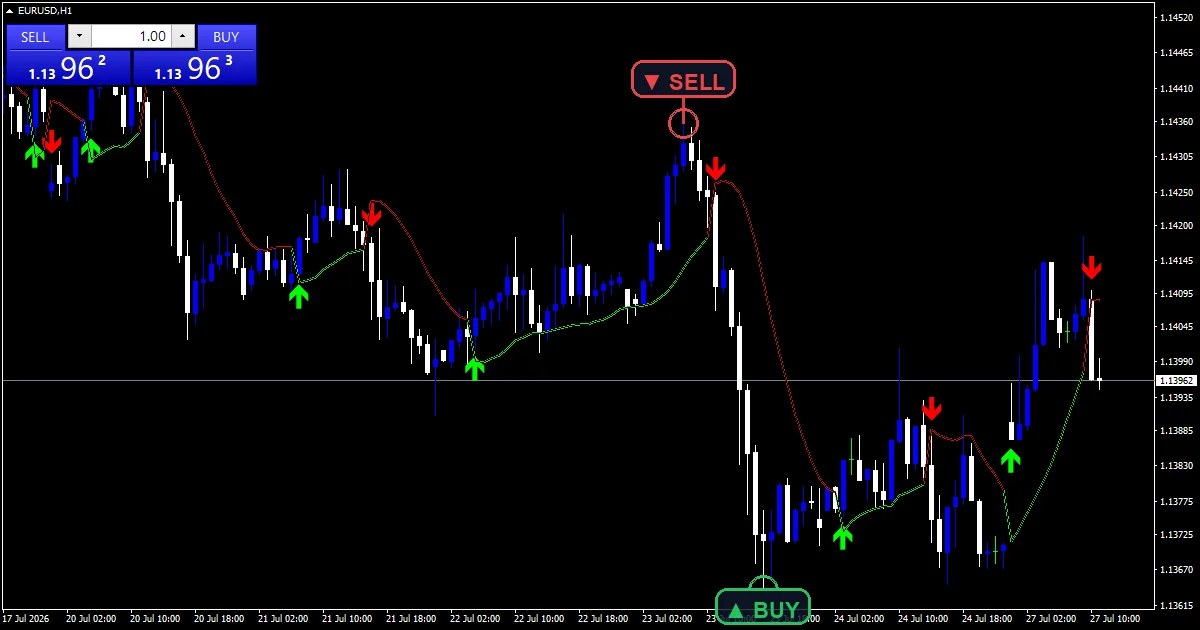
This build ships as a compiled .ex4 for MT4 and .ex5 for MT5; the screenshots below come from EURUSD H1.
| Platforms | MT4 (.ex4) + MT5 (.ex5) |
|---|---|
| Chart window | Main price chart |
| Plots | 4: Alfa Trend Up, Alfa Trend Down, Buy, Sell |
| Alerts | popup, push notification, email, sound |
| Inputs | 8 |
On the chart: plots and colours
Alfa Trend Up carries the line while the regime reads up, tracking the average of the lows.
Alfa Trend Down takes over in the down regime, tracking the average of the highs.
Buy marks the bar where the regime flips up.
Sell marks the flip the other way.
- Alfa Trend Up: line, lime, width 2
- Alfa Trend Down: line, red, width 2
- Buy: arrow, lime, width 3, arrow code 233
- Sell: arrow, red, width 3, arrow code 234
What the file computes
Two averages, one visible
The code keeps a simple average of the lows and a simple average of the highs, both over InpHiLoPeriod bars and both read one bar back.
Only one appears at a time. In an up regime the line follows the average of the lows, sitting underneath price like a floor, and in a down regime it follows the average of the highs.
What flips the regime
A close above the previous average of highs sets the regime up. A close below the previous average of lows sets it down.
In between, the regime simply carries forward. Price can wander a long way without changing anything, which is what gives the line its stepped, patient character.
Marking the flip
When the regime differs from the previous bar, an arrow prints. InpArrowOffset spaces it from the candle by a fixed number of points.
Both averages read the bar before rather than the current one, so the level price has to break is already fixed when the bar opens.
Using it on a chart
The line sits on the opposite side of price from the direction it is describing, which is the point of an activator.
A flip needs a close beyond the other average, not a touch.
In a range the two averages sit close together and flips come quickly.
The line steps rather than glides, since an average of highs or lows only moves as bars enter and leave the window.
Alert channels in this build: popup, push notification, email and sound, one message per closed bar.
Alerts cover popup, push, email and sound on each regime flip. A bar time check keeps it to one alert per closed bar.
Every Alfa Trend Indicator input
Core settings
| Setting | What it does | Default |
|---|---|---|
InpHiLoPeriod |
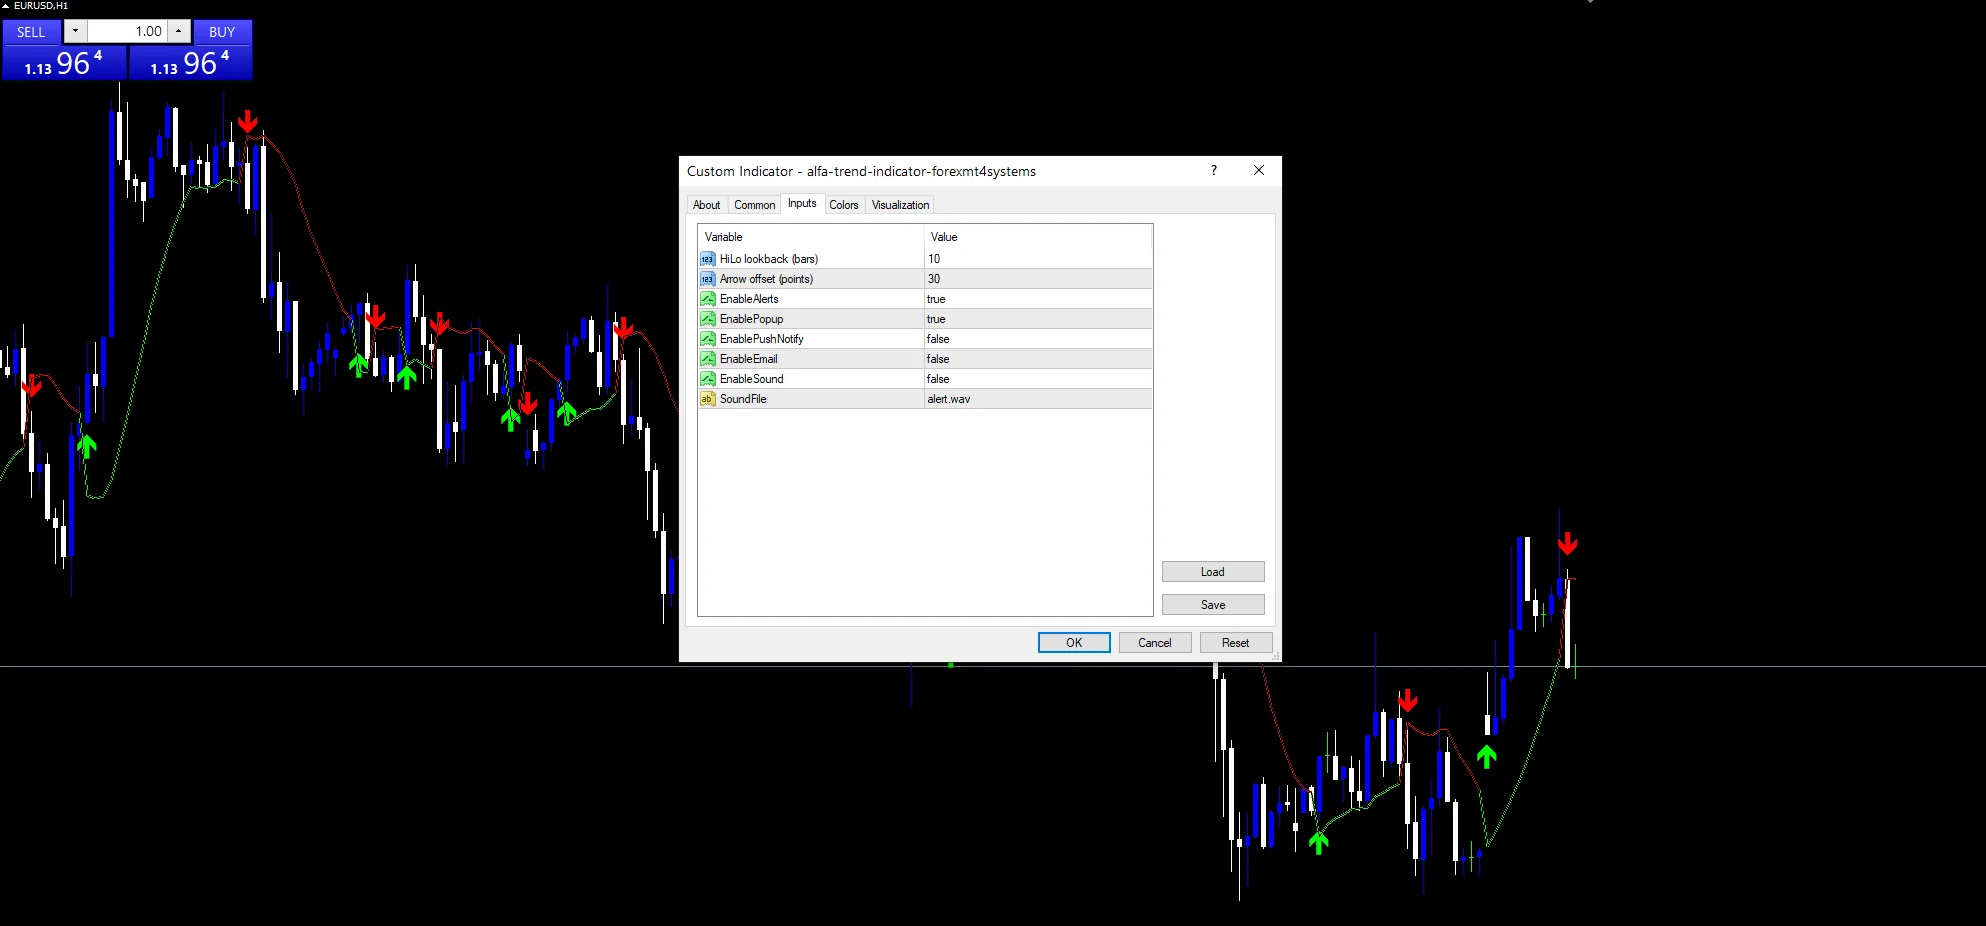
HiLo lookback (bars). InpHiLoPeriod sets the window for both averages. It defaults to 10. A longer setting widens the gap between them and makes flips rarer. | 10 |
Display settings
| Setting | What it does | Default |
|---|---|---|
InpArrowOffset |
Arrow offset (points). InpArrowOffset is the cosmetic gap between an arrow and its candle, 30 points by default. | 30 |
Alert settings
| Setting | What it does | Default |
|---|---|---|
EnableAlerts |
EnableAlerts gates the message block and defaults to true. | on |
EnablePopup |
(see inputs panel) | on |
EnablePushNotify |
EnablePushNotify sends each flip to the MT4 mobile app. It defaults to false. | off |
EnableEmail |
(see inputs panel) | off |
EnableSound |
(see inputs panel) | off |
SoundFile |
(see inputs panel) | alert.wav |
What to load it on
The screenshot uses EURUSD H1. A ten bar window on H1 flips a few times a day on a typical major, which suits intraday work. On H4 and daily the flips become swing events. Below M15 the two averages sit so close together that the regime changes on almost any push.
What it misses
In a range the two averages converge, so the level price must break shrinks and flips come in clusters.
The line offers no measure of how strong a move is. A one point break flips the regime exactly like a decisive one.
Because both averages read one bar back, the level is always slightly stale relative to the candle being tested.
A single InpHiLoPeriod drives both sides, so there is no way to make the up flip harder than the down flip.
Copy the compiled Alfa Trend Indicator file into your MQL4/Indicators folder, and the MT5 build into MQL5/Indicators, then restart the terminal and drag it onto a chart. The step-by-step guide with screenshots is at how to install MT4 and MT5 indicators.
Background reading on the method behind the Alfa Trend Indicator: Financial market impact of the COVID-19 pandemic on Wikipedia, Volume Weighted Average Price VWAP at StockCharts ChartSchool.
Download the Alfa Trend Indicator for MT4 and MT5
The zip holds the compiled Alfa Trend Indicator build for MT4 and MT5, plus a short README. Compiled files only, no source. Enter your email below and the download link arrives in your inbox.
Download this indicator free
Enter your email and the file is yours. You also get the full MT4 and MT5 library.
FAQ
Why does the line sit below price in an up regime?
Because an activator shows the level that would end the current regime, not the one confirming it. While the regime reads up, the line tracks the average of the lows underneath price, and a close below it flips the state. It works as a trailing reference rather than a signal line.
What does InpHiLoPeriod 10 change if I raise it?
Both averages get slower and the gap between them widens, so price has further to travel before a flip. That means fewer flips and longer regimes, at the cost of a later turn when the market genuinely reverses. Lowering it does the reverse.
Does a wick through the line flip the regime?
No. The test uses the close, so price can trade through the level intrabar and finish back on the original side without changing anything. Only a close beyond the opposite average sets a new regime.
Does InpHiLoPeriod work like a moving average crossover?
No. A crossover compares two averages of the same price series against each other. Here one average tracks highs and the other tracks lows, and what matters is where the close sits relative to them rather than how the two averages relate.
Are results guaranteed?
No. Trading involves risk. Results are not guaranteed; past performance is not indicative of future results. Use the Alfa Trend Indicator as one input. Always backtest before trading live.
External references
- The core method is documented in Financial market impact of the COVID-19 pandemic on Wikipedia.
- Additional market context is at Volume Weighted Average Price VWAP at StockCharts ChartSchool.

About the author
Written by Dominic Walsh, a Forex trader and MT4/MT5 indicator, Expert Advisor and script developer. Every tool on forexmt4systems.com is tested on live charts before release and ships with ready-to-use compiled MT4 (.ex4) and MT5 (.ex5) files. Learn more about the trader and developer behind this site.
How we build, test and correct every tool: Editorial & Testing Policy. Trading carries risk; see the disclaimer.