
One number answers the question here. The balanced price range indicator divides this bar’s true range by the average of the last twenty, so 1.0 is an ordinary bar and 2.0 is twice normal. Columns either side of that line take different colours, and expansion reads at a glance.
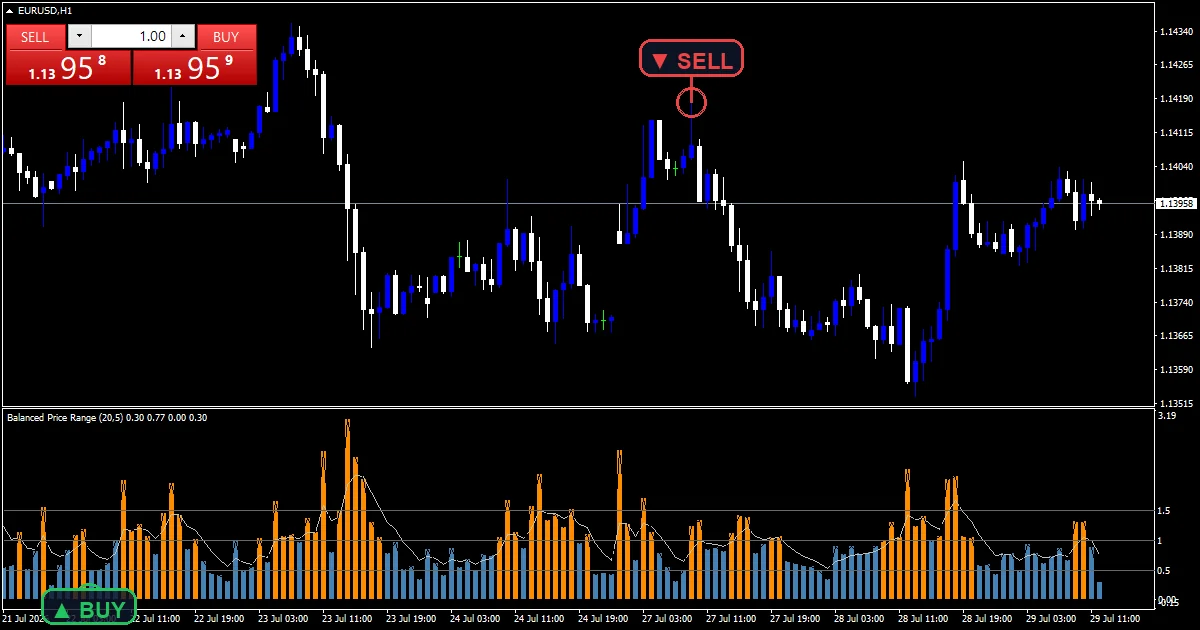
This build ships as a compiled .ex4 for MT4 and .ex5 for MT5; the screenshots below come from EURUSD H1.
| Platforms | MT4 (.ex4) + MT5 (.ex5) |
|---|---|
| Chart window | Separate window (levels 0.5 / 1 / 1.5) |
| Plots | 3: Expansion, Contraction, Smoothed BPR |
| Alerts | popup, push notification, email, sound |
| Inputs | 9 |
Reading the drawn elements
Two histograms and a line, in a pane.
`Expansion` fills dark orange at width 3.
`Contraction` fills steel blue at the same width.
`Smoothed BPR` runs silver at width 1.
Levels sit at 0.5, 1.0 and 1.5.
Only one histogram holds a value per bar.
- Expansion: histogram, dark orange, width 3
- Contraction: histogram, steel blue, width 3
- Smoothed BPR: line, silver, width 1
What the formula does
True range first
Three distances get compared. High to low, high to the previous close, and low to that close. The largest of the three is the true range for that bar.
Against a baseline
`BasePeriod` `20` averages the last twenty true ranges. Dividing this bar by that average gives the ratio, which is what the columns show.
A steadier read
Raw ratios jump about. `SmoothPeriod` `5` averages them into the silver line, which is easier to read than the columns when conditions shift gradually.
How to judge the output
A ratio of 1.0 means an ordinary bar.
Orange columns sit above the average.
Blue columns sit below it.
Levels at 0.5 and 1.5 mark the useful edges.
A run of blue is a market going quiet.
The silver line smooths that judgement.
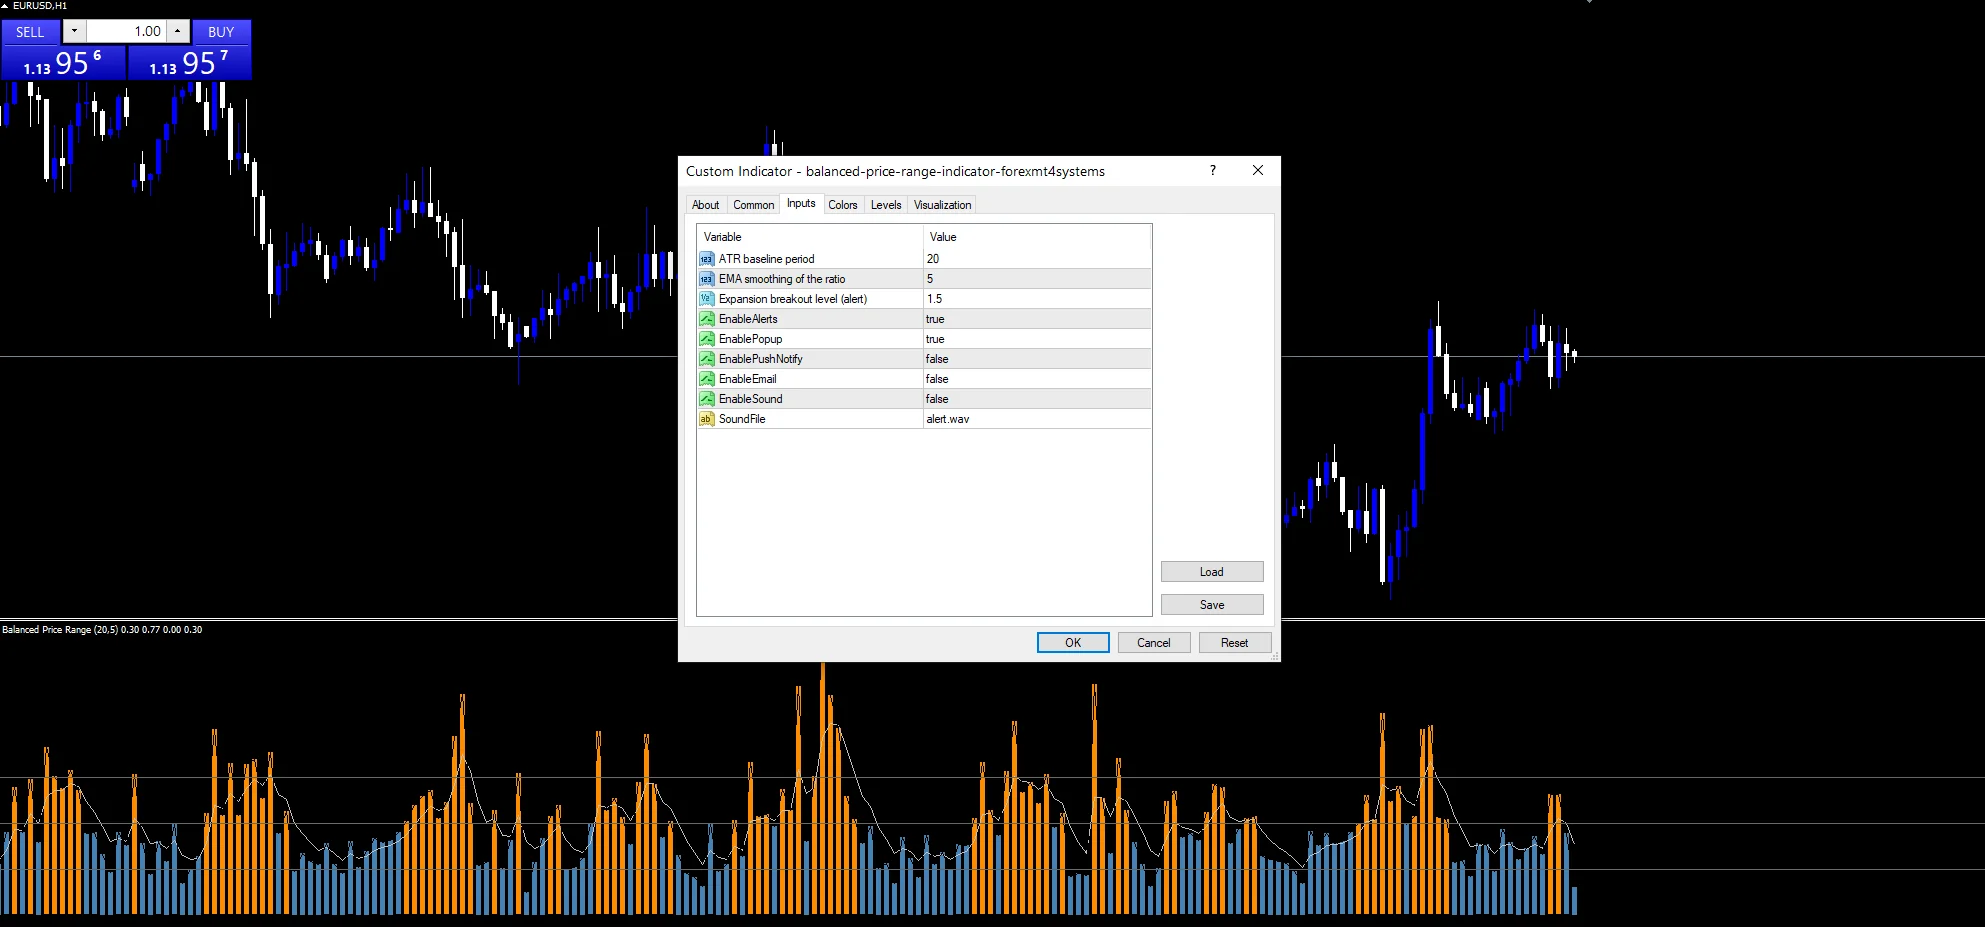
Alert channels in this build: popup, push notification, email and sound, one message per closed bar.
`EnableAlerts` governs the expansion alerts and arrives true with `EnablePopup`. Set `EnablePushNotify` for a phone, `EnableEmail` for mail, or `EnableSound` to sound `SoundFile`. Those three start off.
Every Balanced Price Range Indicator input
Core settings
| Setting | What it does | Default |
|---|---|---|
BasePeriod |
ATR baseline period. Bars in the baseline average, `20`. | 20 |
SmoothPeriod |
EMA smoothing of the ratio. Bars in the silver line, `5`. | 5 |
ExpandThreshold |
Expansion breakout level (alert). Ratio that raises an alert, `1.5`. | 1.5 |
Alert settings
| Setting | What it does | Default |
|---|---|---|
EnableAlerts |
Master switch, `true`. | on |
EnablePopup |
Box in the terminal, `true`. | on |
EnablePushNotify |
Buzz on a phone, `false`. | off |
EnableEmail |
Mail on an expansion, `false`. | off |
EnableSound |
Cue on an expansion, `false`. | off |
SoundFile |
Which clip plays, `”alert.wav”`. | alert.wav |
Matching chart to settings
A ratio is dimensionless, so it reads the same everywhere. EURUSD H1 is the reference chart. Expansions there mark news and session opens. On M5 the ratio is jumpy. On daily bars each column covers a whole session.
Honest weaknesses
A twenty-bar baseline is itself lagging.
After one huge bar the baseline lifts and mutes the next few.
The ratio says size, never direction.
A quiet market makes ordinary bars look like expansions.
Copy the compiled Balanced Price Range Indicator file into your MQL4/Indicators folder, and the MT5 build into MQL5/Indicators, then restart the terminal and drag it onto a chart. The step-by-step guide with screenshots is at how to install MT4 and MT5 indicators.
Related on forexmt4systems.com: Price Action Strategy.
Background reading on the method behind the Balanced Price Range Indicator: Volatility (finance) on Wikipedia, Volatility at Investopedia.
Download the Balanced Price Range Indicator for MT4 and MT5
The zip holds the compiled Balanced Price Range Indicator build for MT4 and MT5, plus a short README. Compiled files only, no source. Enter your email below and the download link arrives in your inbox.
Download this indicator free
Enter your email and the file is yours. You also get the full MT4 and MT5 library.
FAQ
What does ExpandThreshold 1.5 catch?
A bar half again as large as the recent average. That is a common cut-off for a bar worth noticing, and raising it to two makes the alert rare enough to mean something on a fast chart.
Why divide by a BasePeriod average rather than use points?
Because a fifty-point bar means one thing on a quiet cross and another on gold. Dividing by the recent average makes the reading dimensionless, so the same threshold works on any symbol.
What separates the Expansion and Contraction plots?
Which side of 1.0 the ratio lands on. Above the average fills the orange buffer and below it fills the blue one, so only one of the two holds a value on any given bar.
Does the Smoothed BPR line change the alert?
No. The silver line is a five-bar average of the ratio, drawn to make gradual shifts easier to see. The alert reads the raw ratio against the threshold, not the smoothed version.
Are results guaranteed?
No. Trading involves risk. Results are not guaranteed; past performance is not indicative of future results. Use the Balanced Price Range Indicator as one input. Always backtest before trading live.
External references
- Learn more about the underlying method in Share price on Wikipedia.
- For wider market background, see iobv (OBV) at the MQL5 Documentation.

About the author
Written by Dominic Walsh, a Forex trader and MT4/MT5 indicator, Expert Advisor and script developer. Every tool on forexmt4systems.com is tested on live charts before release and ships with ready-to-use compiled MT4 (.ex4) and MT5 (.ex5) files. Learn more about the trader and developer behind this site.
How we build, test and correct every tool: Editorial & Testing Policy. Trading carries risk; see the disclaimer.