
Alexander Elder’s question was narrow and useful. How far below the market’s perceived value did sellers manage to push? The bears power indicator answers it one bar at a time, measuring each low against a thirteen-bar average and reporting the gap in points.
This build ships as a compiled .ex4 for MT4 and .ex5 for MT5; the screenshots below come from EURUSD H1.
| Platforms | MT4 (.ex4) + MT5 (.ex5) |
|---|---|
| Chart window | Separate window (levels 0) |
| Plots | 3: Bears Power +, Bears Power -, Signal |
| Alerts | popup, push notification, email, sound |
| Inputs | 8 |
Its visible parts
Two histograms and a line, in a pane.
`Bears Power +` fills medium sea green at width 3.
`Bears Power -` fills crimson at the same width.
`Signal` traces goldenrod at width 1.
A reference sits at zero across the pane.
Values are points, not prices.
- Bears Power +: histogram, medium sea green, width 3
- Bears Power –: histogram, crimson, width 3
- Signal: line, goldenrod, width 1
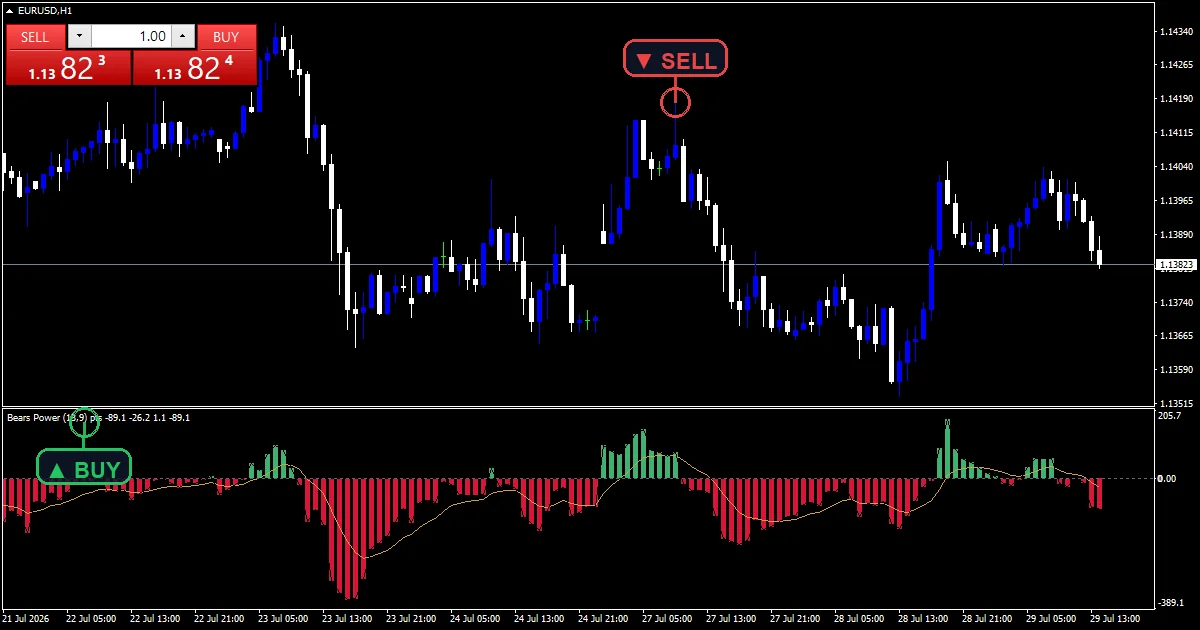
How the Bears Power Indicator does its maths
Low against value
`InpEmaPeriod` `13` gives an exponential average of closes, which Elder treated as the market’s consensus of value. The code then measures each bar’s low against that figure.
Scaled to points
The code divides the gap by the symbol’s point size. Without that step the histogram would stand fractions of a pip tall and the pane would draw as a flat line.
The signal line
`InpSignal` `9` runs an exponential average over the reading itself, not over price. The crossing between the two is what the tool reports.
Making the output useful
Below zero sellers pushed under the average.
Above zero even the low stayed above it.
Green above zero is an unusual, strong condition.
Deepening crimson means sellers are gaining ground.
Shallowing crimson means they are losing it.
Warm-up needs about twenty-five bars.
Alert channels in this build: popup, push notification, email and sound, one message per closed bar.
The reading crossing its own signal is what reports. `EnableAlerts` holds the master switch and the popup box is open already. The push route, the mail route and the desktop clip behind `SoundFile` all wait until you enable them.
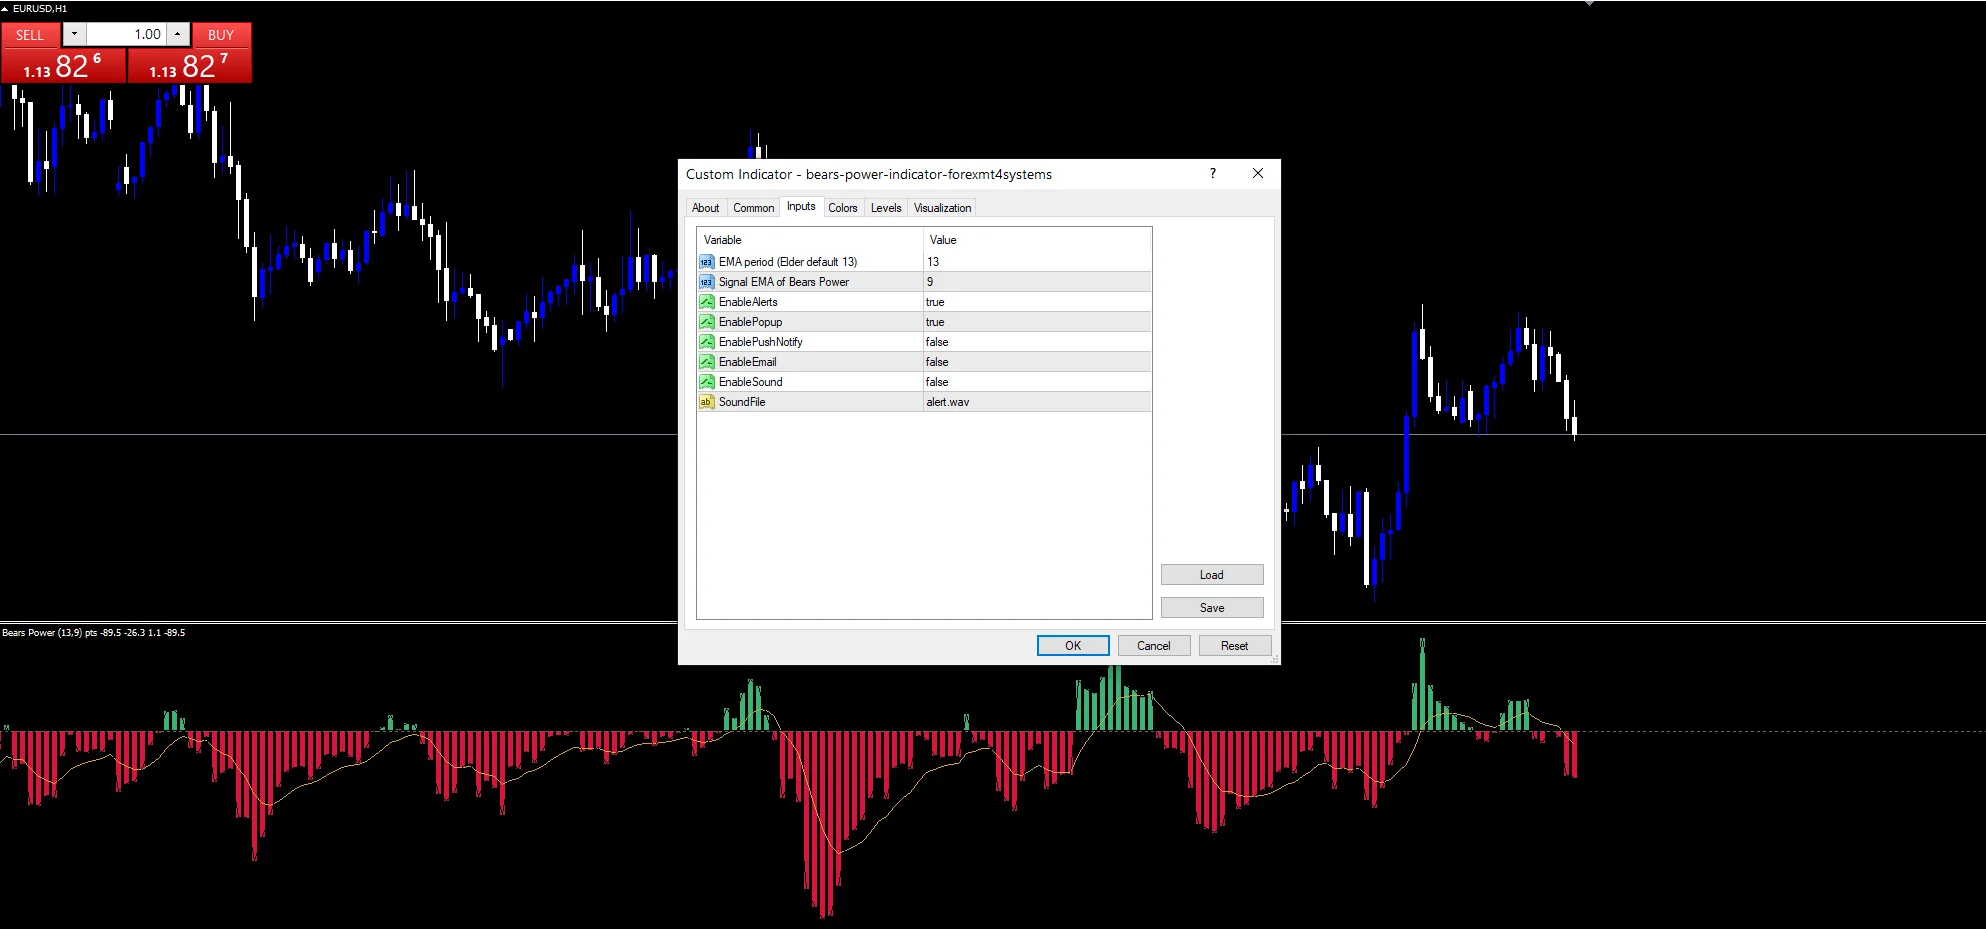
Every Bears Power Indicator input
Core settings
| Setting | What it does | Default |
|---|---|---|
InpEmaPeriod |
EMA period (Elder default 13). Bars in the value average, `13`. | 13 |
InpSignal |
Signal EMA of Bears Power. Bars in the average over the reading, `9`. | 9 |
Alert settings
| Setting | What it does | Default |
|---|---|---|
EnableAlerts |
Master switch on the crossing message, `true`. | on |
EnablePopup |
Popup box, open already, `true`. | on |
EnablePushNotify |
Push route to a phone, `false`. | off |
EnableEmail |
Mail route out, `false`. | off |
EnableSound |
Desktop clip route, `false`. | off |
SoundFile |
Clip on that route, `”alert.wav”`. | alert.wav |
What to load it on
Thirteen bars was Elder’s figure for a daily chart and it still sets the character. EURUSD H1 is the reference chart, where the reading crosses its signal several times a week. On M5 it crosses constantly.
When to distrust it
The reading is almost always below zero.
Point values mean nothing between two symbols.
A crossing lags the low that caused it.
One side of the market is all this measures.
Copy the compiled Bears Power Indicator file into your MQL4/Indicators folder, and the MT5 build into MQL5/Indicators, then restart the terminal and drag it onto a chart. The step-by-step guide with screenshots is at how to install MT4 and MT5 indicators.
Background reading on the method behind the Bears Power Indicator: Elder-Ray Index at Investopedia, Moving average on Wikipedia.
Download the Bears Power Indicator for MT4 and MT5
The zip holds the compiled Bears Power Indicator build for MT4 and MT5, plus a short README. Compiled files only, no source. Enter your email below and the download link arrives in your inbox.
Download this indicator free
Enter your email and the file is yours. You also get the full MT4 and MT5 library.
FAQ
Why is the Bears Power – histogram almost always showing?
Because a bar’s low usually sits below an average of closes. Negative is the normal state; what matters is whether the gap is deepening or shrinking, which is what the colour and the signal line describe.
What does it mean when Bears Power + appears?
The low itself finished above the thirteen-bar average, so sellers could not push price below perceived value at any point in the bar. That is unusual and marks genuinely one-sided buying.
What does InpSignal 9 average?
The reading itself rather than price. A crossing between the histogram and the gold line therefore marks a change in seller pressure, which is a different thing from a change in price direction.
Why is InpEmaPeriod 13 the default?
Elder published it, working from daily charts where roughly thirteen bars covers a trading fortnight. It is short enough to follow a turn and long enough that one bar cannot swing the average.
Are results guaranteed?
No. Trading involves risk. Results are not guaranteed; past performance is not indicative of future results. Use the Bears Power Indicator as one input. Always backtest before trading live.
External references
- The core method is documented in Market anomaly on Wikipedia.
- Additional market context is at VWAP at Investopedia.

About the author
Written by Dominic Walsh, a Forex trader and MT4/MT5 indicator, Expert Advisor and script developer. Every tool on forexmt4systems.com is tested on live charts before release and ships with ready-to-use compiled MT4 (.ex4) and MT5 (.ex5) files. Learn more about the trader and developer behind this site.
How we build, test and correct every tool: Editorial & Testing Policy. Trading carries risk; see the disclaimer.