
This order block indicator finds the last opposing candle before a strong displacement move and boxes it on the chart. It stores the OB Bullish Mid and OB Bearish Mid levels. A BUY or SELL arrow then prints at the impulse bar. The build runs on MT4 and MT5 as a chart overlay. It suits traders who work ICT-style supply and demand zones.
This build ships as a compiled .ex4 for MT4 and .ex5 for MT5; the screenshots below come from EURUSD H1.
| Platforms | MT4 (.ex4) + MT5 (.ex5) |
|---|---|
| Chart window | Main price chart |
| Plots | 4: OB Bullish Mid, OB Bearish Mid, BUY, SELL |
| Alerts | popup, push notification, email, sound |
| Inputs | 12 |
Plot by plot
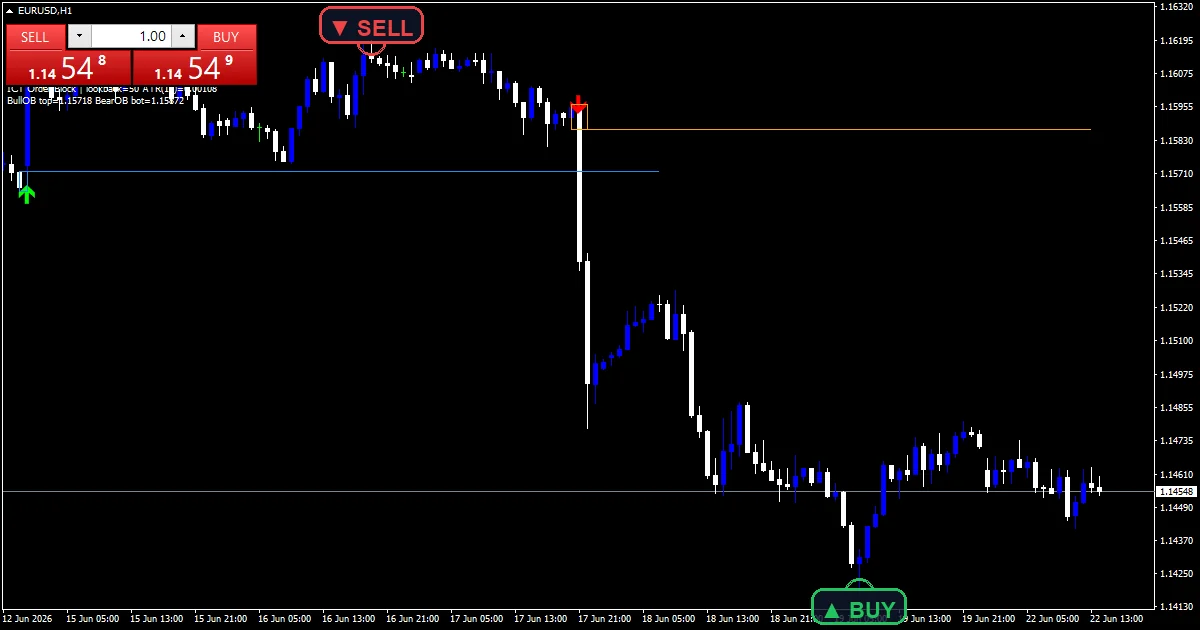
Each bullish block starts with an impulse candle. The code looks back up to eight candles for the last bearish candle before it. That candle’s opening price and low form the block. OB Bullish Mid records the centre of the zone on the impulse bar, in dodger blue. A lime BUY arrow sits 8 points under the impulse low.
Bearish blocks mirror this. The last bullish candle before a bearish impulse supplies its high and opening price. OB Bearish Mid stores the centre in tomato, and a red SELL arrow prints 8 points above the impulse high.
With InpShowRects left at true, a rectangle outlines each block from the opposing candle forward. It runs for InpOBLifeBars bars, 200 by default. InpMaxOB caps the number of rectangles per side at 12.
- OB Bullish Mid: line, dodger blue, width 2
- OB Bearish Mid: line, tomato, width 2
- BUY: arrow, lime, width 2, arrow code 233
- SELL: arrow, red, width 2, arrow code 234
What the file computes
Step 1: size the impulse with ATR
ATR comes first. The code builds a simple ATR over InpATRPeriod bars (default 14). InpImpulseATRmult sets the threshold in tenths of ATR. The default 15 therefore means a body of at least 1.5 ATR. The body must also cover 55 percent or more of the candle’s range. Only a candle that clears both tests counts as an impulse.
Step 2: find the last opposing candle
The search starts once a bullish impulse closes. The scan steps back one candle at a time, up to eight bars. The first bearish candle it meets becomes the block. Its opening price is the top and its low is the bottom. A bearish impulse does the reverse and takes the last bullish candle, using its high and opening price. The code skips the bar that is still forming, so a block only appears after the impulse candle closes.
Step 3: draw and space the blocks
The midpoint lands in OB Bullish Mid or OB Bearish Mid. It sits on the impulse bar, not along the zone. If InpShowRects stays true, a rectangle stretches from the opposing candle to InpOBLifeBars bars later. A new block on the same side needs a gap of more than three bars from the previous one. That stops one wide displacement from stacking several boxes.
How to work with it
A lime BUY arrow under a candle means a new bullish block. Traders who use order blocks wait for price to pull back into the blue rectangle. Then they look for a reaction there. The arrow marks the zone; it is not an instruction to buy the arrow bar.
A red SELL arrow above a candle flags a new bearish block. The tomato rectangle marks the supply zone. OB Bearish Mid gives the middle of the zone as one reference level you can read from the Data Window.
When rectangles stack, the newest one usually matters most, because the latest displacement shows where resting orders last moved price. Blocks that price has already cut through lose most of their value.
Alert channels in this build: popup, push notification, email and sound, one message per closed bar.
Alerts go out by popup, push notification, email and sound, each toggled by its own input. One alert fires per closed bar, on the bar after a BUY or SELL arrow prints.
Every Order Block Indicator input
Core settings
| Setting | What it does | Default |
|---|---|---|
InpLookback |
Structure lookback (bars). InpLookback (default 50) sets the left-edge warm-up margin where the scan begins. Block detection itself does not use it. | 50 |
InpImpulseATRmult |
Impulse threshold = N * ATR / 10. InpImpulseATRmult (default 15) sets the impulse threshold in tenths of ATR. Use 10 on slow pairs or 20 to keep only the biggest moves. | 15 |
InpATRPeriod |
ATR period. InpATRPeriod (default 14) sets how many bars feed the ATR behind the impulse test. A shorter period reacts faster to a volatility change. | 14 |
InpMaxOB |
Max OB rectangles on chart. InpMaxOB (default 12) caps the rectangles the code draws per side; lower it on a busy chart. | 12 |
InpOBLifeBars |
Bars to keep an OB visible. InpOBLifeBars (default 200) fixes how many bars each rectangle extends to the right. Shorten it on low timeframes where zones go stale faster. | 200 |
Display settings
| Setting | What it does | Default |
|---|---|---|
InpShowRects |
Show OB rectangles. InpShowRects (default true) toggles the rectangles; turn it off to keep only the arrows and midpoint levels. | on |
Alert settings
| Setting | What it does | Default |
|---|---|---|
InpEnableAlerts |
Master alert toggle. | on |
InpEnablePopup |
Popup alerts. | on |
InpEnablePush |
Push notification. | off |
InpEnableEmail |
Email alerts. | off |
InpEnableSound |
Sound alerts. | on |
InpSoundFile |
(see inputs panel) | alert.wav |
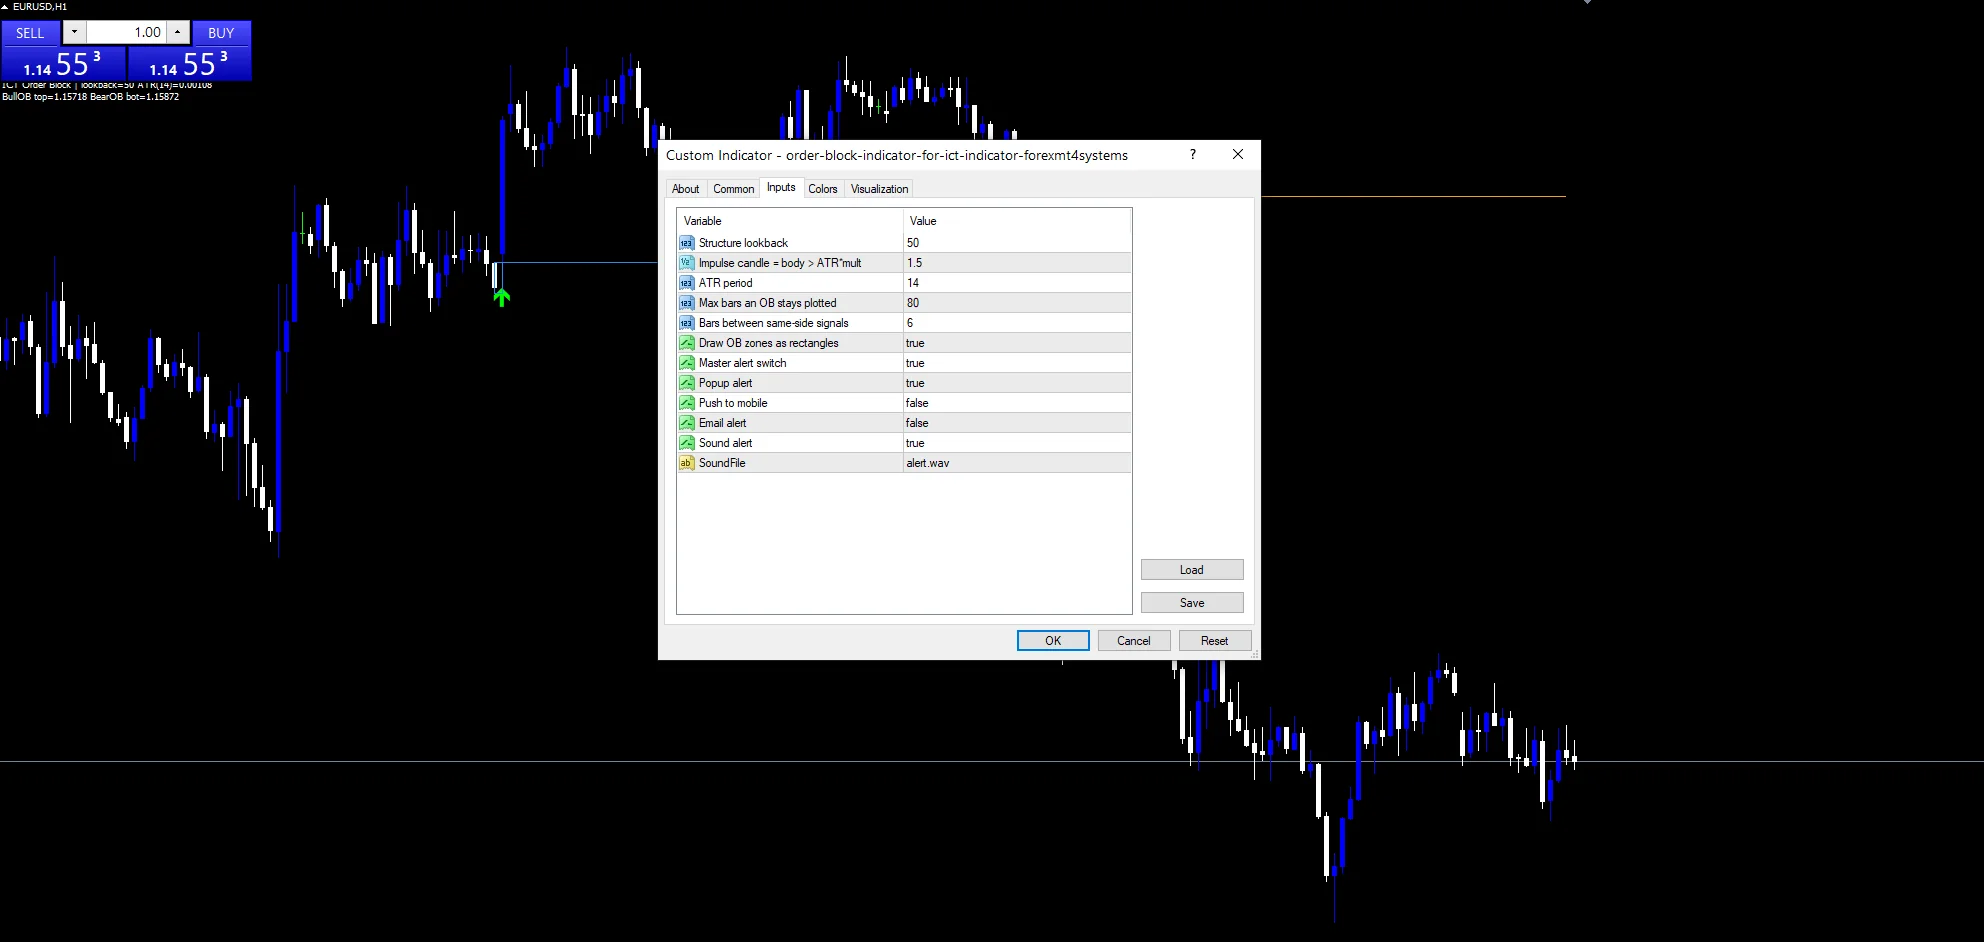
Which chart earns the most from it
The EURUSD H1 chart in the screenshots is the reference setup. On H1 the majors produce enough displacement candles for a few blocks a week, without flooding the chart. The same logic works on H4 and D1. There each block stands for a larger move and tends to hold longer. On M5 and M15 the rectangles stack quickly, so InpOBLifeBars deserves a cut. Gold and index CFDs produce frequent impulses, so a higher InpImpulseATRmult helps there.
Where it comes unstuck
Ranges. A sideways market still produces candles that pass the 1.5 ATR test. The blocks behind them rarely hold, because no real displacement follows. Expect many stacked rectangles and few clean reactions.
One-bar delay. Arrows and boxes only appear after the impulse candle closes. So the signal arrives one full bar after the move started. A fast market may already have pulled back into the zone.
Zone width. The block spans from the opposing candle’s opening price to its extreme. A long-wicked candle therefore creates a wide zone with a vague entry. The box does not tell you which edge will hold.
Copy the compiled Order Block Indicator file into your MQL4/Indicators folder, and the MT5 build into MQL5/Indicators, then restart the terminal and drag it onto a chart. The step-by-step guide with screenshots is at how to install MT4 and MT5 indicators.
Background reading on the method behind the Order Block Indicator: Payment for order flow on Wikipedia, Riskmanagement at Investopedia.
Download the Order Block Indicator for MT4 and MT5
The zip holds the compiled Order Block Indicator build for MT4 and MT5, plus a short README. Compiled files only, no source. Enter your email below and the download link arrives in your inbox.
Download this indicator free
Enter your email and the file is yours. You also get the full MT4 and MT5 library.
FAQ
What does InpImpulseATRmult = 15 mean in practice?
The input works in tenths of ATR. With 15 the candle body must reach 1.5 times the current ATR. The body must also cover at least 55 percent of the candle’s range. Drop it to 10 if blocks never appear on a quiet pair. Push it to 20 to keep only the strongest displacements.
Why does the OB Bullish Mid value only show at the impulse bar?
The code writes the midpoint of the block into that buffer on the bar where the impulse closes. It does not fill the whole zone. Rectangles carry the zone forward for InpOBLifeBars bars. The buffer gives you one exact level to read from the Data Window or pull into an EA.
Do the BUY and SELL arrows repaint on the EURUSD H1 chart?
No. The scan skips the bar that is still forming and only evaluates closed candles. Once a BUY or SELL arrow prints, it stays. The cost is a one-bar delay: you see the block after the impulse closes, not while it is running.
Can InpShowRects hide the rectangles but keep the arrows?
Yes. Set InpShowRects to false and the code stops drawing the boxes. The BUY and SELL arrows and the midpoint buffers keep working. That suits traders who mark zones by hand and only want the impulse detection. It also helps anyone running several overlays on one chart.
Are results guaranteed?
No. Trading involves risk. Results are not guaranteed; past performance is not indicative of future results. Use the Order Block Indicator as one input. Always backtest before trading live.
Category: this is part of our Smart Money collection. Browse more Smart Money for MetaTrader, or explore every MT4 indicator and MT5 indicator on the site.
External references
- The core method is documented in Payment for order flow on Wikipedia.
- Additional market context is at Riskmanagement at Investopedia.

About the author
Written by Dominic Walsh, a Forex trader and MT4/MT5 indicator, Expert Advisor and script developer. Every tool on forexmt4systems.com is tested on live charts before release and ships with ready-to-use compiled MT4 (.ex4) and MT5 (.ex5) files. Learn more about the trader and developer behind this site.
How we build, test and correct every tool: Editorial & Testing Policy. Trading carries risk; see the disclaimer.