
A supply or demand zone marks a spot where price left in a hurry. Also, something absorbed every order at that level, and the market moved away fast. When price returns, the zone often reacts again. That is the whole premise. So the search for the best supply and demand indicator MT4 traders can install comes down to one question: how does the tool find those departure points, and does it draw them honestly? Indeed, this guide ranks ten zone tools from my library of 1,383 free indicator guides. I group them by zone-drawing method, show what each one actually plots, and flag one honest limitation per tool. Still, every pick ships as compiled MT4 (.ex4) and MT5 (.ex5) files behind one free email opt-in.
Supply and demand zones vs support and resistance lines
A support line is a single price. Thus, a demand zone is an area. That difference matters more than it sounds. Hence, price rarely respects one exact tick. It respects the region where unfilled orders sat, and that region has depth. Next, zone tools draw a rectangle from the base of a consolidation to its extreme, so a wick into the area still counts as a test.
The second difference is freshness. Then, a horizontal line gets “stronger” with each touch in classic support and resistance thinking. Zones work the other way. Yet, each test consumes the resting orders that made the zone react. A fresh, untested zone is the high-probability version. Truly, a zone hit three times is mostly spent. Good zone indicators track this and either fade the color or delete the box. Plainly, you can browse every zone tool I cover in the supply and demand indicator hub. One more honest note before the rankings: zones fail. Also, plan the failure with a stop beyond the zone’s far edge, not a hope that the box holds.
Auto zone drawers: swing-base and departure detection
These tools scan closed bars for a base followed by a fast departure, then draw the rectangle for you. Indeed, they differ in how strict the base definition is and in how they age old zones.
| Tool | Zone method | Display | Best timeframes | Alerts |
|---|---|---|---|---|
| Advanced Supply Demand | Basing candles before a strong departure, graded by departure speed | Color-graded rectangles, fresh vs tested shading | M30–D1 | Popup, push, email, sound |
| Auto Supply and Demand | Fractal swing extremes converted to zone rectangles | Plain rectangles, removed once broken | M15–H4 | Popup, push, email, sound |
| Shved Supply Demand | Local high/low clusters merged into wider bands | Broad bands with strength labels | H1–D1 | Popup, push, email, sound |
| Supply and Demand Daily | Zones built only from daily-bar bases | Few large rectangles on any chart timeframe | H1–D1 | Popup, push, email, sound |

Advanced Supply Demand Indicator
The Advanced Supply Demand Indicator looks for a tight cluster of basing candles followed by a strong departure move. Still, the base sets the zone’s height. The departure speed sets its grade. Thus, a zone that price left in two wide bars gets a stronger color than one it drifted away from. The tool also tracks tests: a fresh zone draws solid, and each touch fades the shading. Hence, that freshness logic is the reason it leads this group. You can see at a glance which zones still hold unconsumed orders. Verdict: the most complete single-timeframe zone drawer on this page. Limitation: the grading depends on its departure-strength settings, so two traders with different inputs will see different zone sets.
Auto Supply and Demand Indicator
The Auto Supply and Demand Indicator takes the simplest honest route. Next, it finds confirmed fractal swing highs and lows on closed bars, then draws a rectangle from the swing extreme to the near edge of its base. When price closes through a zone, the box is removed. Then, no grading, no scoring, just current structure. That simplicity makes it the easiest tool here to verify by eye, because every zone maps to a swing you can point at. Verdict: the best starter zone tool; you always know why a box exists. Limitation: fractal swings need confirmation bars, so a brand-new zone appears a few bars after the turn that created it.
Shved Supply Demand Indicator
The Shved Supply Demand Indicator follows the classic Shved algorithm that MT4 traders have passed around for years. Yet, it clusters nearby local highs into one supply band and nearby lows into one demand band, then widens the band as new extremes land inside it. The result is fewer, fatter zones than a swing-based drawer produces. Truly, wide bands suit traders who treat zones as reaction areas rather than precise entries. Verdict: the right pick if single swings feel too noisy and you want consolidated levels. Limitation: merged bands can grow tall on volatile pairs, which forces wider stops if you insist on placing them beyond the zone.
Supply and Demand Daily Indicator
The Supply and Demand Daily Indicator ignores your chart timeframe and builds every zone from daily bars. Plainly, you get the handful of levels that swing traders and larger participants actually watch, projected onto whatever intraday chart you trade. The value is focus. Instead of twenty M15 boxes, you see three or four daily zones that have room to matter. Verdict: best as a context layer under a faster entry tool from this page. Limitation: daily zones update once per day, so intraday traders get no new levels during the session.
How to choose an auto zone drawer
Start from how much interpretation you want the tool to do. Also, auto Supply and Demand does the least: raw swing zones, deleted when broken. Advanced Supply Demand does the most: graded, freshness-tracked boxes. Indeed, shved sits between, consolidating swings into bands. The Daily tool is not really a competitor to the other three; it is the context layer you run underneath one of them. Still, if you are new to zones, begin with the Auto tool for two weeks, learn what a base and departure look like, then graduate to the Advanced version once you can sanity-check its grading.
Multi-timeframe zone tools: higher-timeframe context on one chart
A demand zone on H4 outranks one on M15. Thus, these tools put that hierarchy on a single chart, so you can trade an intraday entry inside a higher-timeframe zone without flipping between windows.
| Tool | Zone method | Display | Best timeframes | Alerts |
|---|---|---|---|---|
| MTF Supply and Demand | Zones computed on one selectable higher timeframe | Higher-TF rectangles drawn on the current chart | M15–H4 | Popup, push, email, sound |
| Multi Time Frame Supply and Demand | Zones from several timeframes stacked together | Color-coded rectangles per timeframe | M30–D1 | Popup, push, email, sound |
| Luxalgo Supply and Demand | Volume-weighted basing detection, TradingView-style port | Rectangles with volume shading | M30–H4 | Popup, push, email, sound |

MTF Supply and Demand Indicator
The MTF Supply and Demand Indicator lets you pick one higher timeframe and draws that timeframe’s zones on your current chart. Hence, trade M15 with H4 zones overlaid, and every intraday setup instantly has context: you either trade toward a higher-timeframe zone or into one. The single-timeframe choice keeps the chart readable, which is the point. Next, zones update only when the higher timeframe closes a bar, so the boxes are stable during your session. Verdict: the cleanest way to add one layer of higher-timeframe structure. Limitation: one overlay timeframe means you still miss zones from the frames you did not select.
Multi Time Frame Supply and Demand Indicator
The Multi Time Frame Supply and Demand Indicator stacks zones from several timeframes at once, each in its own color. Then, where an H1 demand zone sits inside an H4 demand zone, the overlap is visible immediately, and overlapping zones from independent timeframes are the strongest areas this method can identify. This is the tool for traders who plan around confluence rather than single levels. Verdict: the strongest context tool on this page when you want the full zone hierarchy. Limitation: with three or more timeframes active, charts on volatile pairs get crowded, so you must cull timeframes to keep it usable.
Luxalgo Supply and Demand Indicator
The Luxalgo Supply and Demand Indicator brings the popular TradingView-style zone logic to MT4 and MT5. Instead of judging a base only by candle structure, it weights the basing area by traded volume, so a base built on heavy activity draws darker than a thin one. That volume shading is a genuinely different signal from the swing-based tools above. Yet, zones where price based on high volume tend to mark real accumulation rather than drift. Verdict: the pick for traders who already think in volume terms or came from TradingView. Limitation: MT4 feeds tick volume, not real traded volume, so the weighting is an approximation of the original concept.
How to choose a multi-timeframe zone tool
Count the timeframes you actually use. Truly, if your process is “H4 direction, M15 entry”, the single-overlay MTF tool covers it with the least clutter. If you genuinely plan around three or more frames, the Multi Time Frame version earns its busier chart. Plainly, the Luxalgo port is less about timeframes and more about the volume lens; run it beside either MTF tool for a week and keep it only if the volume shading changes decisions. Whichever you pick, resist running all three at once. Also, overlapping rectangles from different tools stop being information and start being wallpaper.
Download the complete indicator database
Every supply and demand tool on this page ships in one download. One email unlocks the full library of 1,380+ tools with compiled MT4 and MT5 files, plus my TradingView scripts. No paywall, no spam, unsubscribe any time.
Get free access to my indicator database
One email unlocks 1,380+ free MT4, MT5 and TradingView indicators — the complete library. No single-tool download; you get the whole database.
Specialty zone tools: non-repaint, Seiden-style, and VSA
These three tools solve specific problems: zones that move after the fact, the strict Sam Seiden pattern definitions, and confirming a zone with volume behavior instead of another rectangle. Still, if you follow order-flow concepts, they pair naturally with the levels covered in my ICT and order block indicators guide.
| Tool | Zone method | Display | Best timeframes | Alerts |
|---|---|---|---|---|
| Non Repaint Supply and Demand | Zones only from closed, confirmed swing structure | Rectangles that never move once drawn | M15–H4 | Popup, push, email, sound |
| Sam Seiden Supply Demand | Drop-base-rally and rally-base-drop pattern detection | Pattern-labeled zones with freshness tracking | H1–D1 | Popup, push, email, sound |
| No Supply No Demand | VSA: narrow-spread, low-volume candles flagged at zones | Candle markers instead of rectangles | M30–H4 | Popup, push, email, sound |
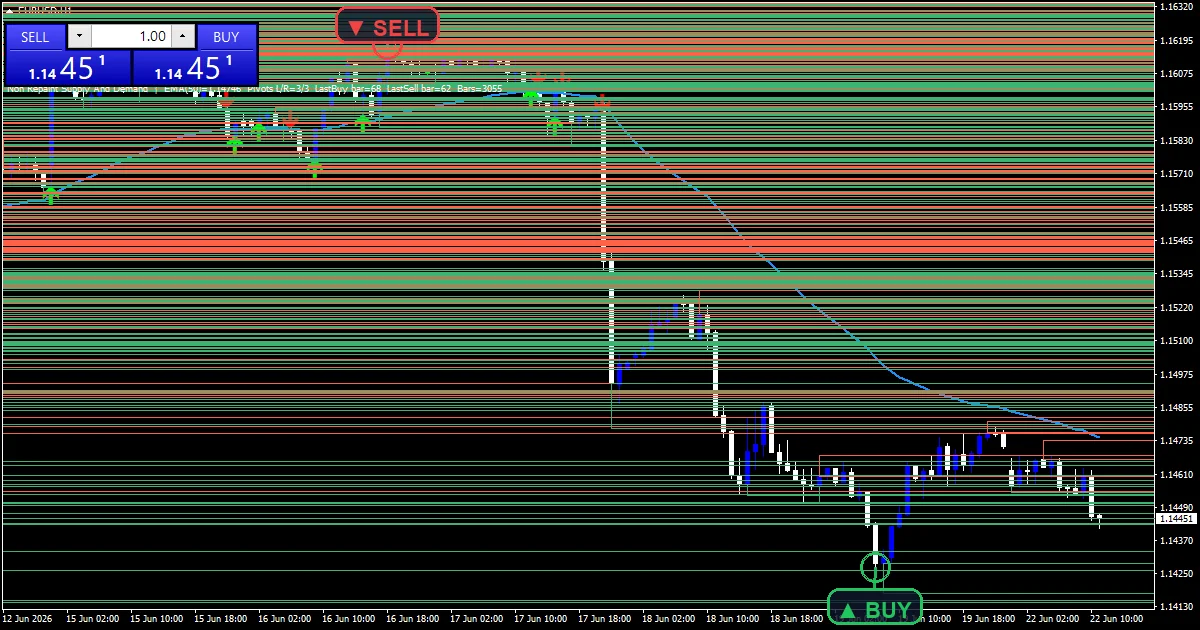
Non Repaint Supply and Demand Indicator
The Non Repaint Supply and Demand Indicator exists because many zone tools quietly redraw. Thus, a box appears, price ignores it, and the box stretches or vanishes as the swing redefines itself. This tool refuses to do that. Hence, it waits until the swing structure is confirmed on closed bars, draws the zone once, and then leaves it alone. What you see in a screenshot is what the tool actually showed at the time. Next, that property makes it the only tool in this list I recommend for reviewing your own past trades. Verdict: the trust pick; zones are slower to appear but never rewritten. Limitation: confirmation costs bars, so fast reversals can leave and return before the zone even prints.
Sam Seiden Supply Demand Indicator
The Sam Seiden Supply Demand Indicator encodes the pattern definitions Sam Seiden popularized: drop-base-rally and rally-base-drop for demand, and their mirrors for supply. Then, it is stricter than a generic zone drawer. The base must be a genuine pause between two opposing moves, not just any consolidation, and each zone is labeled with its pattern type. Yet, the tool also tracks freshness the Seiden way: first return to an untouched zone is the trade; later returns are downgraded. Verdict: best for traders who learned zones from the Seiden school and want the exact patterns marked. Limitation: the strict definitions mean long stretches with no qualifying zones on quiet pairs.
No Supply No Demand Indicator
The No Supply No Demand Indicator is not a rectangle drawer at all. Truly, it applies Volume Spread Analysis and flags no-supply and no-demand candles: narrow-spread bars closing on low volume, which suggest one side has stopped participating. A no-supply candle printing inside a demand zone is the classic confirmation that sellers are exhausted where buyers previously stepped in. Plainly, run it on top of any zone tool from the first two groups and it becomes the trigger layer. Verdict: the best confirmation tool here; it answers “is this zone holding?” bar by bar. Limitation: it needs a zone context from another tool to be useful; the markers alone are just candle anatomy.
How to choose a specialty tool
These are not substitutes for each other. Also, pick the Non Repaint tool if your priority is honest history and you review trades from screenshots. Pick the Seiden tool if you follow that specific methodology and want its patterns enforced rather than approximated. Indeed, pick No Supply No Demand if you already have zones you trust and want a volume-based entry trigger inside them. The strongest combination I have tested pairs one auto drawer from the first group with the VSA markers layered on top: structure from one tool, confirmation from the other, and each tool doing one job.
How I test the best supply and demand indicator MT4 candidates
Every tool above went through the same process before earning a place here. First, the source compiles clean in MetaEditor for both MT4 and MT5, with zero errors and zero warnings under strict mode. Then I load the compiled file on a live EURUSD H1 chart and let it run across real sessions, not just history.
For zone tools, the key check is zone persistence on closed bars. Still, I screenshot the chart, wait, and compare: a zone that was drawn must still be in the same place unless price legitimately broke it. Tools that stretch, slide, or silently delete boxes on old data fail the review. Thus, I also fire every alert path — popup, push, email, and sound — because a zone tool you must watch constantly defeats its own purpose. The full checklist is documented in my editorial and testing policy. Hence, if you are new to MetaTrader files, the step-by-step MT4 and MT5 indicator installation guide covers where the .ex4 and .ex5 files go and how to refresh the Navigator.
Want every tool above in one zip? Get the complete database.
FAQ
What is the difference between supply and demand zones and support and resistance?
Lines mark one price; zones are areas with height, drawn from a base before a fast departure. Next, zones also age differently: each test consumes resting orders, so fresh zones matter more than often-tested lines.
How do I know if a zone is fresh?
A fresh zone has not been touched since it formed. Then, tools like the Advanced and Sam Seiden indicators track this, fading or downgrading a zone after its first test. Otherwise, check manually: count the returns since the departure move.
Do supply and demand indicators repaint?
Some do. Yet, zone tools that redefine swings can stretch or delete boxes after the fact. The Non Repaint Supply and Demand Indicator draws only from confirmed closed-bar structure and never moves a printed zone.
Do these indicators work on MT5 as well as MT4?
Yes. Truly, every download includes a compiled .ex4 file for MT4 and a compiled .ex5 file for MT5, so the same zone logic runs on either platform.
Can a supply and demand zone fail?
Yes, and you should plan for it. Plainly, zones mark areas where orders once sat, not promises that they still do. Place stops beyond the zone’s far edge and size positions so a clean break is survivable; results are not guaranteed; past performance is not indicative of future results.
External references
- Learn more about the underlying method in Curb trading on Wikipedia.
- For wider market background, see Williams R at StockCharts ChartSchool.
Background reading: how to build a forex trading plan.

About the author
Written by Dominic Walsh, a Forex trader and MT4/MT5 indicator, Expert Advisor and script developer. Every tool on forexmt4systems.com is tested on live charts before release and ships with ready-to-use compiled MT4 (.ex4) and MT5 (.ex5) files. Learn more about the trader and developer behind this site.
How we build, test and correct every tool: Editorial & Testing Policy. Trading carries risk; see the disclaimer.