
I have built and chart-tested more than 1,383 free indicators for this site, and volume tools are the group traders ask me about most. Also, this page collects the best volume indicators MT4 users can actually download and run today: volume profile builds, VWAP tools, OBV variants, and a buy/sell pressure meter. MT4 ships with almost nothing here. Indeed, there is no built-in volume profile, no VWAP, and only a bare tick-volume histogram. That gap is exactly why I coded these ten tools myself. Still, each pick below links to its full guide with settings and a free download of compiled MT4 and MT5 files. Where a tool has a real limitation, I say so plainly, because that is how I would want to be told.
Volume profile indicators for MT4
Volume profile plots traded activity by price level instead of by time. Thus, it shows where the market did business — the point of control, the high-volume nodes, the thin shelves price skips through. MT4 has no native version, so these four builds from the volume indicators hub fill the platform’s biggest gap.
| Tool | What it plots | Signal style | Best timeframes | Alerts |
|---|---|---|---|---|
| Volume Profile | Horizontal volume histogram with point of control | Level reaction at high-volume nodes | M30–D1 | On level touch |
| Fixed Range Volume Profile | Profile over a range you define | Break or rejection of range levels | M15–H4 | On level touch |
| Current Volume Profile | Live profile of the current session | Fade or break of today’s value area | M5–H1 | On level touch |
| Drag And Drop Volume Profile | Profile anchored where you drop it | Discretionary level analysis | M15–D1 | On level touch |

My verdicts on the volume profile tools
Volume Profile — This is the one I load first on any fresh chart. Hence, the point of control acts like a magnet in ranging markets, and thin zones explain why price accelerates where it does. Its limitation is history depth: on a chart with little downloaded data, the profile turns coarse and the levels lose precision. Next, press Home to load more bars before you trust it.
Fixed Range Volume Profile — My favorite for post-move analysis. Then, draw the range over the last impulse and you instantly see which prices absorbed the volume. The catch is that you choose the range, and a sloppy range gives you confident-looking levels that mean nothing. Yet, anchor to obvious swing points, not arbitrary bars.
Current Volume Profile — It rebuilds the profile live for the active session, which suits intraday value-area trading. Truly, early in the day it runs shallow: with only a handful of bars, the point of control jumps around. I ignore its levels until London has printed at least two hours of data.
Drag And Drop Volume Profile — The fastest workflow of the four. Plainly, drop the anchor on a swing low, read the profile, move on. Its weakness is the same manual step that makes it flexible: across ten charts, repositioning anchors gets tedious, so it rewards focused traders rather than screeners.
How to choose a volume profile tool
Start with the standard Volume Profile if you want one always-on map of where volume sits. Also, day traders who reset their read each morning should run the Current Volume Profile instead, because yesterday’s nodes matter less than today’s value area. If you study specific swings — a rally, a consolidation, a news leg — the Fixed Range build measures exactly that window. Indeed, the Drag And Drop version is the discretionary trader’s pick: fastest to reposition, but entirely manual.
Whichever you run, learn three levels first. Still, the point of control is the price with the most traded volume; expect reactions there. The value area holds roughly the middle 70% of activity; its edges act as session support and resistance. Thus, thin zones between nodes are where price travels fast, so they make poor entry locations but useful targets.
VWAP indicators for MT4
VWAP is the volume-weighted average price — the level where the average participant is positioned. Hence, institutions benchmark fills against it, which is why price respects it so often. MT4 has no built-in VWAP either, so both tools here are house builds.
The practical read is simple. Next, price holding above VWAP means the average buyer of the session is in profit, and dips into the line tend to find demand. Price below VWAP flips that logic. Then, I treat the line as a bias filter first and an entry level second. I want my intraday longs above it and my shorts below it. Yet, any signal that fights it gets extra scrutiny.
| Tool | What it plots | Signal style | Best timeframes | Alerts |
|---|---|---|---|---|
| Full VWAP | Session VWAP line with deviation bands | Mean reversion to VWAP, band fades | M5–H1 | On line or band cross |
| Anchored VWAP Channel | VWAP from your chosen anchor, with channel bands | Trend pullbacks to the anchored line | M15–D1 | On line or band cross |

My verdicts on the VWAP tools
Full VWAP — My default intraday reference line. Truly, price above VWAP with rising volume tells me buyers control the session; a fade back to the line is my favorite pullback entry. Its limitation is the session reset: late in the day the line flattens and loses pull, and on D1 or higher the concept stops meaning much at all.
Anchored VWAP Channel — Anchor it to a swing low or a news candle and you get the average price of everyone who entered since that event. Plainly, pullbacks to that line in a trend are high-quality locations. The honest catch: the anchor is your judgment call, and a poorly chosen anchor produces bands that look authoritative but track nothing real.
How to choose: Run the Full VWAP if you trade the session open through the London and New York hours. Also, its daily reset matches how intraday flow actually behaves. Choose the Anchored VWAP Channel for swing trades, because anchoring to a structural event keeps the line relevant for days instead of hours. Indeed, many days I run both: session VWAP for timing, anchored VWAP for the bigger position. The deviation bands matter as much as the line itself. Still, the first band is a normal pullback. A tag of the outer band flags a stretched move I would rather fade than chase.
Download the complete indicator database
Every volume tool on this page ships in one download. One email unlocks the full library of 1,380+ tools with compiled MT4 and MT5 files, plus my TradingView scripts. No paywall, no spam, unsubscribe any time.
Get free access to my indicator database
One email unlocks 1,380+ free MT4, MT5 and TradingView indicators — the complete library. No single-tool download; you get the whole database.
OBV and classic volume indicators
On Balance Volume is the oldest volume study that still earns chart space. Hence, it adds volume on up closes and subtracts it on down closes, so the line tracks cumulative buying and selling pressure. The absolute number means nothing; the slope and its agreement with price mean everything. Next, these three tools cover the classic approach, from single-timeframe OBV to a four-timeframe build and a spike-alerting volume average.
| Tool | What it plots | Signal style | Best timeframes | Alerts |
|---|---|---|---|---|
| On Balance Volume | Cumulative OBV line in a subwindow | Divergence and trend confirmation | M30–D1 | On signal-line cross |
| 4 Time Frame OBV 2 | OBV with a moving-average signal line across four timeframes | Multi-timeframe OBV alignment | M15–H4 | On signal-line cross |
| All Volume Average | Tick-volume histogram with a moving-average line | Above-average volume spike, tagged by candle direction | M5–H1 | On volume spike |
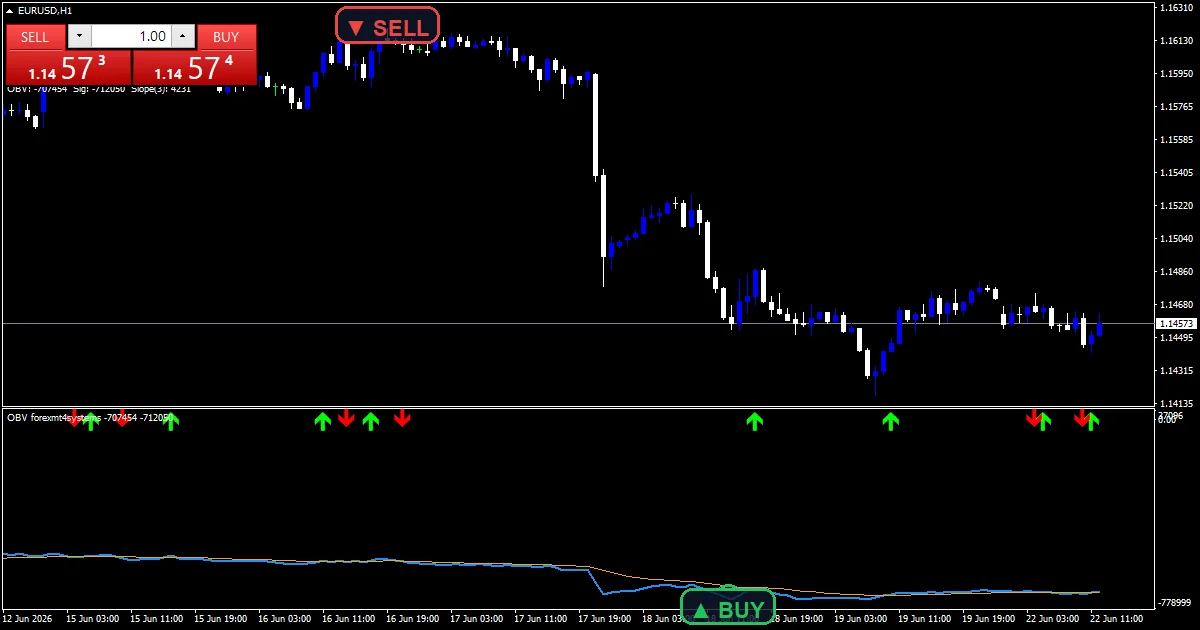
My verdicts on the OBV tools
On Balance Volume — When price makes a new high and OBV refuses to follow, I pay attention; that divergence has warned me off more weak breakouts than any oscillator. Then, its limitation is patience: OBV divergences can persist for many bars before price finally turns, so it locates weakness rather than timing entries.
4 Time Frame OBV 2 — Checking OBV on four timeframes manually is tedious, and this build removes that friction. Yet, when all four agree, the move usually has real participation behind it. The trade-off is signal frequency: strict alignment is rare, so on quiet weeks this indicator stays silent. Truly, that silence is information, but it frustrates impatient traders.
All Volume Average — Simple and useful. Plainly, any bar that prints above its volume average stands out instantly, and the spike alert means I do not have to stare at the histogram. Its limitation is the direction tag. Also, it labels spikes bullish or bearish by candle close, which is crude on dojis and reversal bars. Confirm direction from the candle itself, not the tag.
How to choose an OBV tool
If you want one clean confirmation line under your chart, take the plain On Balance Volume and watch for divergence against price. Indeed, traders who already filter by higher timeframes should upgrade to the 4 Time Frame OBV 2, which does that cross-check for you. The All Volume Average serves a different job entirely: it does not track direction over time, it flags the individual bars where activity jumped. Still, I treat it as a breakout validity check. A break of a profile level on above-average volume deserves attention. Thus, the same break on quiet volume usually retraces.
Buy/sell pressure indicators
Delta tools try to split each bar’s volume into buying and selling. On a centralized exchange that split comes from real order-flow data. In MT4 forex it must be estimated, and it matters that you know the difference before you trust any pressure reading.
The estimation logic works from what MT4 does provide: tick activity and where price traveled inside the bar. Hence, ticks that print while price pushes up get counted as buying pressure, and ticks during downmoves as selling pressure. The split is honest about being a model. In my testing it agrees with the candle story on strong directional bars. It gets fuzzy on quiet, two-sided bars — which is exactly when you should not be trading a pressure reading anyway.
| Tool | What it plots | Signal style | Best timeframes | Alerts |
|---|---|---|---|---|
| Buy Sell Volume | Split histogram of estimated buying vs selling volume | Pressure dominance flip | M5–H1 | On pressure flip |

My verdict on Buy Sell Volume
Buy Sell Volume — I use this to read who pressed harder inside each bar, and the two-color histogram makes momentum shifts visible before the candle pattern confirms them. Next, full honesty on the limitation: MT4 provides no true bid/ask delta, so this indicator estimates pressure from intra-bar price movement. It is a well-behaved approximation, not exchange order flow. Then, treat flips as context, and let price structure trigger the trade.
How to choose: There is no choosing here — this is the only pressure tool that made the cut, and it earns the slot as a confirmation layer. Yet, pair it with a profile level or VWAP touch: when price reaches the level and the histogram flips, the two independent reads agree. On its own it is too noisy to trade. Truly, if you want deeper order-flow context, combine it with the standard Volume Profile from the first section, so pressure flips only count when they happen at a level where volume already proved it matters.
How I test the best volume indicators MT4 offers
Every pick on this page passed the same four-step check before it shipped. First, the compile check: both the MT4 and MT5 source must compile clean, zero errors and zero warnings, in strict mode. Second, a live render on EURUSD H1 — no spikes to zero, no blank subwindows, lines starting where the math has enough data. Third, the non-repaint check: I confirm each signal stays where it printed once its bar closes, by comparing live marks against reloaded history. Fourth, the alert check: each alert must fire once per closed bar, not spam every tick. Plainly, tools that fail any step get fixed or cut. The full procedure, including what I refuse to publish, is documented in my editorial and testing policy.
Installation and where to go next
Setup is the same for every tool here: download the zip, drop the compiled file into your platform’s Indicators folder, restart, and attach it to a chart. Also, the step-by-step walkthrough with screenshots covers both platforms: how to install MT4 and MT5 indicators.
If you want to browse beyond these ten, the volume indicators hub lists every volume tool in the library with its own guide. Indeed, and if volume is just one layer of your stack, my ranked overview of the best MT4 indicators across all categories — trend, signals, oscillators, and more — is the natural next page.
Want every tool above in one zip? Get the complete database.
FAQ
Does MT4 have a built-in volume profile?
No. Still, MT4 ships with a bare tick-volume histogram — no volume profile, no VWAP, no delta. Every profile and VWAP tool on this page is a custom build that adds the horizontal volume view the platform never included.
Is forex volume real volume?
Not in the exchange sense. Thus, Forex is decentralized, so MT4 reports tick volume: the number of price changes per bar at your broker. It tracks activity closely, but it is a proxy, not a contract count. Hence, read it as relative activity, not absolute size.
Which volume indicator suits scalping?
The Current Volume Profile plus the Full VWAP is my scalping pair: today’s value area for location, VWAP for the session mean. Next, add the All Volume Average for breakout bars. Skip the slower OBV tools on M1–M5.
Do these indicators work on MT5?
Yes. Then, every download includes both compiled files — .ex4 for MT4 and .ex5 for MT5 — in one zip. Settings and behavior stay the same on both platforms.
Can I trade volume signals on their own?
I do not recommend it. Yet, volume tools describe participation, not direction, and they work best confirming a level or structure signal. Test any pairing on a demo account first and size conservatively; results are not guaranteed; past performance is not indicative of future results.
External references
- For background on this concept, see Cornering the market on Wikipedia.
- For broader market context, see Weighted Close at StockCharts ChartSchool.
Background reading: how much to risk per trade.

About the author
Written by Dominic Walsh, a Forex trader and MT4/MT5 indicator, Expert Advisor and script developer. Every tool on forexmt4systems.com is tested on live charts before release and ships with ready-to-use compiled MT4 (.ex4) and MT5 (.ex5) files. Learn more about the trader and developer behind this site.
How we build, test and correct every tool: Editorial & Testing Policy. Trading carries risk; see the disclaimer.