
The better nadaraya watson estimator indicator fixes the one problem that keeps kernel regression off most charts. A standard Nadaraya-Watson line weights bars on both sides of the point it estimates, so it keeps redrawing as new candles arrive. This build reads a causal window instead, meaning the current bar and older ones only. A bar’s value stops moving the moment it closes.
This build ships as a compiled .ex4 for MT4 and .ex5 for MT5; the screenshots below come from EURUSD H1.
| Platforms | MT4 (.ex4) + MT5 (.ex5) |
|---|---|
| Chart window | Main price chart |
| Plots | 5: NW estimate, Upper band, Lower band, Buy, Sell |
| Alerts | popup, push notification, email, sound |
| Inputs | 12 |
Plots, colours and placement
NW estimate is the dodger blue line through the middle, the kernel-weighted average of recent closes.
Upper band in salmon and Lower band in medium turquoise form an envelope around it.
Buy marks a lime arrow where price closes back inside the lower band having been below it.
Sell marks a red arrow at the mirror case above the upper band, with BUY and SELL text tags beside them.
- NW estimate: line, dodger blue, width 2
- Upper band: line, salmon, width 1
- Lower band: line, medium turquoise, width 1
- Buy: arrow, lime, width 2, arrow code 233
- Sell: arrow, red, width 2, arrow code 234

From price to plot
Weighting nearby bars with a Gaussian kernel
Each bar’s estimate averages the closes around it, but not equally. The weight for a bar k steps away is exp(-k squared / (2h squared)), where h is `InpBandwidth`. Nearby bars dominate and distant ones fade smoothly. NW[i] takes the weighted sum s divided by g_sumW, the total of those weights.
Keeping the window causal
This is the part that earns the name. The code gathers `InpWindow` bars from the current bar backwards only, never forwards. Standard Nadaraya-Watson looks both ways, which is why its line shifts as future bars appear. Restricting the window to history means the printed value stops moving the moment a bar closes.
Sizing the envelope from actual error
mae takes the running error e divided by `InpMaeWin`, giving the mean absolute distance between price and the estimate over recent bars. Upper[i] then takes NW[i] plus `InpMult` times mae, with Lower[i] subtracting it. The envelope therefore widens when price has been straying from the estimate and tightens when it has been tracking closely.
Marking the return, not the excursion
A buy needs close[i + 1] below Lower[i + 1] and close[i] at or above Lower[i]. Price left the band and came back. Marking the return rather than the excursion is what makes this a mean-reversion tool: an arrow says the stretch has finished, not that it is under way.
How to take it
The blue line is a smoothed read of recent price, not a forecast of the next bar.
A widening envelope means price has been straying from the estimate, so the band adapts rather than staying fixed.
Arrows mark re-entry into the band. Price sitting outside it produces nothing until it comes back.
Because the window is causal, the line lags more than a two-sided kernel would. That lag is the cost of it not redrawing.
Alert channels in this build: popup, push notification, email and sound, one message per closed bar.
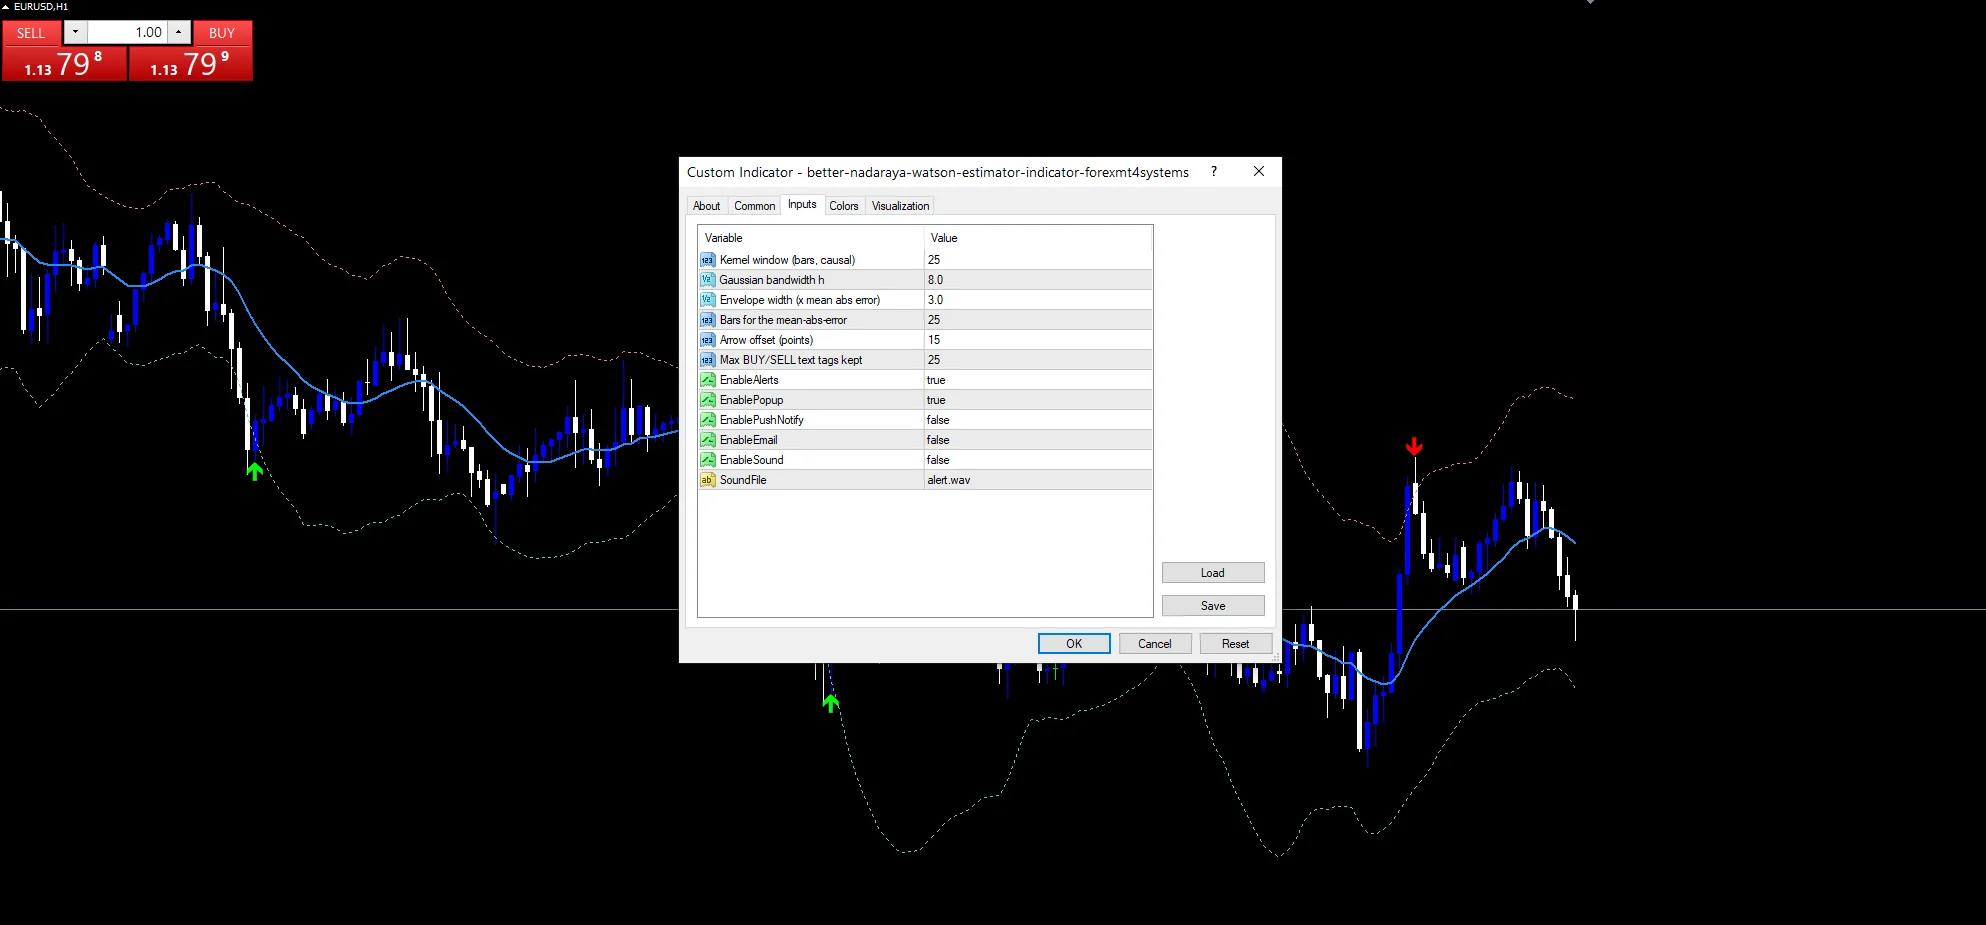
Four channels sit beneath `EnableAlerts`: popup, push notification, email and sound, with `SoundFile` naming the clip. Popup ships enabled. The guard allows one message per closed bar, which suits a signal defined by where a bar closes relative to the band.
Every Better Nadaraya Watson Estimator Indicator input
Core settings
| Setting | What it does | Default |
|---|---|---|
InpWindow |
Kernel window (bars, causal). Bars in the causal kernel window, default `25`. Longer gives a smoother estimate and more lag. | 25 |
InpMult |
Envelope width (x mean abs error). Envelope width as a multiple of the mean absolute error, default `3.0`. Lower it for a tighter band and many more arrows. | 3.0 |
InpMaeWin |
Bars for the mean-abs-error. Bars the mean absolute error averages over, default `25`. | 25 |
Display settings
| Setting | What it does | Default |
|---|---|---|
InpBandwidth |
Gaussian bandwidth h. Gaussian bandwidth h, default `8.0`, controlling how quickly weight falls off with distance. | 8.0 |
InpArrowOffset |
Arrow offset (points). Distance between candle and arrow, default `15` points; `InpMaxLabels` caps the text tags at `25`. | 15 |
InpMaxLabels |
Max BUY/SELL text tags kept. | 25 |
Alert settings
| Setting | What it does | Default |
|---|---|---|
EnableAlerts |
(see inputs panel) | on |
EnablePopup |
(see inputs panel) | on |
EnablePushNotify |
(see inputs panel) | off |
EnableEmail |
(see inputs panel) | off |
EnableSound |
(see inputs panel) | off |
SoundFile |
(see inputs panel) | alert.wav |
Choosing a timeframe
Kernel regression suits instruments that oscillate around a drifting mean, which describes the majors on H1 and H4. The screenshot note calls for EURUSD H1 with the bands visible. On very fast charts the estimate mostly tracks spread noise. On the daily chart a 25-bar window covers over a month, which makes the envelope slow to react to a change in conditions.
Where the method fails
A causal window lags. The estimate sits behind price by construction, and in a fast move the band can be left well behind.
Mean-reversion arrows assume price returns toward the estimate. In a strong trend price rides outside the band and each return is a pause rather than a turn.
The envelope takes its width from recent error, so a sudden volatility change widens it only after the fact. That is exactly when a signal deserves least trust.
Copy the compiled Better Nadaraya Watson Estimator Indicator file into your MQL4/Indicators folder, and the MT5 build into MQL5/Indicators, then restart the terminal and drag it onto a chart. The step-by-step guide with screenshots is at how to install MT4 and MT5 indicators.
Background reading on the method behind the Better Nadaraya Watson Estimator Indicator: Market microstructure on Wikipedia, Triangle at Investopedia.
Download the Better Nadaraya Watson Estimator Indicator for MT4 and MT5
The zip holds the compiled Better Nadaraya Watson Estimator Indicator build for MT4 and MT5, plus a short README. Compiled files only, no source. Enter your email below and the download link arrives in your inbox.
Download this indicator free
Enter your email and the file is yours. You also get the full MT4 and MT5 library.
FAQ
How does the causal InpWindow stop the NW estimate redrawing?
Standard Nadaraya-Watson weights bars on both sides of the point it estimates, so every new candle changes older values and the line shifts. `InpWindow` here gathers only the current bar and older ones. Once a bar closes, no later data feeds its estimate, so the value it printed is final.
What does InpBandwidth control?
How quickly the kernel weight falls off with distance. The weight for a bar k steps away is exp(-k squared / (2h squared)), where h is this setting. A small h makes the estimate hug price by weighting only the nearest bars. A large h spreads weight across the window and smooths harder.
Why does InpMaeWin size the envelope instead of a fixed width?
Because it adapts to how well the estimate is actually tracking price. mae measures the average distance between the two over `InpMaeWin` bars. When price has been straying, the band widens automatically. A fixed-width envelope would be too tight in volatile conditions and too loose in quiet ones.
Does an arrow print when price leaves the band?
No, the opposite. A buy needs close[i + 1] below the lower band and close[i] back at or above it. The signal marks the RETURN inside, not the excursion out. That is what makes it a mean-reversion tool rather than a breakout one.
Are results guaranteed?
No. Trading involves risk. Results are not guaranteed; past performance is not indicative of future results. Use the Better Nadaraya Watson Estimator Indicator as one input. Always backtest before trading live.
External references
- Learn more about the underlying method in Market microstructure on Wikipedia.
- For wider market background, see Triangle at Investopedia.

About the author
Written by Dominic Walsh, a Forex trader and MT4/MT5 indicator, Expert Advisor and script developer. Every tool on forexmt4systems.com is tested on live charts before release and ships with ready-to-use compiled MT4 (.ex4) and MT5 (.ex5) files. Learn more about the trader and developer behind this site.
How we build, test and correct every tool: Editorial & Testing Policy. Trading carries risk; see the disclaimer.