
The better volume 1.5 indicator does more than plot activity. It sorts every bar into one of six types. Two derived figures drive that sorting, not the raw count. Colour then tells you which type you have.
This build ships as a compiled .ex4 for MT4 and .ex5 for MT5; the screenshots below come from EURUSD H1.
| Platforms | MT4 (.ex4) + MT5 (.ex5) |
|---|---|
| Chart window | Separate window |
| Plots | 7: Climax Up, Climax Down, High Churn, Climax + Churn, Low Volume, Normal, Volume MA |
| Alerts | popup, push notification, email, sound |
| Inputs | 8 |
On screen
`Climax Up` fills red and `Climax Down` fills white.
`High Churn` fills lime and `Climax + Churn` fills yellow.
`Low Volume` fills magenta and `Normal` fills dark gray.
A dodger blue `Volume MA` line runs across all of them.
- Climax Up: histogram, red, width 2
- Climax Down: histogram, white, width 2
- High Churn: histogram, lime, width 2
- Climax + Churn: histogram, yellow, width 2
- Low Volume: histogram, magenta, width 2
- Normal: histogram, dark gray, width 2
- Volume MA: line, dodger blue, width 2
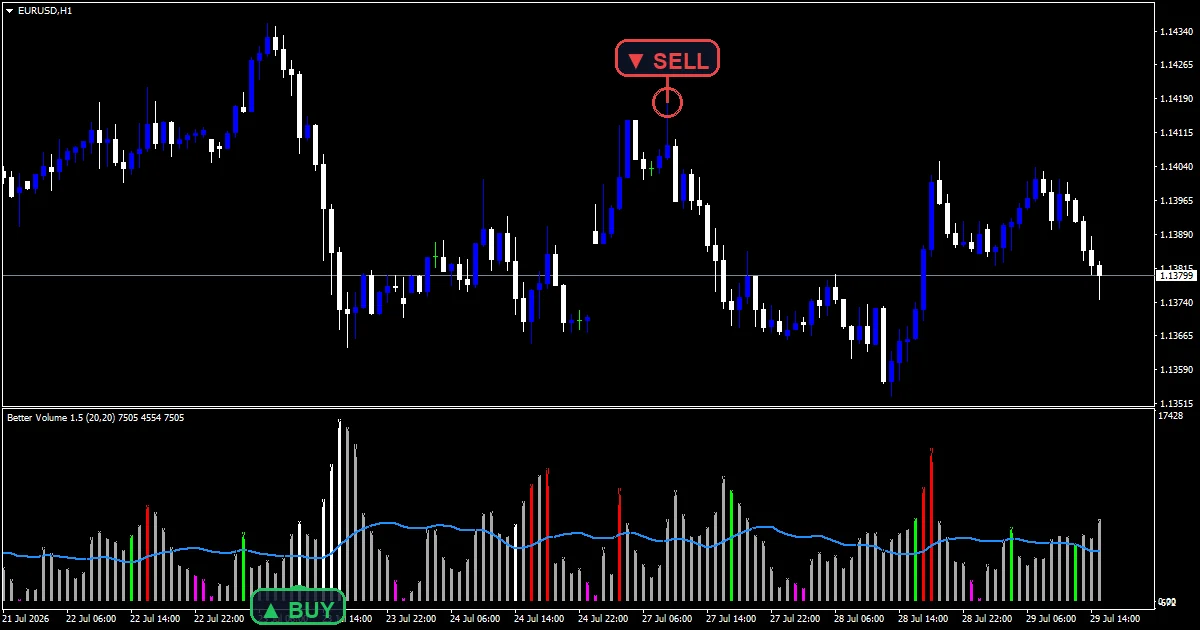
What the build works out
Two derived figures, not one
Each bar produces activity times range and activity divided by range. The first spots effort. The second spots churn. Both get ranked against the last `InpLookBack` `20` bars.
Six classes fall out
A bar topping the effort measure while closing up becomes a climax up. Topping the churn measure instead becomes high churn. Topping both turns yellow, and the quietest bars turn magenta.
The average gives context
iMAOnArray runs over the activity series at `InpMaPeriod` `20`. That line turns an absolute count into something you can judge as high or low.
Reading the plots
Climax bars mark effort, which can mean a push or an exhaustion.
Churn means a lot of activity produced very little range.
`Low Volume` bars often mark the pause before something happens.
Every class comes from tick volume, which counts updates rather than contracts.
Alert channels in this build: popup, push notification, email and sound, one message per closed bar.
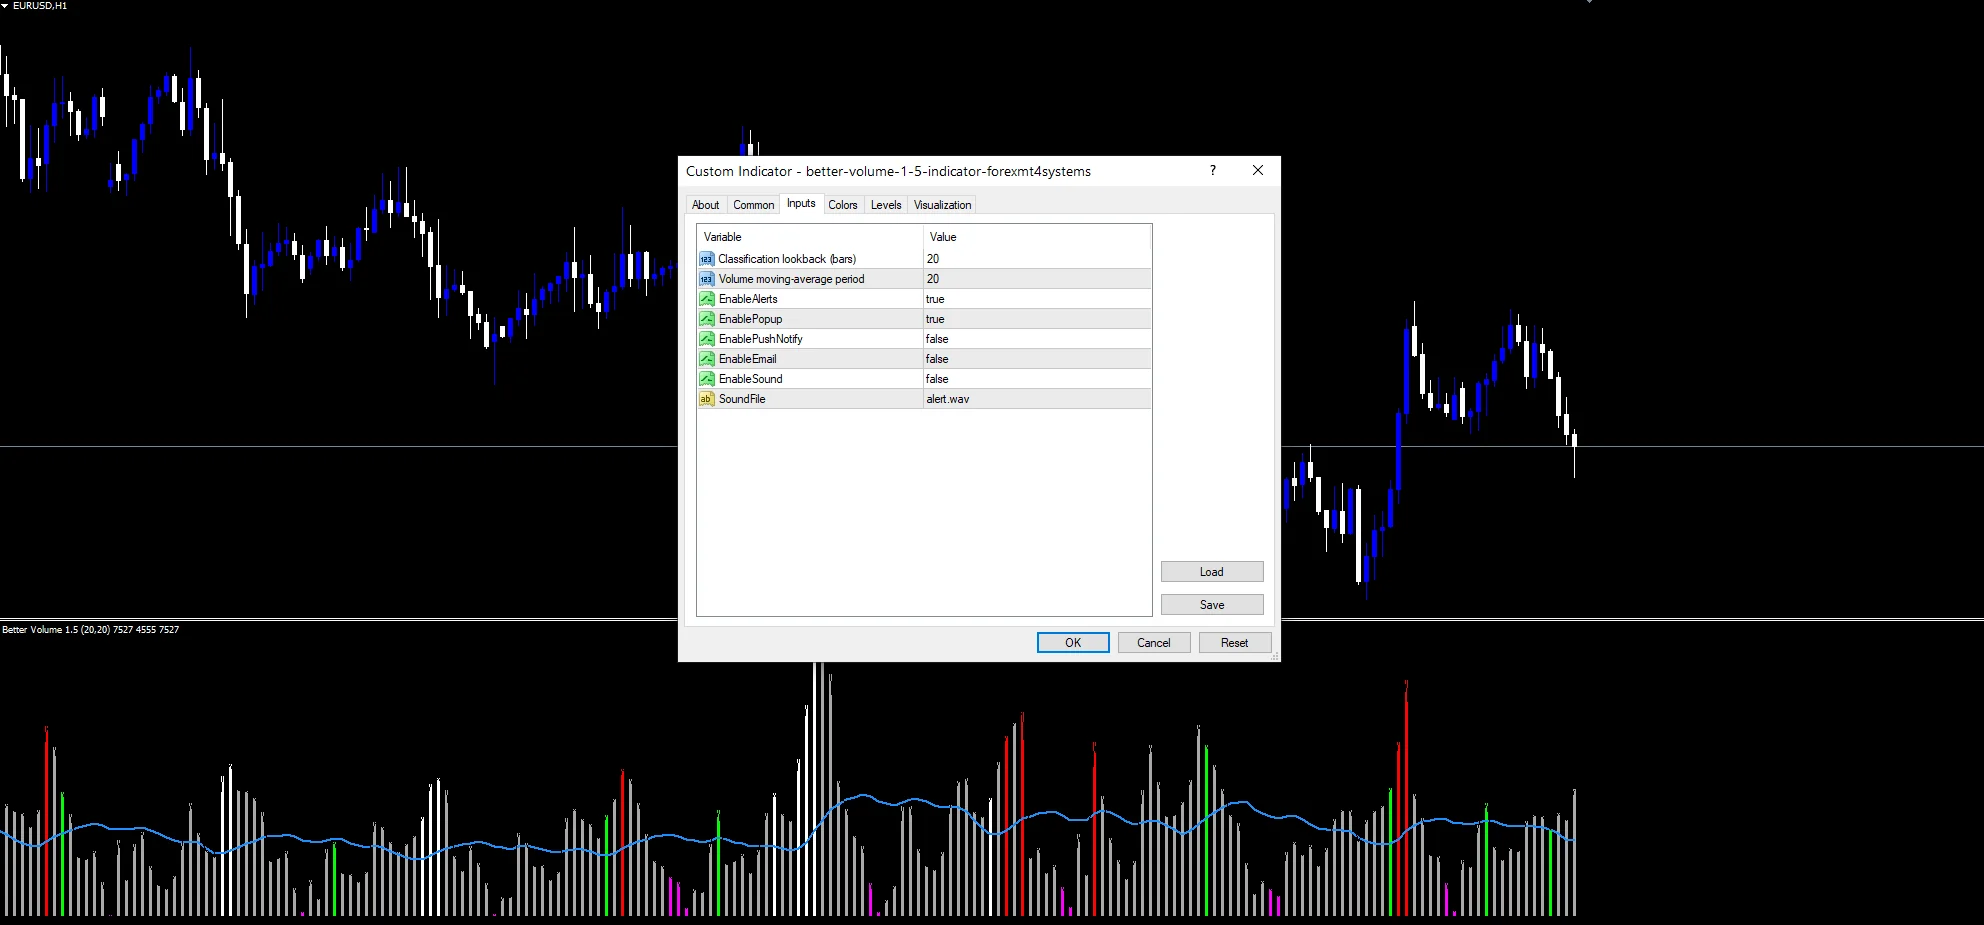
`EnableAlerts` heads the four routes and arrives true with `EnablePopup`. Set `EnablePushNotify` for a mobile push, `EnableEmail` for mail, or `EnableSound` to play `SoundFile`. Those three arrive false. Class changes report on closed bars.
Every Better Volume 1.5 Indicator input
Core settings
| Setting | What it does | Default |
|---|---|---|
InpLookBack |
Classification lookback (bars). Bars each measure gets ranked against, default `20`. | 20 |
InpMaPeriod |
Volume moving-average period. Bars in the activity average, default `20`. | 20 |
Alert settings
| Setting | What it does | Default |
|---|---|---|
EnableAlerts |
Head switch across the four routes, default `true`. | on |
EnablePopup |
MetaTrader dialog on a class change, default `true`. | on |
EnablePushNotify |
Mobile push on a class change, default `false`. | off |
EnableEmail |
Email on a class change, default `false`. | off |
EnableSound |
Audio cue on a class change, default `false`. | off |
SoundFile |
Audio file the cue uses, default `”alert.wav”`. | alert.wav |
Markets and timeframes
Classification needs enough updates per bar. EURUSD H1 is the reference chart. Each bar there carries thousands. On M1 the counts thin out and classes flicker. H4 gives stable, readable classes.
Where it stops working
Forex tick volume counts price updates, and every broker counts differently.
The labels shift as the twenty-bar window moves along.
A climax bar is ambiguous, since effort can mean continuation or exhaustion.
Copy the compiled Better Volume 1.5 Indicator file into your MQL4/Indicators folder, and the MT5 build into MQL5/Indicators, then restart the terminal and drag it onto a chart. The step-by-step guide with screenshots is at how to install MT4 and MT5 indicators.
Background reading on the method behind the Better Volume 1.5 Indicator: Meltdown Monday on Wikipedia, Flag at Investopedia.
Download the Better Volume 1.5 Indicator for MT4 and MT5
The zip holds the compiled Better Volume 1.5 Indicator build for MT4 and MT5, plus a short README. Compiled files only, no source. Enter your email below and the download link arrives in your inbox.
Download this indicator free
Enter your email and the file is yours. You also get the full MT4 and MT5 library.
FAQ
What two figures does InpLookBack rank?
Activity times range, and activity divided by range. The first spots effort, meaning a bar that traded heavily and moved. The second spots churn, meaning heavy trading that went nowhere.
Why does Climax Up draw in red?
Because a climax is ambiguous rather than bullish. Heavy effort on an up bar can mark a strong push or the point where buyers finish. The colouring deliberately avoids implying a direction.
What does InpLookBack 20 rank against?
The last twenty bars. A bar is only a climax relative to its neighbours, so the window decides what counts as extreme. Widening it makes the top classes rarer and more meaningful.
What does a Low Volume bar suggest?
That very little traded. In this method a quiet bar after heavy activity often marks a pause, though on its own it says nothing about which way the pause resolves.
Are results guaranteed?
No. Trading involves risk. Results are not guaranteed; past performance is not indicative of future results. Use the Better Volume 1.5 Indicator as one input. Always backtest before trading live.
External references
- Learn more about the underlying method in Meltdown Monday on Wikipedia.
- For wider market background, see Flag at Investopedia.

About the author
Written by Dominic Walsh, a Forex trader and MT4/MT5 indicator, Expert Advisor and script developer. Every tool on forexmt4systems.com is tested on live charts before release and ships with ready-to-use compiled MT4 (.ex4) and MT5 (.ex5) files. Learn more about the trader and developer behind this site.
How we build, test and correct every tool: Editorial & Testing Policy. Trading carries risk; see the disclaimer.