
The CRT indicator finds Candle Range Theory setups on the MT4 and MT5 price chart. This is the ICT three-candle model. It boxes the range candle, marks the swept side and draws the 50% equilibrium line. A CRT buy or CRT sell arrow then prints on the sweep candle. A small panel reports the last setup, its range and how deep the purge went.
This build ships as a compiled .ex4 for MT4 and .ex5 for MT5; the screenshots below come from EURUSD H1.
| Platforms | MT4 (.ex4) + MT5 (.ex5) |
|---|---|
| Chart window | Main price chart |
| Plots | 4: CRT buy, CRT sell, Range high, Range low |
| Alerts | popup, push notification, email, sound |
| Inputs | 42 |
Which plots exist
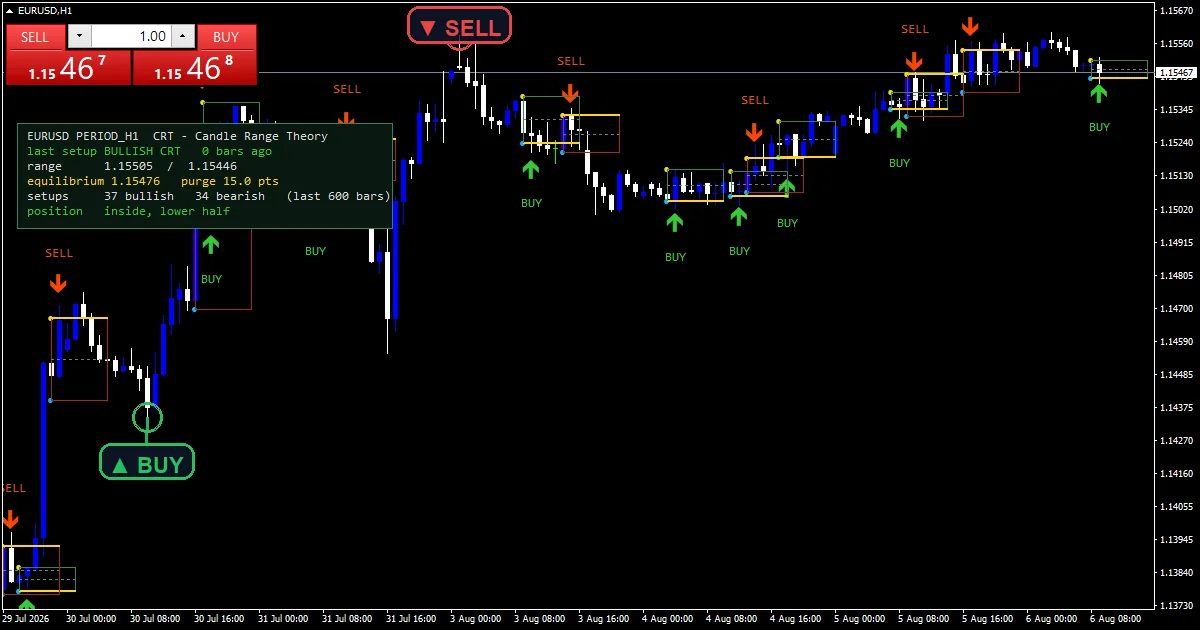
Each setup gets a rectangle across the range candle. It spans high to low and extends InpBoxExtendBars (default 6) bars to the right. The outline shows sea green for a bullish CRT and fire brick for a bearish one. InpFillRectangles (default false) keeps it hollow. A gold dashed ray marks the swept level. A slate gray dotted line marks the 50% equilibrium.
CRT buy prints a lime green arrow, code 233. It sits InpArrowAtr (default 0.40) ATR under the sweep candle’s low. CRT sell prints an orange red arrow, code 234, the same distance above its high. Range high and Range low are small gold and deep sky blue dots, code 159. They mark the range candle’s own extremes.
A BUY or SELL caption sits a fixed pixel gap from each arrow. The top-left panel lists the symbol, the last setup side and its range high and low. It also shows the equilibrium, the purge depth in points and a setup count over InpHistoryBars.
- CRT buy: arrow, lime green, width 2, arrow code 233
- CRT sell: arrow, orange red, width 2, arrow code 234
- Range high: arrow, gold, width 1, arrow code 159
- Range low: arrow, deep sky blue, width 1, arrow code 159
How the values come out
The range candle
Bar i is the sweep candle. Bar r = i + 1 is the range candle. InpRangeMode defaults to 1. In that mode the range candle must span at least InpRangeAtrMult (default 0.70) times ATR. So a doji cannot start a setup. Mode 0 accepts any candle. Mode 2 wants the widest range of the last InpRangeLookback (default 6) bars. ATR is a plain average of true range over InpAtrPeriod (default 14) bars.
The sweep test
Take the bullish case first. Here the sweep candle’s low must sit at least InpMinSweepAtr (default 0.05) ATR below the range low. The close must then land back above that low and at or under the range high. A bearish CRT mirrors it. The sweep candle’s high must exceed the range high by the same margin. Its close must then land back under the high and at or above the range low. With InpRequireEquil (default false) turned on, the close must also clear the 50% line.
Density guards
InpLocalExtreme (default true) demands that the sweep low or high still holds one bar later. The live bar is exempt, so a fresh setup shows at once. InpMinBarsApart (default 6) blocks a second arrow on the same side within that many bars. Only when a setup clears both does the code write the arrow. It then drops the Range high and Range low dots.
Reading it correctly
Start from the box. The range candle holds resting stops at both edges. The gold ray shows which edge the next candle ran through. A CRT buy arrow under a candle means it dipped below the box low and closed back inside. The wick took the resting stops. The expansion should run up toward the untouched high.
A CRT sell arrow above a candle means the mirror. Price poked over the box high and closed back inside. Expansion should then run down toward the box low. Any close past the slate gray equilibrium line is the stronger version of the same setup.
Use the Range high and Range low dots to see which candle defined the box when bars sit close together. The BUY and SELL captions are labels only. The arrow is the buffer value that alerts read.
Alert channels in this build: popup, push notification, email and sound, one message per closed bar.
Alerts go out by popup, push notification, email and sound, each behind its own toggle. They fire once per closed bar. The dispatcher reads bar 1 and stores the bar time, so a setup cannot alert twice.
Every CRT Indicator for MT4 and MT5: Candle Range Theory Sweeps and Boxes input
Core settings: Range candle qualification
| Setting | What it does | Default |
|---|---|---|
InpRangeMode |
Range candle: 0=any 1=ATR filtered 2=widest of lookback. InpRangeMode (default 1) decides what counts as a range candle: 0 takes any candle, 1 needs an ATR-sized range, 2 needs the widest candle of the lookback. | 1 |
InpRangeAtrMult |
Mode 1 – range candle must reach this x ATR. InpRangeAtrMult (default 0.70) is the ATR multiple a range candle must reach in mode 1; raise it to keep only the fat ranges. | 0.70 |
InpRangeLookback |
Mode 2 – must be the widest of this many bars. | 6 |
InpAtrPeriod |
ATR period used for sizing and offsets. InpAtrPeriod (default 14) feeds the ATR behind the range filter, the sweep margin and the arrow offset; shorten it to react faster to a volatility shift. | 14 |
Core settings: Sweep qualification
| Setting | What it does | Default |
|---|---|---|
InpMinSweepAtr |
Minimum purge depth beyond the level (x ATR). InpMinSweepAtr (default 0.05) is how far beyond the range edge the purge must go, in ATR units; raise it to ignore one-tick pokes. | 0.05 |
InpRequireEquil |
Also require the close back beyond the 50% equilibrium. | off |
Core settings: Signal density guards
| Setting | What it does | Default |
|---|---|---|
InpMinBarsApart |
Minimum bars between signals on the same side. InpMinBarsApart (default 6) is the minimum bar gap between two arrows on the same side; raise it on M5 and lower charts to stop the boxes piling up. | 6 |
InpLocalExtreme |
Require the sweep extreme to hold one bar later. | on |
Core settings: Drawing
| Setting | What it does | Default |
|---|---|---|
InpMaxSetups |
Newest setups that keep their boxes and captions. | 24 |
InpBoxExtendBars |
Bars the range box and rays extend to the right. | 6 |
InpFillRectangles |
Fill the range rectangle (off = outline only). | off |
InpTagGapPx |
Caption gap from the arrow, in PIXELS. | 38 |
Core settings: Text fencing
| Setting | What it does | Default |
|---|---|---|
InpPriceScalePx |
Right margin owned by the price scale (px). | 62 |
InpOneClickWpx |
Width of the one-click trade zone, top-left (px). | 260 |
InpOneClickHpx |
Height of the one-click trade zone, top-left (px). | 100 |
Core settings: Readout
| Setting | What it does | Default |
|---|---|---|
InpX |
Panel X offset (px). | 14 |
InpY |
Panel Y offset (px) – clears one-click panel. | 120 |
Display settings
| Setting | What it does | Default |
|---|---|---|
InpHistoryBars |
Bars scanned for setups. | 600 |
InpShowEquil |
Draw the equilibrium (50%) line. | on |
InpShowCaptions |
Draw the BUY / SELL captions. | on |
InpArrowAtr |
Arrow offset from the sweep extreme (x ATR). | 0.40 |
InpLabelEdgePadPx |
Padding kept clear at the chart edges (px). | 10 |
InpAvoidPanel |
Keep captions clear of the info panel. | on |
InpBullColor |
Bullish CRT colour. | lime green |
InpBearColor |
Bearish CRT colour. | orange red |
InpBoxBullColor |
Bullish range box colour. | sea green |
InpBoxBearColor |
Bearish range box colour. | fire brick |
InpSweptColor |
Swept level ray colour. | gold |
InpEquilColor |
Equilibrium line colour. | slate gray |
InpShowPanel |
Show the CRT panel. | on |
InpCorner |
Panel corner (0=UL 1=UR 2=LL 3=LR). | 0 |
InpFontSize |
Panel font size. | 9 |
InpFont |
Panel font. | Consolas |
InpPanelBg |
Panel background. | RGB 10,24,16 |
InpBorderColor |
Panel border. | sea green |
InpTextColor |
Panel text. | gainsboro |
Alert settings
| Setting | What it does | Default |
|---|---|---|
EnableAlerts |
Master alert switch. | on |
EnablePopup |
Terminal popup alert. | on |
EnablePushNotify |
Push notification to phone. | off |
EnableEmail |
Email alert. | off |
EnableSound |
Play a sound file. | off |
SoundFile |
Sound file name. | alert.wav |
Markets that suit it
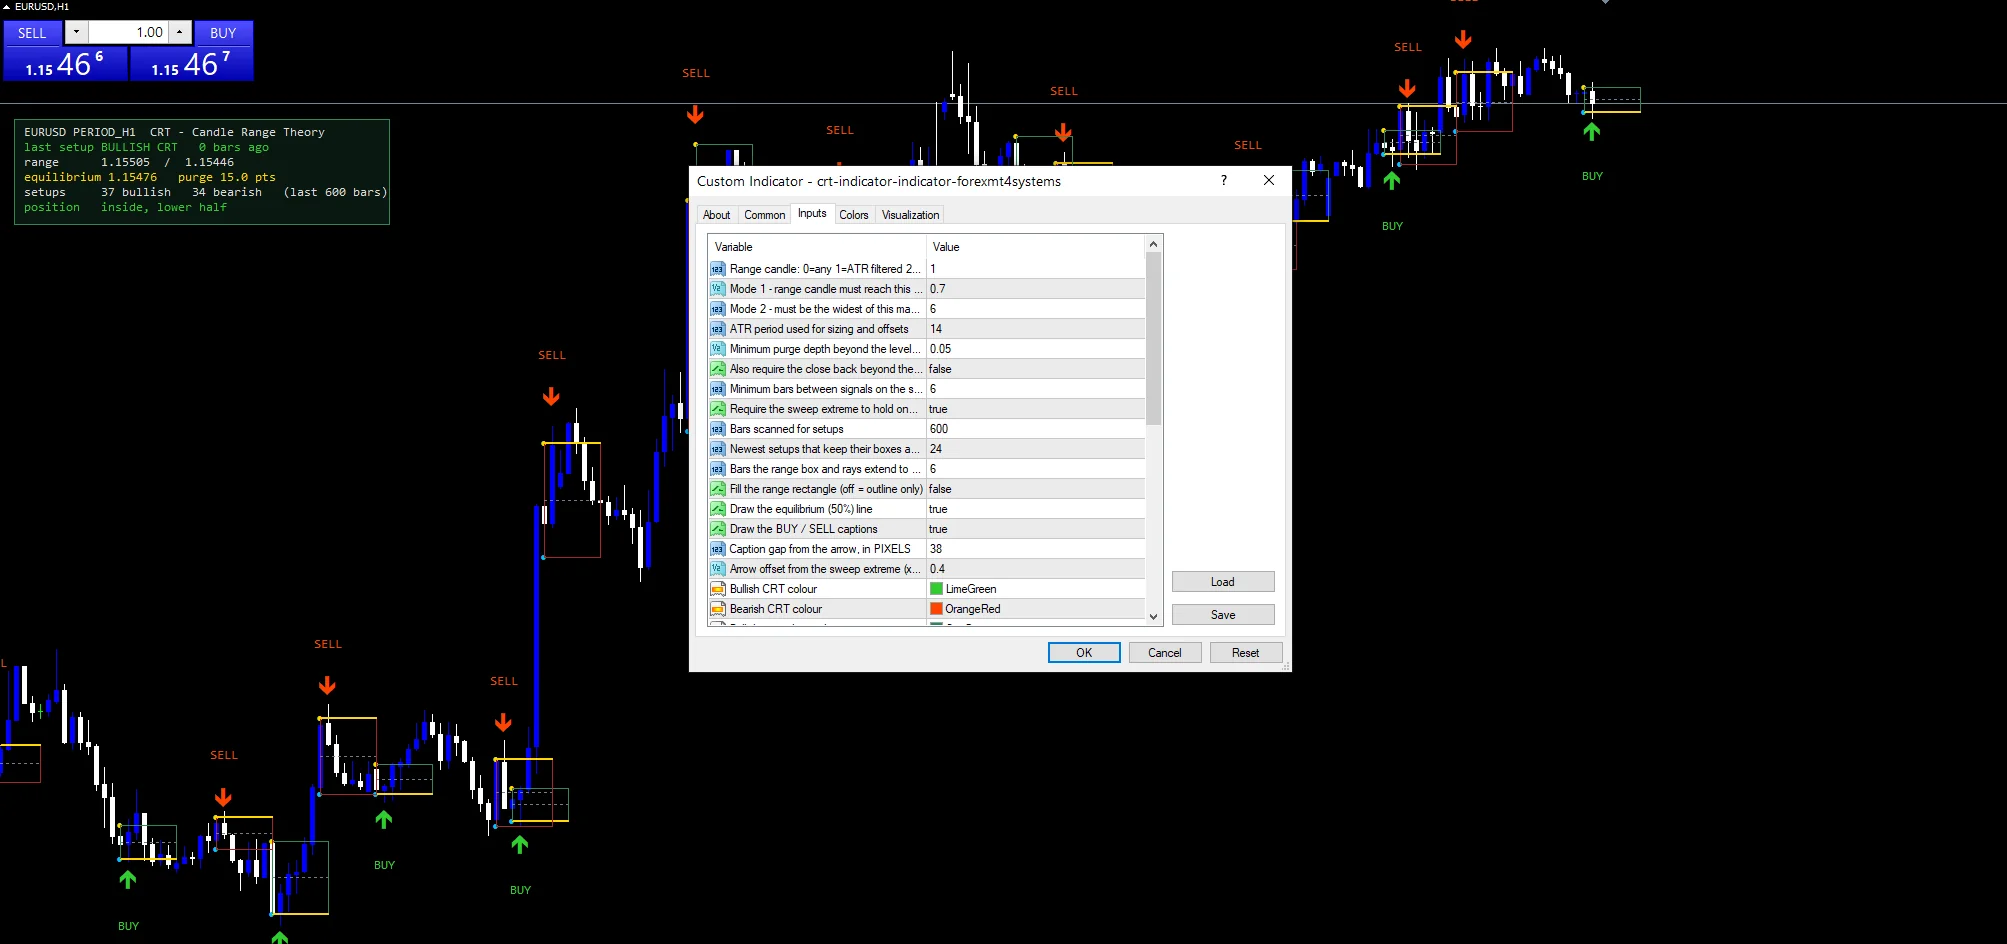
The screenshot pair is EURUSD on H1. There a 14-bar ATR is large enough for the 0.70 range filter to leave several boxes a week. Candle Range Theory comes from the ICT playbook. That school leans on liquid forex majors, gold and index futures; thin symbols give boxes that say little. H1 and H4 keep the setup count manageable. On M5 the density guards do most of the work.
The downsides
Every range candle has two sides. So the pattern would fire constantly without the density guards. Even with InpMinBarsApart at 6 a choppy session can string together alternating buy and sell boxes that resolve nowhere. The close-back-inside rule says nothing about what happens next.
The sweep test is a single bar. A purge that takes two candles to close back inside never qualifies. That shape is common on H4 and daily. The reason is simple: low[i] and close[i] belong to the same bar.
Mode 1 ties everything to a 14-bar ATR. After a volatility spike the ATR inflates. Ordinary range candles then fail the 0.70 multiple for days, so setups vanish just when the market calms. The code also assumes distribution and never checks it.
Copy the compiled CRT Indicator for MT4 and MT5: Candle Range Theory Sweeps and Boxes file into your MQL4/Indicators folder, and the MT5 build into MQL5/Indicators, then restart the terminal and drag it onto a chart. The step-by-step guide with screenshots is at how to install MT4 and MT5 indicators.
Download the CRT Indicator for MT4 and MT5: Candle Range Theory Sweeps and Boxes for MT4 and MT5
The zip holds the compiled CRT Indicator for MT4 and MT5: Candle Range Theory Sweeps and Boxes build for MT4 and MT5, plus a short README. Compiled files only, no source. Enter your email below and the download link arrives in your inbox.
Download this indicator free
Enter your email and the file is yours. You also get the full MT4 and MT5 library.
FAQ
What does InpRangeMode 1 filter out compared with mode 0?
Mode 0 lets any candle with a non-zero range act as the range candle. The default, mode 1, demands a range of at least InpRangeAtrMult (default 0.70) times ATR. So inside bars and dojis no longer seed a box. Mode 2 only accepts the widest candle of the last InpRangeLookback bars.
Why do the CRT buy and CRT sell arrows skip some obvious sweeps?
Three gates sit in front of every arrow. The range candle must pass InpRangeMode. The purge must exceed InpMinSweepAtr times ATR. Then InpLocalExtreme and InpMinBarsApart thin the survivors. A sweep that closes back inside two bars later also fails, because the test reads one candle.
What does the equilibrium line mean inside a CRT range box?
It is the midpoint of the range candle, high plus low over two, drawn as a slate gray dotted line. In the ICT reading a close back past the midpoint after a sweep shows stronger acceptance of the reversal. InpRequireEquil (default false) turns that into a hard filter.
What does the CRT readout panel show on EURUSD H1?
Six rows. The first holds the symbol and timeframe. The second gives the side and age of the last setup. Then come the range high and low, and the equilibrium with the purge depth in points. A count of bullish and bearish setups across InpHistoryBars follows. The last row says where the current close sits relative to that range. InpY (default 120) shifts the panel clear of the one-click trade box.
Are results guaranteed?
No. Trading involves risk. Results are not guaranteed; past performance is not indicative of future results. Use the CRT Indicator for MT4 and MT5: Candle Range Theory Sweeps and Boxes as one input. Always backtest before trading live.
External references
- Learn more about the underlying method in Tail risk on Wikipedia.
- For wider market background, see Arms Index Trin at StockCharts ChartSchool.

About the author
Written by Dominic Walsh, a Forex trader and MT4/MT5 indicator, Expert Advisor and script developer. Every tool on forexmt4systems.com is tested on live charts before release and ships with ready-to-use compiled MT4 (.ex4) and MT5 (.ex5) files. Learn more about the trader and developer behind this site.
How we build, test and correct every tool: Editorial & Testing Policy. Trading carries risk; see the disclaimer.