
The cycle identifier indicator is not an oscillator you read off a pane. The pane only carries the phase. What the tool actually delivers is a confirmed peak or trough stamped on the price chart, and it gets there in three steps: strip the trend out of price, normalise what remains to a 0 to 100 scale, then wait for bars on both sides before calling a turn.
This build ships as a compiled .ex4 for MT4 and .ex5 for MT5; the screenshots below come from EURUSD H1.
| Platforms | MT4 (.ex4) + MT5 (.ex5) |
|---|---|
| Chart window | Separate window (levels 20 / 50 / 80) |
| Plots | 5: Cycle rising, Cycle falling, Cycle position, Confirmed trough, Confirmed peak |
| Alerts | popup, push notification, email, sound |
| Inputs | 37 |
Everything the Cycle Identifier Indicator draws
Cycle rising and Cycle falling form a two-colour phase band in the sub window, green while the cycle climbs and crimson while it falls.
Cycle position is the magenta line on top of that band, scaled 0 to 100 with levels at 20, 50 and 80.
Confirmed trough and Confirmed peak mark the turns, mirrored onto the price chart as arrow objects with BUY and SELL captions.
A phase panel sits in a chart corner, positioned in pixels to clear the broker’s one-click zone.
- Cycle rising: histogram, medium spring green, width 2
- Cycle falling: histogram, crimson, width 2
- Cycle position: line, magenta, width 2
- Confirmed trough: arrow, lime, width 2, arrow code 233
- Confirmed peak: arrow, red, width 2, arrow code 234
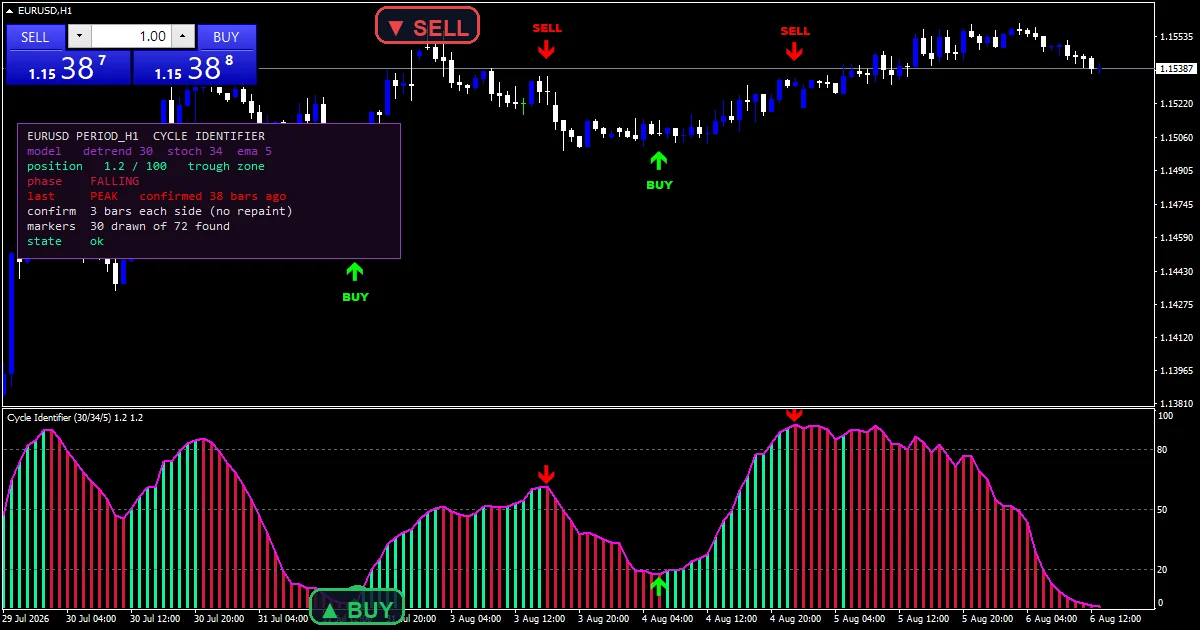
Following the source
Step one, remove the trend
The code subtracts a simple moving average over `InpDetrendPeriod` from price: g_dt[i] takes close[i] minus g_sma[i]. What remains is the swing component with the trend stripped out. A running sum builds the SMA rather than re-adding the whole window each bar, which keeps the pass linear over long history.
Step two, normalise to a bounded phase
The detrended series then runs through a stochastic over `InpStochLen` bars. g_raw[i2] takes 100 times (g_dt – lo) divided by den, where den is the window’s range. That produces a 0 to 100 position comparable across symbols and volatility regimes, which a raw detrended value never would be.
Step three, smooth the chatter out
A raw stochastic is too noisy for pivot work, so an EMA over `InpSmooth` follows. kEma takes 2.0 / (InpSmooth + 1.0), and g_osc[first] seeds unconditionally at g_raw[first] rather than from a conditional mid-array average. `InpDrawSkip` then leaves the first forty bars after the seed undrawn while the EMA settles.
Step four, confirm the turn
A peak needs osc[j] at or above its neighbours for every offset within `InpRequireExtremeBars`, on BOTH sides, and it must sit at or above `InpPeakZone`. A trough mirrors that below `InpTroughZone`. Because the test reads bars on both flanks, and the scan refuses any bar too close to the edge, only closed bars ever produce a marker. `InpAlternate` then insists a trough follows a peak, and `InpMinBarsApart` keeps two turns on the same side from crowding.
Making it useful
The arrows on price are the output. The pane shows you where in the cycle they happened.
Band colour is phase rather than price direction: green means the cycle position is rising.
A turn confirms late by design, since the test needs bars on both sides of it.
Once a marker prints, nothing it read can change, so it stays put.
Alert channels in this build: popup, push notification, email and sound, one message per closed bar.
Four channels sit beneath `EnableAlerts`: a terminal popup, a push notification to your MetaQuotes ID, email configured through Tools then Options, and a sound file from the terminal Sounds folder. Popup ships enabled. The group is labelled one per closed bar, matching turns that only confirm on settled data.
Every Cycle Identifier Indicator input
Core settings: The cycle model
| Setting | What it does | Default |
|---|---|---|
InpDetrendPeriod |
SMA length subtracted from price to remove the trend. Length of the SMA subtracted from price, default `30`. This sets what counts as trend rather than swing. | 30 |
InpStochLen |
Look-back the detrended series is normalised over. Window the detrended series is normalised over, default `34`. | 34 |
InpSmooth |
EMA length applied to the normalised series. EMA length applied to the normalised series, default `5`. Raise it for fewer, cleaner turns. | 5 |
Core settings: Turning points
| Setting | What it does | Default |
|---|---|---|
InpRequireExtremeBars |
LOCAL-EXTREME gate: bars required on BOTH sides of a turn. Bars required on both sides of a turn, default `3`. This is the confirmation delay in bars. | 3 |
InpPeakZone |
A peak must sit at or above this cycle position. A peak must sit at or above this position, default `60.0`, with `InpTroughZone` at `40.0` below. | 60.0 |
InpTroughZone |
A trough must sit at or below this cycle position. | 40.0 |
InpAlternate |
A trough must follow a peak and a peak must follow a trough. | on |
InpMinBarsApart |
Minimum bars between two turns on the SAME side. Minimum bars between two turns on the same side, default `6`. | 6 |
InpMaxMarkers |
How many recent turns are drawn on the price chart. How many recent turns stay drawn on the price chart, default `30`. | 30 |
InpTagGapPx |
Caption gap in PIXELS (Pattern 17), never points. | 38 |
Core settings: Text fencing
| Setting | What it does | Default |
|---|---|---|
InpPriceScalePx |
Right margin owned by the price scale, in pixels. | 62 |
InpOneClickWpx |
Width of the one-click trade panel zone, top-left. | 260 |
InpOneClickHpx |
Height of the one-click trade panel zone, top-left. | 100 |
Core settings: Readout
| Setting | What it does | Default |
|---|---|---|
InpX |
Panel X offset (px). | 14 |
InpY |
Panel Y offset (px) – clears the one-click panel. | 120 |
Display settings
| Setting | What it does | Default |
|---|---|---|
InpMaxBars |
History bars the model is computed over. | 2000 |
InpDrawSkip |
Bars after the seed left undrawn while the EMA settles. | 40 |
InpArrowOffsetPts |
Arrow distance from the bar high / low in points. | 60 |
InpShowTags |
BUY / SELL captions beside the arrows. | on |
InpCapFontSize |
BUY / SELL caption font size. | 9 |
InpBuyColor |
Trough arrow and BUY caption colour. | lime |
InpSellColor |
Peak arrow and SELL caption colour. | red |
InpLabelEdgePadPx |
Padding kept clear at the chart edges, in pixels. | 10 |
InpAvoidPanel |
Keep captions clear of the info panel. | on |
InpShowPanel |
Show the cycle phase panel. | on |
InpCorner |
Panel corner (0=UL 1=UR 2=LL 3=LR). | 0 |
InpFontSize |
Panel font size. | 9 |
InpFont |
Panel font (monospaced keeps the columns square). | Consolas |
InpPanelBg |
Panel background (deep violet). | RGB 22,8,26 |
InpBorderColor |
Panel border colour. | dark orchid |
InpTextColor |
Panel body text colour. | gainsboro |
Alert settings
| Setting | What it does | Default |
|---|---|---|
EnableAlerts |
Master alert switch. | on |
EnablePopup |
Terminal popup alert. | on |
EnablePushNotify |
Push notification to the MetaQuotes ID. | off |
EnableEmail |
E-mail alert (configure Tools > Options > Email). | off |
EnableSound |
Play a sound file when a turn is confirmed. | off |
SoundFile |
Sound file name inside the terminal Sounds folder. | alert.wav |
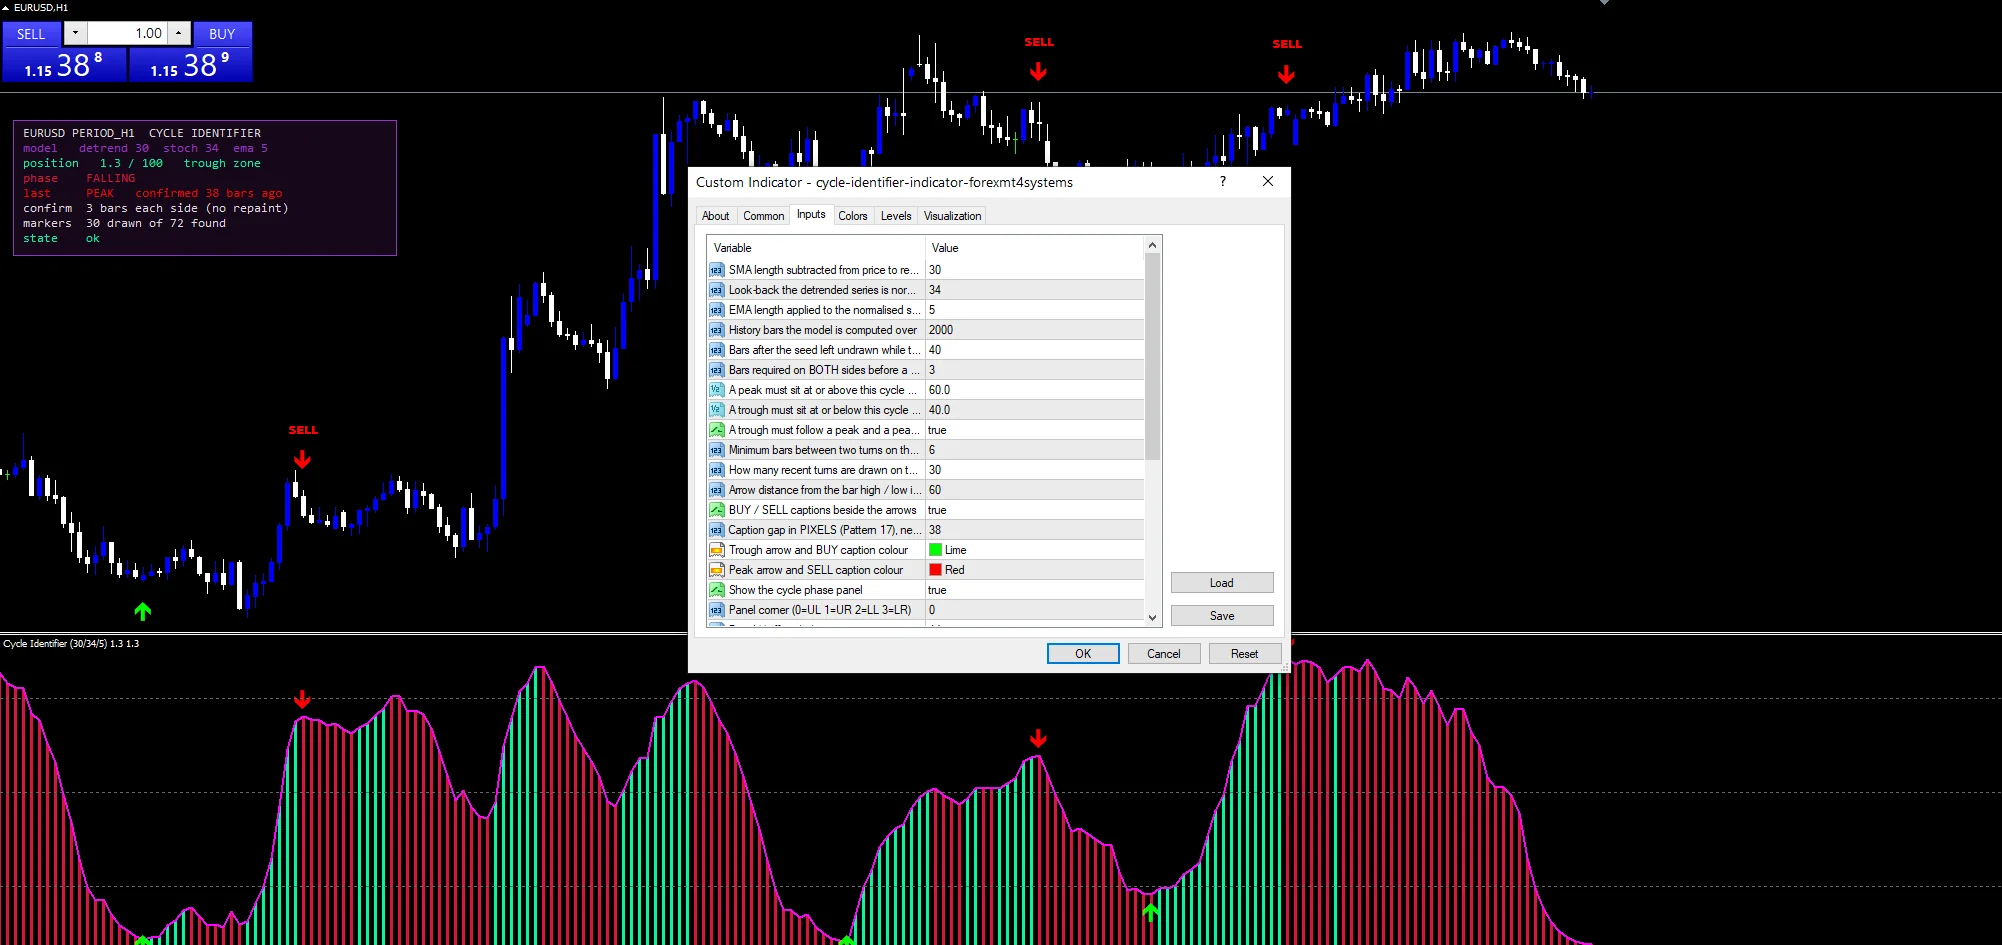
Suitable charts
Detrending and normalising make the phase comparable across instruments, so the same settings travel well. EURUSD H1 is the reference, and the screenshot note asks for the chart and the pane together because both halves matter. On M5 the cycle model still works but turns confirm within minutes and cluster. On H4 and daily each confirmed turn covers real structure.
Known limits
Confirmation costs bars. With three bars required on each side, you learn about a turn at least three bars after it happened.
A cycle model assumes price oscillates around a detrended mean. A strong one-way trend pins the phase at one end and the zone gates stop firing.
The zone rule can reject a genuine turn that formed mid-range, since a peak below 60 never qualifies whatever its shape.
Copy the compiled Cycle Identifier Indicator file into your MQL4/Indicators folder, and the MT5 build into MQL5/Indicators, then restart the terminal and drag it onto a chart. The step-by-step guide with screenshots is at how to install MT4 and MT5 indicators.
Background reading on the method behind the Cycle Identifier Indicator: Market Identifier Code on Wikipedia, Advance Decline Volume Percent at StockCharts ChartSchool.
Download the Cycle Identifier Indicator for MT4 and MT5
The zip holds the compiled Cycle Identifier Indicator build for MT4 and MT5, plus a short README. Compiled files only, no source. Enter your email below and the download link arrives in your inbox.
Download this indicator free
Enter your email and the file is yours. You also get the full MT4 and MT5 library.
FAQ
Why does InpDetrendPeriod come before the normalising step?
Because a stochastic run on raw price mostly measures the trend, not the cycle. Subtracting an `InpDetrendPeriod` SMA removes the drift and leaves the swing component. Normalising that residual gives a phase reading that means the same thing whether price has been rising all week or going nowhere.
What does InpRequireExtremeBars control?
How many bars must sit on each side of a candidate turn without beating it. At `3` the code checks three bars either way, so it needs three bars to have printed after the turn before it can confirm. That delay is the price of a marker that never moves afterwards.
Why do InpPeakZone and InpTroughZone exist?
To keep turns tied to the extremes of the cycle. A local high in the middle of the phase range is usually noise. Requiring a peak to sit at or above `60.0`, and a trough at or below `40.0`, filters those out. Widening the gap between them makes signals rarer and more selective.
What is InpAlternate enforcing?
That turns take it in turns. With it on, a trough must follow a peak and a peak must follow a trough, so the chart cannot fill with three consecutive troughs during a long decline. Combined with `InpMinBarsApart` it keeps the markers readable rather than clustered.
Are results guaranteed?
No. Trading involves risk. Results are not guaranteed; past performance is not indicative of future results. Use the Cycle Identifier Indicator as one input. Always backtest before trading live.
External references
- The core method is documented in Market Identifier Code on Wikipedia.
- Additional market context is at Advance Decline Volume Percent at StockCharts ChartSchool.

About the author
Written by Dominic Walsh, a Forex trader and MT4/MT5 indicator, Expert Advisor and script developer. Every tool on forexmt4systems.com is tested on live charts before release and ships with ready-to-use compiled MT4 (.ex4) and MT5 (.ex5) files. Learn more about the trader and developer behind this site.
How we build, test and correct every tool: Editorial & Testing Policy. Trading carries risk; see the disclaimer.