
The linear regression forecast indicator does the fit and then keeps going. A least-squares line covers `LRLength` bars, and the code extends that same line `ForecastBars` further to the right. What you see beyond the last candle is arithmetic, not a prediction.
This build ships as a compiled .ex4 for MT4 and .ex5 for MT5; the screenshots below come from EURUSD H1.
| Platforms | MT4 (.ex4) + MT5 (.ex5) |
|---|---|
| Chart window | Main price chart |
| Plots | 2: LR Historical, LR Forecast |
| Alerts | popup |
| Inputs | 5 |
Output you can see
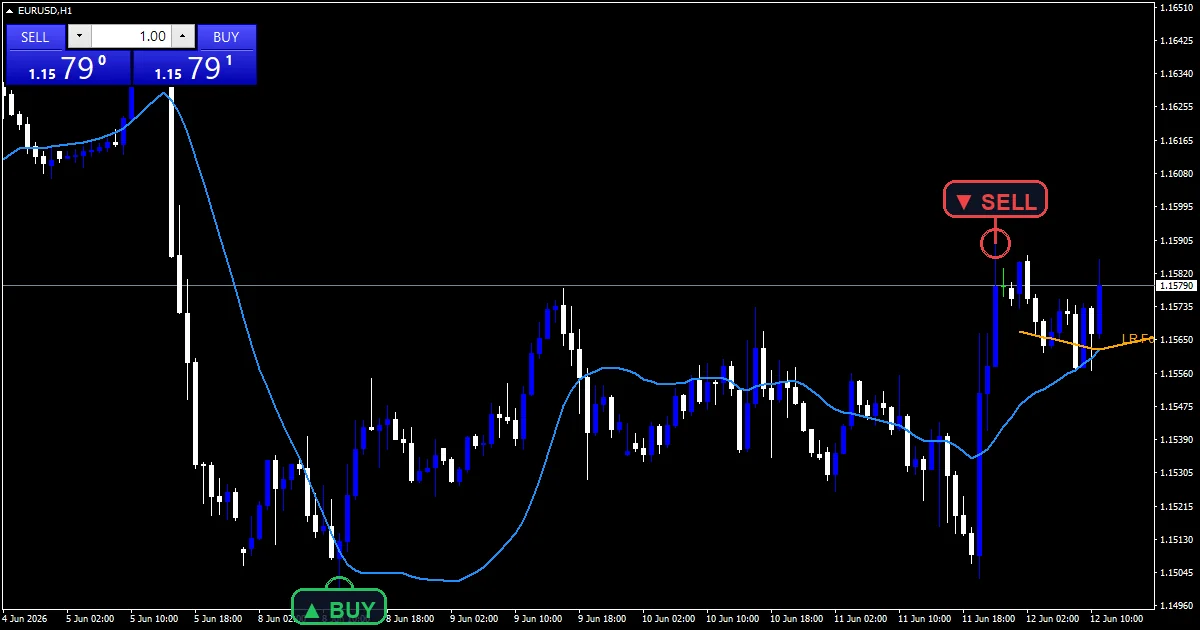
LR Historical is the dodger blue line running through the fit window.
LR Forecast is the orange line extending past the last candle.
OBJ_TREND and OBJ_TEXT objects mark the projection and label its price.
`ShowLabels` turns that label off when the price scale gets crowded.
- LR Historical: line, dodger blue, width 2
- LR Forecast: line, orange, width 2
Working it out
Solving the fit
The code accumulates sumK2 and sumKP across the window. denom takes N times sumK2 minus sumK squared. b then solves for the slope and a for the intercept. Those are the textbook least-squares equations.
Extending the line
y0 evaluates the fit at the last bar of the window. Each forecast step then evaluates it further along the same straight line. Nothing new is calculated, so the orange line is simply the blue one continued.
Choosing the source
`AppliedPrice` decides which series the fit reads, defaulting to PRICE_CLOSE. Switching to a median or typical price brings the wicks in, which tilts the line slightly on an instrument with long tails.
What the states mean
The orange line shows where the current fit would land, not where price will.
A steep slope means the last `LRLength` bars moved decisively in one direction.
The whole line refits each bar, so the forecast shifts with it.
A straight line describes a straight leg well and a turning market badly.
Alert channels in this build: popup, one message per closed bar.
`AlertOnSlopeFlip` ships on and raises a terminal popup when the slope changes sign. This build carries no push, email or sound channel. The guard permits one message per closed bar.
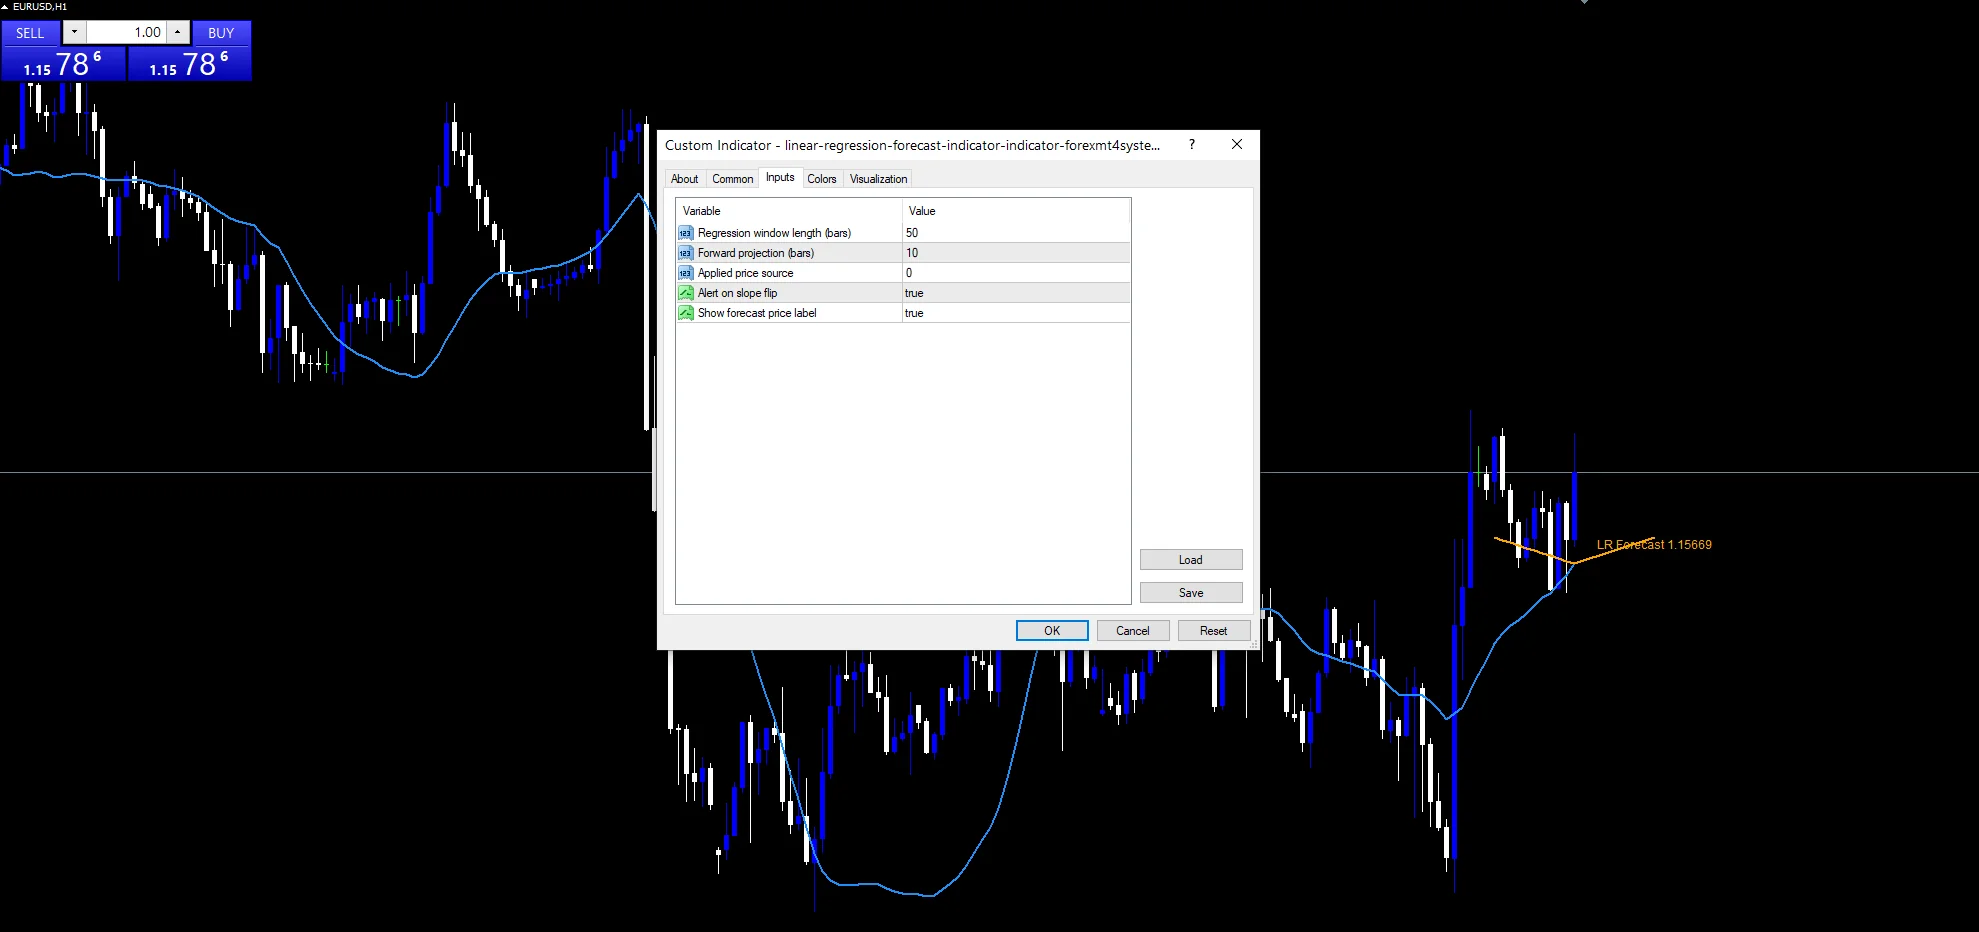
Every Linear Regression Forecast Indicator input
Core settings
| Setting | What it does | Default |
|---|---|---|
LRLength |
Regression window length (bars). Bars in the fit window, default `50`. | 50 |
ForecastBars |
Forward projection (bars). Bars the line extends past the last candle, default `10`. | 10 |
AppliedPrice |
Applied price source. Price series the fit reads, default PRICE_CLOSE. | PRICE_CLOSE |
Display settings
| Setting | What it does | Default |
|---|---|---|
ShowLabels |
Show forecast price label. Draws the forecast price label, default `true`. | on |
Alert settings
| Setting | What it does | Default |
|---|---|---|
AlertOnSlopeFlip |
Alert on slope flip. Popup when the slope changes sign, default `true`. | on |
Where to point it
A straight-line fit suits markets that move in reasonably straight legs. EURUSD H1 is the reference chart, where `LRLength` at `50` covers two days. On M5 the window spans four hours and the line reorients constantly. On H4 it describes a fortnight of structure.
What to be wary of
Extending a fit is not forecasting. The line only shows what the current slope implies.
The projection moves every bar, so yesterday’s forecast price is already gone.
A straight line averages both legs of a reversal and describes neither.
Copy the compiled Linear Regression Forecast Indicator file into your MQL4/Indicators folder, and the MT5 build into MQL5/Indicators, then restart the terminal and drag it onto a chart. The step-by-step guide with screenshots is at how to install MT4 and MT5 indicators.
Download the Linear Regression Forecast Indicator for MT4 and MT5
The zip holds the compiled Linear Regression Forecast Indicator build for MT4 and MT5, plus a short README. Compiled files only, no source. Enter your email below and the download link arrives in your inbox.
Download this indicator free
Enter your email and the file is yours. You also get the full MT4 and MT5 library.
FAQ
Is the LR Forecast line a prediction?
No, and the distinction matters. It evaluates the same straight line at bars that have not happened yet. If the slope changes, so does the whole projection. Treat it as a picture of the current fit, not a forecast.
What does ForecastBars at 10 extend?
The fitted line, ten bars past the last candle. On EURUSD H1 that is ten hours of empty chart with an orange line across it. Raising it looks impressive and adds no information whatsoever.
How does LRLength at 50 shape the slope?
It sets how much history the fit averages. Fifty bars smooths out short pushes and gives a steadier slope. Shorten it and the line follows recent price closely, which makes the projection swing around far more.
When does AlertOnSlopeFlip fire?
When the fitted slope changes sign on a closed bar. That is a meaningful event, because it means the straight line describing the window has stopped tilting one way. It also happens fairly often in a range.
Are results guaranteed?
No. Trading involves risk. Results are not guaranteed; past performance is not indicative of future results. Use the Linear Regression Forecast Indicator as one input. Always backtest before trading live.
Category: this is part of our Smart Money collection. Also, browse more Smart Money for MetaTrader, or explore every MT4 indicator and MT5 indicator on the site.
External references
- For background on this concept, see Linear Regression Forecast at StockCharts ChartSchool.
- For broader market context, see Global Industry Classification Standard on Wikipedia.

About the author
Written by Dominic Walsh, a Forex trader and MT4/MT5 indicator, Expert Advisor and script developer. Every tool on forexmt4systems.com is tested on live charts before release and ships with ready-to-use compiled MT4 (.ex4) and MT5 (.ex5) files. Learn more about the trader and developer behind this site.
How we build, test and correct every tool: Editorial & Testing Policy. Trading carries risk; see the disclaimer.