
A standard MACD already carries a signal line. The macd with ema indicator adds a third curve on top: a twenty-one bar average of the MACD line itself, slower than the nine-bar signal. Crossings of that gold curve, not the usual signal, earn a mark here.
This build ships as a compiled .ex4 for MT4 and .ex5 for MT5; the screenshots below come from EURUSD H1.
| Platforms | MT4 (.ex4) + MT5 (.ex5) |
|---|---|
| Chart window | Separate window (levels 0) |
| Plots | 5: MACD, Signal, EMA_of_MACD, Buy, Sell |
| Alerts | popup, push notification, email, sound |
| Inputs | 11 |
What the Macd With Ema Indicator draws on the chart
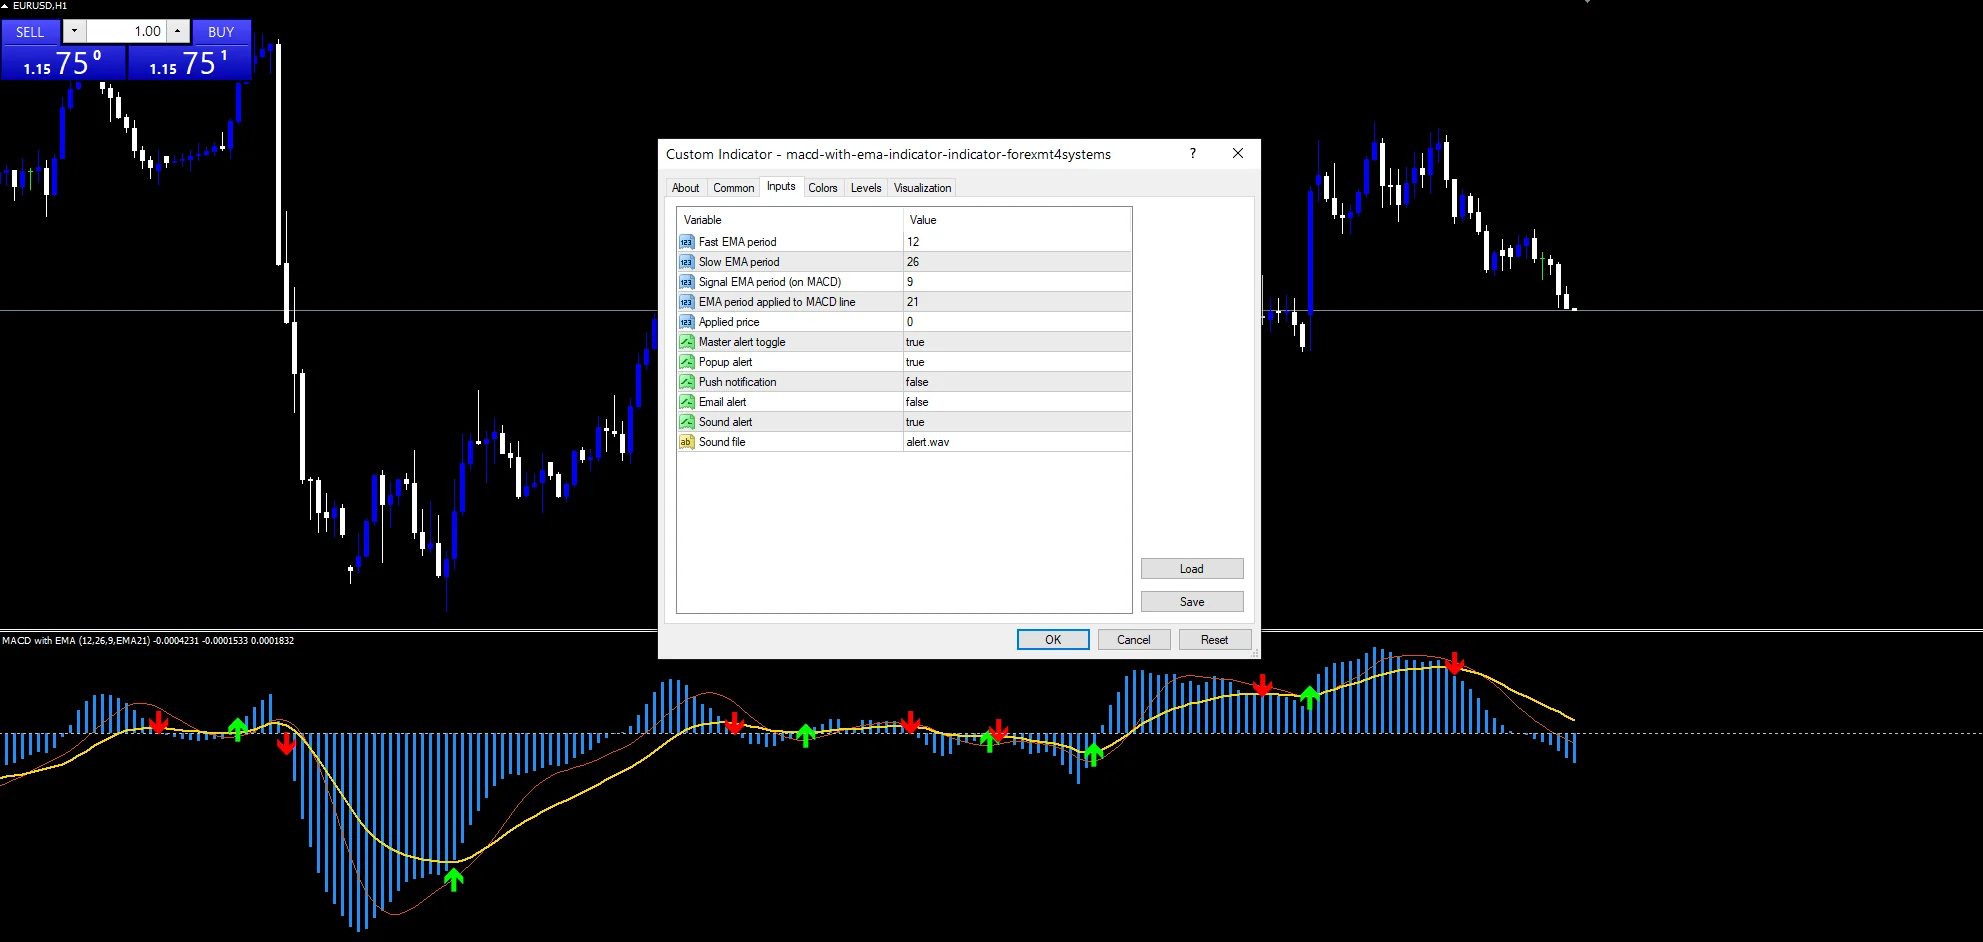
Three curves and two marks, all below price.
`MACD` fills dodger blue columns.
`Signal` traces orange red at width 1.
`EMA_of_MACD` traces gold at width 2.
`Buy` prints lime under the main line.
`Sell` prints red above it.
- MACD: histogram, dodger blue, width 2
- Signal: line, orange red, width 1
- EMA_of_MACD: line, gold, width 2
- Buy: arrow, lime, width 3, arrow code 233
- Sell: arrow, red, width 3, arrow code 234

What the code actually computes
The usual pair
iMACD supplies both. `InpFastEMA` `12`, `InpSlowEMA` `26` and `InpSignalSMA` `9` read `InpAppliedPrice` `PRICE_CLOSE`, which is entirely standard so far.
The third curve
Here is the addition. `InpEMAofMACD` `21` averages the main MACD line, seeded with a simple average so its first value is real rather than zero.
Which crossing counts
Only one pair matters. The main line against that gold curve. The nine-bar signal is drawn for context but takes no part in the marks.
Reading it on a live chart
Three curves means two possible crossings to watch.
Only the gold one produces marks.
Twenty-one bars is slower than the nine-bar signal.
That makes each mark rarer and later.
Columns still reach zero at a nine-bar crossing.
Mark spacing scales with the reading’s own size.
Alert channels in this build: popup, push notification, email and sound, one message per closed bar.
Messages here follow the gold curve rather than the nine-bar signal. `InpEnableAlerts` decides whether any go out, and it ships on with `InpEnablePopup` and `InpEnableSound`. `InpEnablePush` and `InpEnableEmail` stay dark until you want them.
Every Macd With Ema Indicator input
Core settings
| Setting | What it does | Default |
|---|---|---|
InpFastEMA |
Fast EMA period. Quicker leg of the calculation, `12`. | 12 |
InpSlowEMA |
Slow EMA period. Slower leg, `26`. | 26 |
InpSignalSMA |
Signal EMA period (on MACD). The nine-bar line drawn for context, `9`. | 9 |
InpEMAofMACD |
EMA period applied to MACD line. Smoothing applied to the main line itself, `21`. | 21 |
InpAppliedPrice |
Applied price. Which price all of it reads, `PRICE_CLOSE`. | PRICE_CLOSE |
Alert settings
| Setting | What it does | Default |
|---|---|---|
InpEnableAlerts |
Master alert toggle. Whether gold-curve messages go out, `true`. | on |
InpEnablePopup |
Popup alert. Shows one in a MetaTrader box, `true`. | on |
InpEnablePush |
Push notification. Sends one to your phone, `false`. | off |
InpEnableEmail |
Email alert. | off |
InpEnableSound |
Sound alert. Sounds one on the desktop, `true`. | on |
InpSoundFile |
Sound file. File the gold-curve sound plays, `”alert.wav”`. | alert.wav |
Where to point it
Averaging a lagging line makes this slow by design. EURUSD H1 is the reference chart, where marks come once or twice a week. Drop to M5 and they arrive daily. Move up to H4 and each one covers a fortnight.
Where this one struggles
Averaging a lagging line adds more lag on top.
Marks arrive well after the nine-bar signal crossed.
Three curves in one pane is a crowded read.
In a range the main line weaves around the gold curve.
Copy the compiled Macd With Ema Indicator file into your MQL4/Indicators folder, and the MT5 build into MQL5/Indicators, then restart the terminal and drag it onto a chart. The step-by-step guide with screenshots is at how to install MT4 and MT5 indicators.
Download the Macd With Ema Indicator for MT4 and MT5
The zip holds the compiled Macd With Ema Indicator build for MT4 and MT5, plus a short README. Compiled files only, no source. Enter your email below and the download link arrives in your inbox.
Download this indicator free
Enter your email and the file is yours. You also get the full MT4 and MT5 library.
FAQ
What does InpEMAofMACD 21 average?
The MACD line itself, not price. That gives a third curve slower than the nine-bar signal, and crossings against it are the events this build marks rather than the usual signal crossings.
Why keep the nine-bar Signal on the chart?
For context. It shows what a standard MACD would be doing, so you can see how much later the gold curve turns. It plays no part in the marks themselves.
Does InpAppliedPrice affect the gold curve?
Indirectly, yes. It feeds the MACD calculation, and the gold curve averages that output, so switching away from the close shifts all three curves rather than just the first two.
How does InpEMAofMACD avoid a spike at the left?
By seeding from a simple average rather than from zero. An exponential average started at zero draws a hard line up to its first genuine value, and seeding removes that artefact entirely.
Are results guaranteed?
No. Trading involves risk. Results are not guaranteed; past performance is not indicative of future results. Use the Macd With Ema Indicator as one input. Always backtest before trading live.
Category: this is part of our Oscillators collection. Browse more Oscillators for MetaTrader, or explore every MT4 indicator and MT5 indicator on the site.
External references
- Learn more about the underlying method in Market sector on Wikipedia.
- For wider market background, see High Low Index at StockCharts ChartSchool.

About the author
Written by Dominic Walsh, a Forex trader and MT4/MT5 indicator, Expert Advisor and script developer. Every tool on forexmt4systems.com is tested on live charts before release and ships with ready-to-use compiled MT4 (.ex4) and MT5 (.ex5) files. Learn more about the trader and developer behind this site.
How we build, test and correct every tool: Editorial & Testing Policy. Trading carries risk; see the disclaimer.