
The sc mtf williams percent range indicator puts two Williams readings in one pane. Fast %R runs at FastPeriod on the chart bars. HTF %R runs a longer lookback scaled from HigherTF, which approximates the slower horizon rather than reading those bars directly.
This build ships as a compiled .ex4 for MT4 and .ex5 for MT5.
| Platforms | MT4 (.ex4) + MT5 (.ex5) |
|---|---|
| Chart window | Separate window (levels -20 / -50 / -80) |
| Plots | 4: Fast %R, HTF %R, Buy, Sell |
| Alerts | popup, push notification, email, sound |
| Inputs | 10 |
Colours, widths and shapes
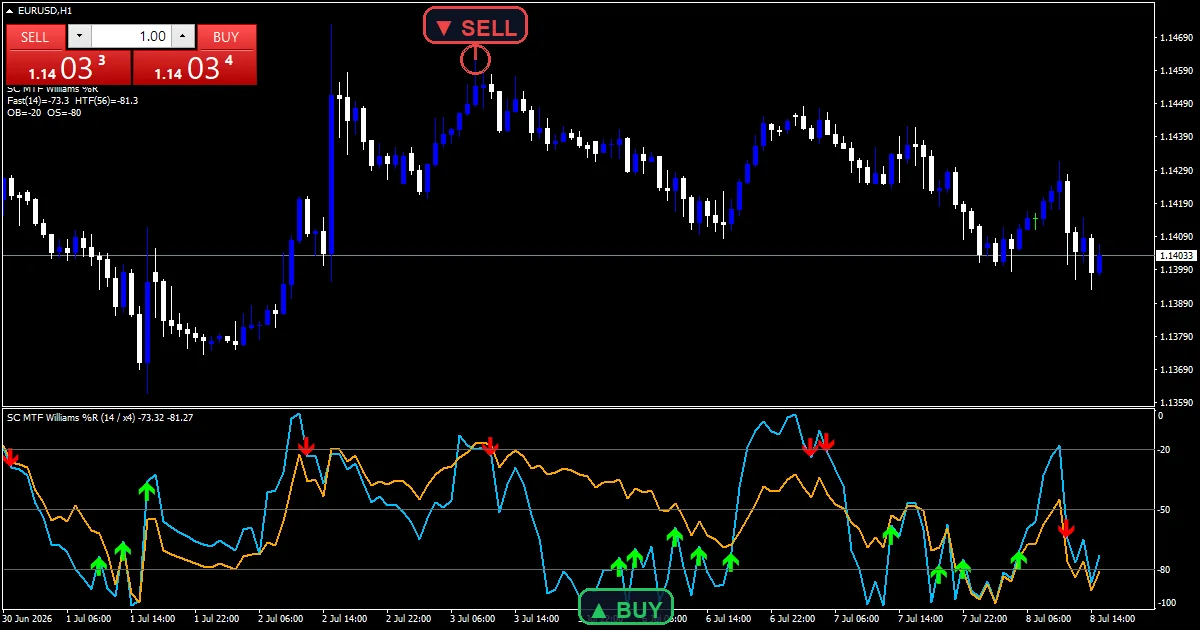
Fast %R is the quick reading over FastPeriod bars.
HTF %R is the slower horizon, drawn in the same pane on the same scale.
Buy sits just under the fast reading when it leaves the oversold zone.
Sell sits just above it on the overbought exit.
Levels cross the pane at -20.0, -50.0 and -80.0, matching Overbought, the midpoint and Oversold.
- Fast %R: line, deep sky blue, width 2
- HTF %R: line, orange, width 2
- Buy: arrow, lime, width 2, arrow code 233
- Sell: arrow, red, width 2, arrow code 234
How the calculation works
The Williams reading
For a given lookback the code finds the highest high and the lowest low, then places the close inside that range as a negative percentage.
So the scale runs from zero at the very top of the range to minus one hundred at the bottom, which is the convention this family uses.
How the slower horizon is built
HigherTF does not cause a read of those bars. The code converts it into a longer lookback and runs the same calculation on the chart series.
That approximates what a slower chart would show, on the same bars, so both lines stay aligned. It is worth knowing this is a scaled lookback rather than a genuine higher timeframe read.
The zone exits
An arrow needs the fast reading to have been beyond a boundary on the previous bar and back inside on this one.
Both markers sit four units from the fast line, so they travel with it inside the pane rather than sitting on the price chart.
What the output means
Both lines share one scale, so the gap between them is directly readable.
The fast line reaching a boundary while the slow one sits mid range is the disagreement worth noticing.
An arrow marks an exit from a zone rather than time spent inside it.
Because the slow line is a scaled lookback, it responds on the same bars as the fast one rather than stepping like a true higher timeframe reading.
Alert channels in this build: popup, push notification, email and sound, one message per closed bar.
Alerts cover popup, push, email and sound on each zone exit. A bar time check keeps it to one alert per closed bar.
Every Sc Mtf Williams Percent Range Indicator input
Core settings
| Setting | What it does | Default |
|---|---|---|
FastPeriod |
%R lookback on chart timeframe. FastPeriod is the quick lookback. It defaults to 14. | 14 |
HigherTF |
higher timeframe horizon. HigherTF sets how much longer the slow lookback runs, defaulting to the four hour period. It scales the lookback rather than reading that chart. | PERIOD_H4 |
Overbought |
overbought level. Overbought is the upper boundary at -20.0, since this scale runs negative. | -20.0 |
Oversold |
oversold level. Oversold is the lower boundary at -80.0. | -80.0 |
Alert settings
| Setting | What it does | Default |
|---|---|---|
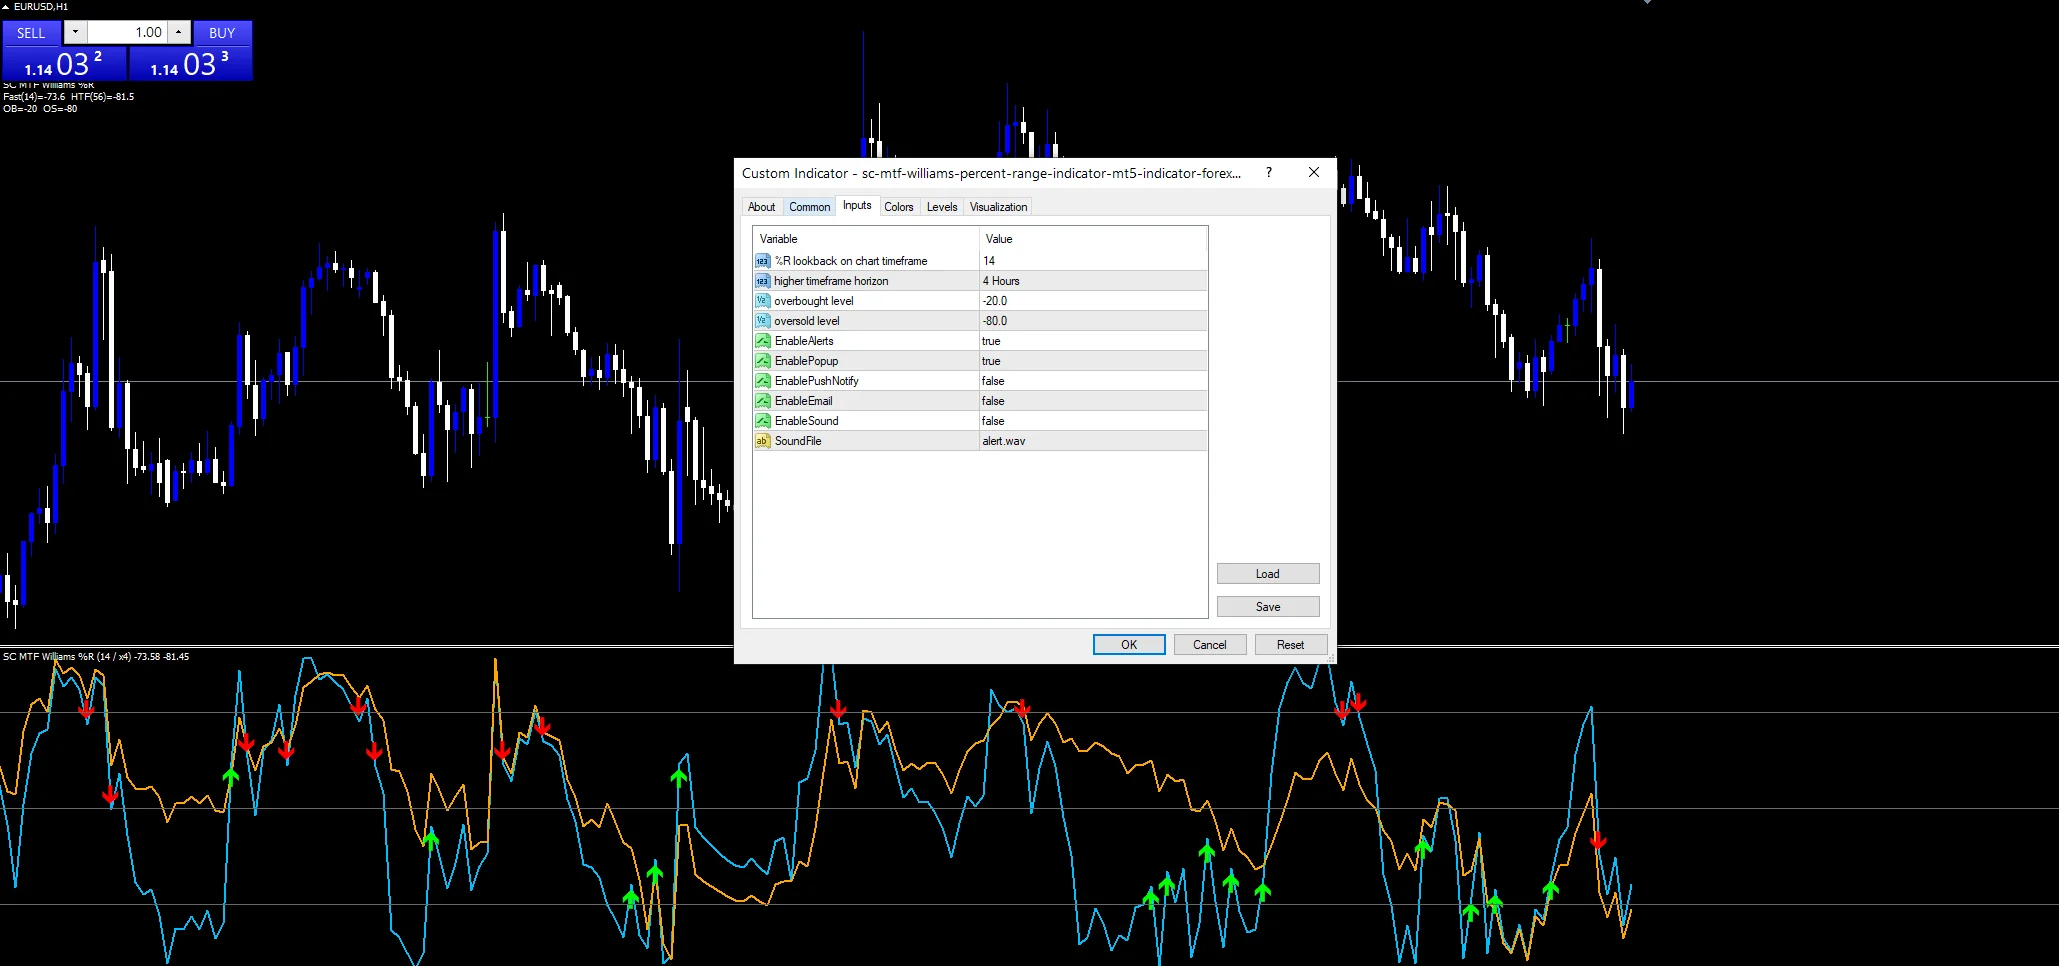
EnableAlerts |
(see inputs panel) | on |
EnablePopup |
(see inputs panel) | on |
EnablePushNotify |
(see inputs panel) | off |
EnableEmail |
(see inputs panel) | off |
EnableSound |
(see inputs panel) | off |
SoundFile |
(see inputs panel) | alert.wav |
Picking the right chart
This build ships with no recommended chart. Two horizons of one reading suit any liquid instrument where the fast line reaches its boundaries often enough to matter, which usually means M15 and above. On very fast charts both lines pin at the extremes and the gap between them stops being informative.
Where it breaks down
The slower line approximates a higher timeframe by lengthening the lookback, which is not the same as reading those bars. A genuine four hour reading would step at four hour boundaries; this one does not.
A trend pins both lines at one end for long runs, and every zone exit against that trend produces an arrow.
The reading measures position inside a range, so it says nothing about how wide that range is.
The scale runs negative throughout, which trips up anyone used to a nought to one hundred oscillator.
Copy the compiled Sc Mtf Williams Percent Range Indicator file into your MQL4/Indicators folder, and the MT5 build into MQL5/Indicators, then restart the terminal and drag it onto a chart. The step-by-step guide with screenshots is at how to install MT4 and MT5 indicators.
Related on forexmt4systems.com: Range Trading Strategy.
Background reading on the method behind the Sc Mtf Williams Percent Range Indicator: Williams %R on Wikipedia, Williams R at StockCharts ChartSchool.
Download the Sc Mtf Williams Percent Range Indicator for MT4 and MT5
The zip holds the compiled Sc Mtf Williams Percent Range Indicator build for MT4 and MT5, plus a short README. Compiled files only, no source. Enter your email below and the download link arrives in your inbox.
Download this indicator free
Enter your email and the file is yours. You also get the full MT4 and MT5 library.
FAQ
Does HigherTF actually read four hour bars?
No, and this is worth being clear about. It converts the setting into a longer lookback and runs the same calculation on your chart bars. That approximates the slower horizon and keeps both lines aligned, but a genuine four hour reading would step at four hour boundaries and this one does not.
Why do Overbought and Oversold have negative values?
Because this family scales from zero down to minus one hundred. Zero means the close sat at the very top of its lookback range and minus one hundred means the bottom. So -20.0 is the upper boundary and -80.0 the lower, which reads backwards until you get used to it.
What makes an arrow print rather than just a reading past the level?
The exit. The fast line has to have been beyond the boundary on the previous bar and back inside on this one. Sitting past -80.0 for twenty bars produces nothing; coming back through it produces one marker.
Why do both markers sit only four units from Fast %R?
Because they live inside the pane rather than on the price chart, and the scale runs across a hundred units. Four is enough to clear the line without pushing a marker into the level lines around it. The spacing never affects when a marker fires.
Are results guaranteed?
No. Trading involves risk. Results are not guaranteed; past performance is not indicative of future results. Use the Sc Mtf Williams Percent Range Indicator as one input. Always backtest before trading live.
Category: this is part of our Oscillators collection. Browse more Oscillators for MetaTrader, or explore every MT4 indicator and MT5 indicator on the site.
External references
- For background on this concept, see Williams %R on Wikipedia.
- For broader market context, see Williams R at StockCharts ChartSchool.

About the author
Written by Dominic Walsh, a Forex trader and MT4/MT5 indicator, Expert Advisor and script developer. Every tool on forexmt4systems.com is tested on live charts before release and ships with ready-to-use compiled MT4 (.ex4) and MT5 (.ex5) files. Learn more about the trader and developer behind this site.
How we build, test and correct every tool: Editorial & Testing Policy. Trading carries risk; see the disclaimer.