
George Lane asked where a close sits inside its recent range. The stochastic indicator answers that with two lines, and it adds one condition worth knowing. A crossing only earns a mark when the signal line already sits near an extreme, so crossings mid-scale print nothing.
This build ships as a compiled .ex4 for MT4 and .ex5 for MT5; the screenshots below come from EURUSD H1.
| Platforms | MT4 (.ex4) + MT5 (.ex5) |
|---|---|
| Chart window | Separate window (levels 20 / 50 / 80) |
| Plots | 4: %K, %D, Buy, Sell |
| Alerts | popup, push notification, email, sound |
| Inputs | 13 |
Everything the Stochastic Indicator draws
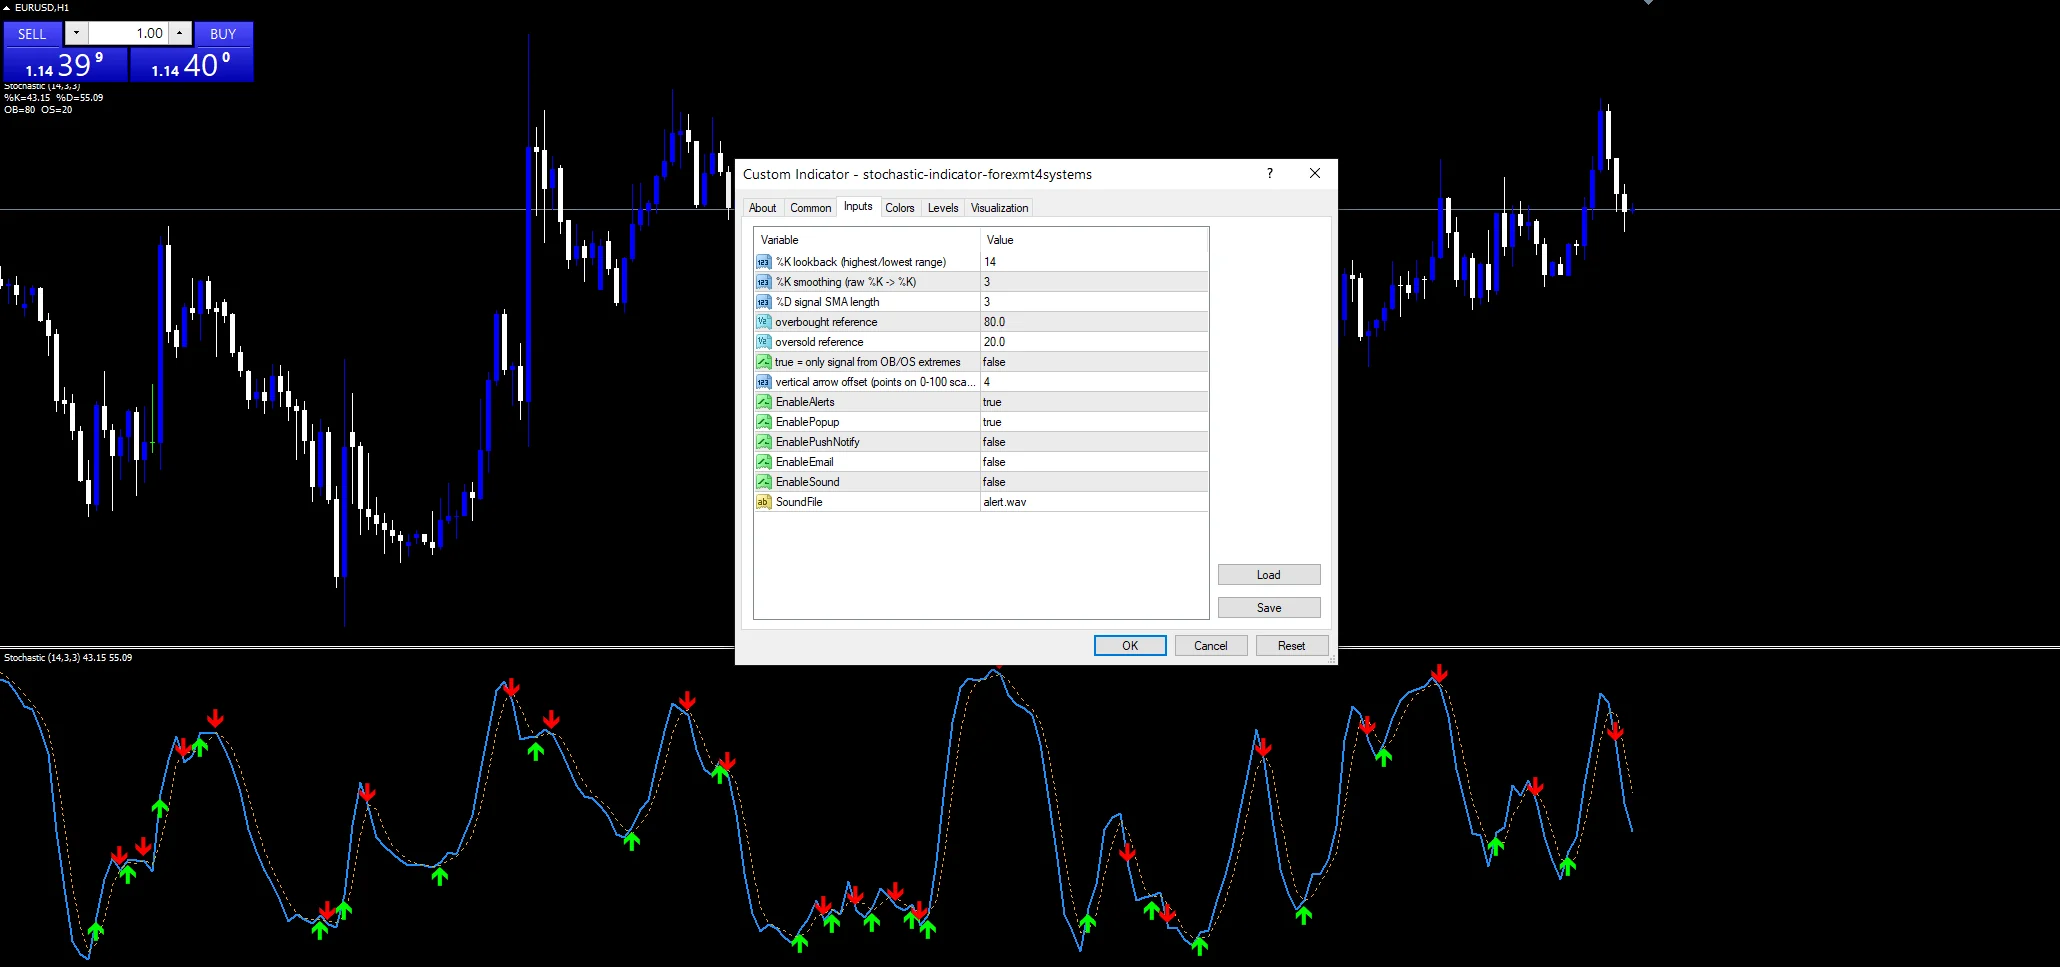
Two lines and two marks below price.
`%K` runs dodger blue at width 2.
`%D` runs orange at width 1.
A lime `Buy` mark sits under the crossing.
A red `Sell` mark sits above one.
Levels sit at twenty, fifty and eighty.
- %K: line, dodger blue, width 2
- %D: line, orange, width 1
- Buy: arrow, lime, arrow code 233
- Sell: arrow, red, arrow code 234

The arithmetic
Where the close sits
One window, two prices. `KPeriod` `14` bars give the highest high and lowest low. The close measured inside that span becomes the raw reading.
Two smoothing passes
Raw is too jumpy to use. `Slowing` `3` averages it into the first line. `DPeriod` `3` averages that again into the second.
The zone condition
A crossing is not enough on its own. For a buy the signal line must sit under `OverSold` `20.0` plus ten. The sell test mirrors it near `OverBought` `80.0`.
Making it useful
The scale runs zero to one hundred and never leaves it.
Above eighty says closes are near the top of the range.
Below twenty says the opposite.
Fifty is the middle of the recent range.
A crossing mid-scale prints nothing by design.
`ArrowsOnlyInZone` tightens that further when true.
Alert channels in this build: popup, push notification, email and sound, one message per closed bar.
`EnableAlerts` covers the crossing alerts and starts true with `EnablePopup`. Set `EnablePushNotify` for a phone, `EnableEmail` for mail, or `EnableSound` to sound `SoundFile`. Those three begin off and crossings report once a bar.
Every Stochastic Indicator input
Core settings
| Setting | What it does | Default |
|---|---|---|
KPeriod |
%K lookback (highest/lowest range). Bars in the range window, `14`. | 14 |
Slowing |
%K smoothing (raw %K -> %K). First smoothing pass, `3`. | 3 |
DPeriod |
%D signal SMA length. Second smoothing pass, `3`. | 3 |
OverBought |
overbought reference. Upper reference, `80.0`. | 80.0 |
OverSold |
oversold reference. Lower reference, `20.0`. | 20.0 |
Display settings
| Setting | What it does | Default |
|---|---|---|
ArrowsOnlyInZone |
true = only signal from OB/OS extremes. Demand a true extreme, `false`. | off |
ArrowGap |
vertical arrow offset (points on 0-100 scale). Mark offset on the scale, `4`. | 4 |
Alert settings
| Setting | What it does | Default |
|---|---|---|
EnableAlerts |
Master switch, `true`. | on |
EnablePopup |
(see inputs panel) | on |
EnablePushNotify |
(see inputs panel) | off |
EnableEmail |
Mail on a crossing, `false`. | off |
EnableSound |
(see inputs panel) | off |
SoundFile |
Which clip plays, `”alert.wav”`. | alert.wav |
Symbols and timeframes
Fourteen bars with two smoothing passes is the classic arrangement. EURUSD H1 is the reference chart. Zone crossings there are worth a look each time. On M5 the reading crosses the scale all session. On daily bars each one is rare.
Where it falls down
A bounded reading pins at an extreme through a trend.
Two smoothing passes put the lines behind price.
One outsized bar sets the range for fourteen bars.
Near an extreme is not the same as at one.
Copy the compiled Stochastic Indicator file into your MQL4/Indicators folder, and the MT5 build into MQL5/Indicators, then restart the terminal and drag it onto a chart. The step-by-step guide with screenshots is at how to install MT4 and MT5 indicators.
Background reading on the method behind the Stochastic Indicator: Stochastic oscillator on Wikipedia, Stochastic Oscillator at Investopedia.
Download the Stochastic Indicator for MT4 and MT5
The zip holds the compiled Stochastic Indicator build for MT4 and MT5, plus a short README. Compiled files only, no source. Enter your email below and the download link arrives in your inbox.
Download this indicator free
Enter your email and the file is yours. You also get the full MT4 and MT5 library.
FAQ
Why must %D be near an extreme for a mark?
Because the two lines cross constantly in the middle of the scale. Requiring the signal line to sit within ten of an extreme removes most of those and leaves the crossings that follow a stretched move.
What does ArrowsOnlyInZone true change?
It tightens the test from near an extreme to inside one. With it on, a crossing at twenty-five no longer counts, so you get fewer marks and each one follows a genuinely stretched reading.
How do Slowing and DPeriod differ?
Both average, but at different stages. `Slowing` `3` smooths the raw reading into the blue line, and `DPeriod` `3` averages that result again into the orange signal line drawn over it.
Does KPeriod 14 call the terminal indicator?
No. The highest high, the lowest low and both smoothing passes all run inside this source, which means the whole reading can be checked line by line rather than trusted.
Are results guaranteed?
No. Trading involves risk. Results are not guaranteed; past performance is not indicative of future results. Use the Stochastic Indicator as one input. Always backtest before trading live.
Category: this is part of our Oscillators collection. Browse more Oscillators for MetaTrader, or explore every MT4 indicator and MT5 indicator on the site.
External references
- The core method is documented in Total shareholder return on Wikipedia.
- Additional market context is at Morningstar at Investopedia.

About the author
Written by Dominic Walsh, a Forex trader and MT4/MT5 indicator, Expert Advisor and script developer. Every tool on forexmt4systems.com is tested on live charts before release and ships with ready-to-use compiled MT4 (.ex4) and MT5 (.ex5) files. Learn more about the trader and developer behind this site.
How we build, test and correct every tool: Editorial & Testing Policy. Trading carries risk; see the disclaimer.