
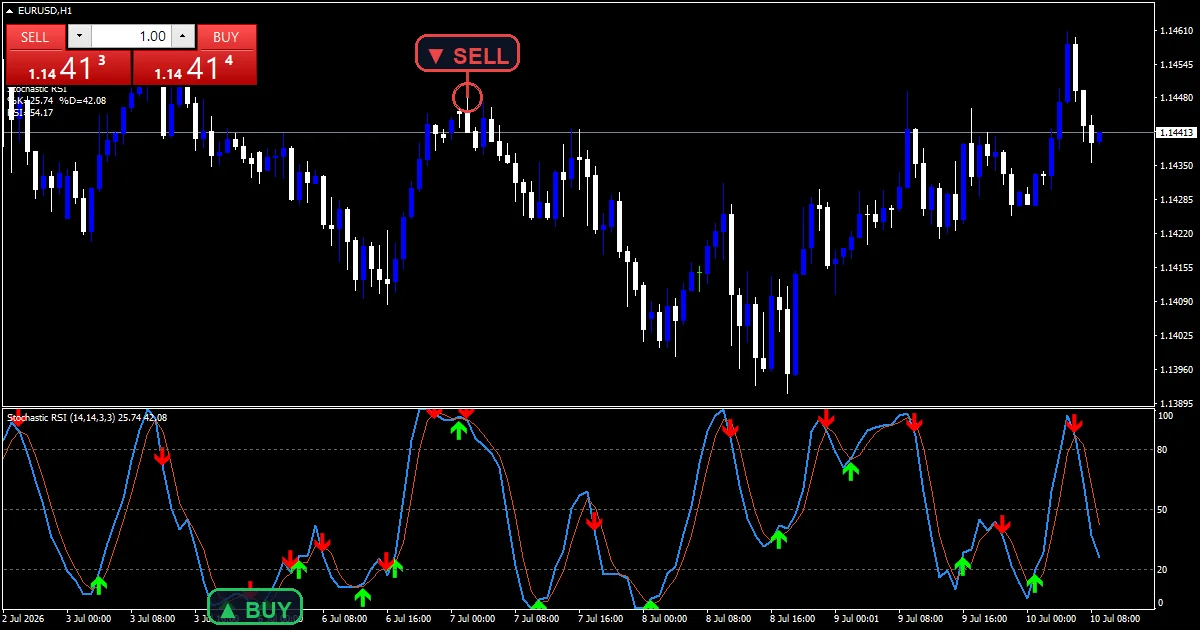
The stochastic rsi indicator applies a stochastic calculation to RSI values instead of to price. That makes it move faster and reach its boundaries more often than either component alone. %K and %D run in a pane with levels at 20, 50 and 80, and arrows mark the crossings.
This build ships as a compiled .ex4 for MT4 and .ex5 for MT5; the screenshots below come from EURUSD H1.
| Platforms | MT4 (.ex4) + MT5 (.ex5) |
|---|---|
| Chart window | Separate window (levels 20 / 50 / 80) |
| Plots | 4: %K, %D, Buy, Sell |
| Alerts | popup, push notification, email, sound |
| Inputs | 13 |
What each plot looks like
%K (blue) is the raw stochastic of the RSI series, smoothed over SmoothK bars.
%D (orange red) averages %K again over SmoothD.
Buy (lime, code 233) and Sell (red, code 234) mark the crossings between those two lines.
Levels cross the pane at 20, 50 and 80, matching LevelOS and LevelOB with a midline between them.
- %K: line, dodger blue, width 2
- %D: line, orange red, width 1
- Buy: arrow, lime, width 2, arrow code 233
- Sell: arrow, red, width 2, arrow code 234
How the plots get their values
Step one, a Wilder RSI
The chain starts with an RSI of the closes over RsiPeriod. Gains and losses get separated and smoothed the Wilder way before the reading emerges.
That series never reaches a plot. It exists purely as the input to the next step.
Step two, a stochastic of those values
Across StochPeriod bars the code finds the highest and lowest RSI values, then works out where the current reading sits inside that range as a percentage.
When the range comes out at zero, meaning RSI has not moved at all across the window, the result falls back to 50 rather than dividing by nothing.
Step three, two rounds of smoothing
The raw result gets averaged over SmoothK to give the %K line, and %K gets averaged again over SmoothD to give %D. Both default to 3.
CooldownBars then spaces the arrows apart, so a run of crossings within a couple of bars does not fill the pane with markers.
What it is telling you
%K crossing %D below LevelOS is the classic long side reading for this family.
Because it measures RSI inside its own range, this reaches 0 and 100 far more often than a plain reading does.
A value pinned at an extreme means RSI has been at the top or bottom of its recent range, not that price is extreme.
The 50 line is drawn for reference. No rule in the code uses it.
Alert channels in this build: popup, push notification, email and sound, one message per closed bar.
Alerts cover popup, push, email and sound on each crossing. A bar time check keeps it to one alert per closed bar, and CooldownBars spaces repeats further apart.
Every Stochastic RSI Indicator input
Core settings
| Setting | What it does | Default |
|---|---|---|
RsiPeriod |
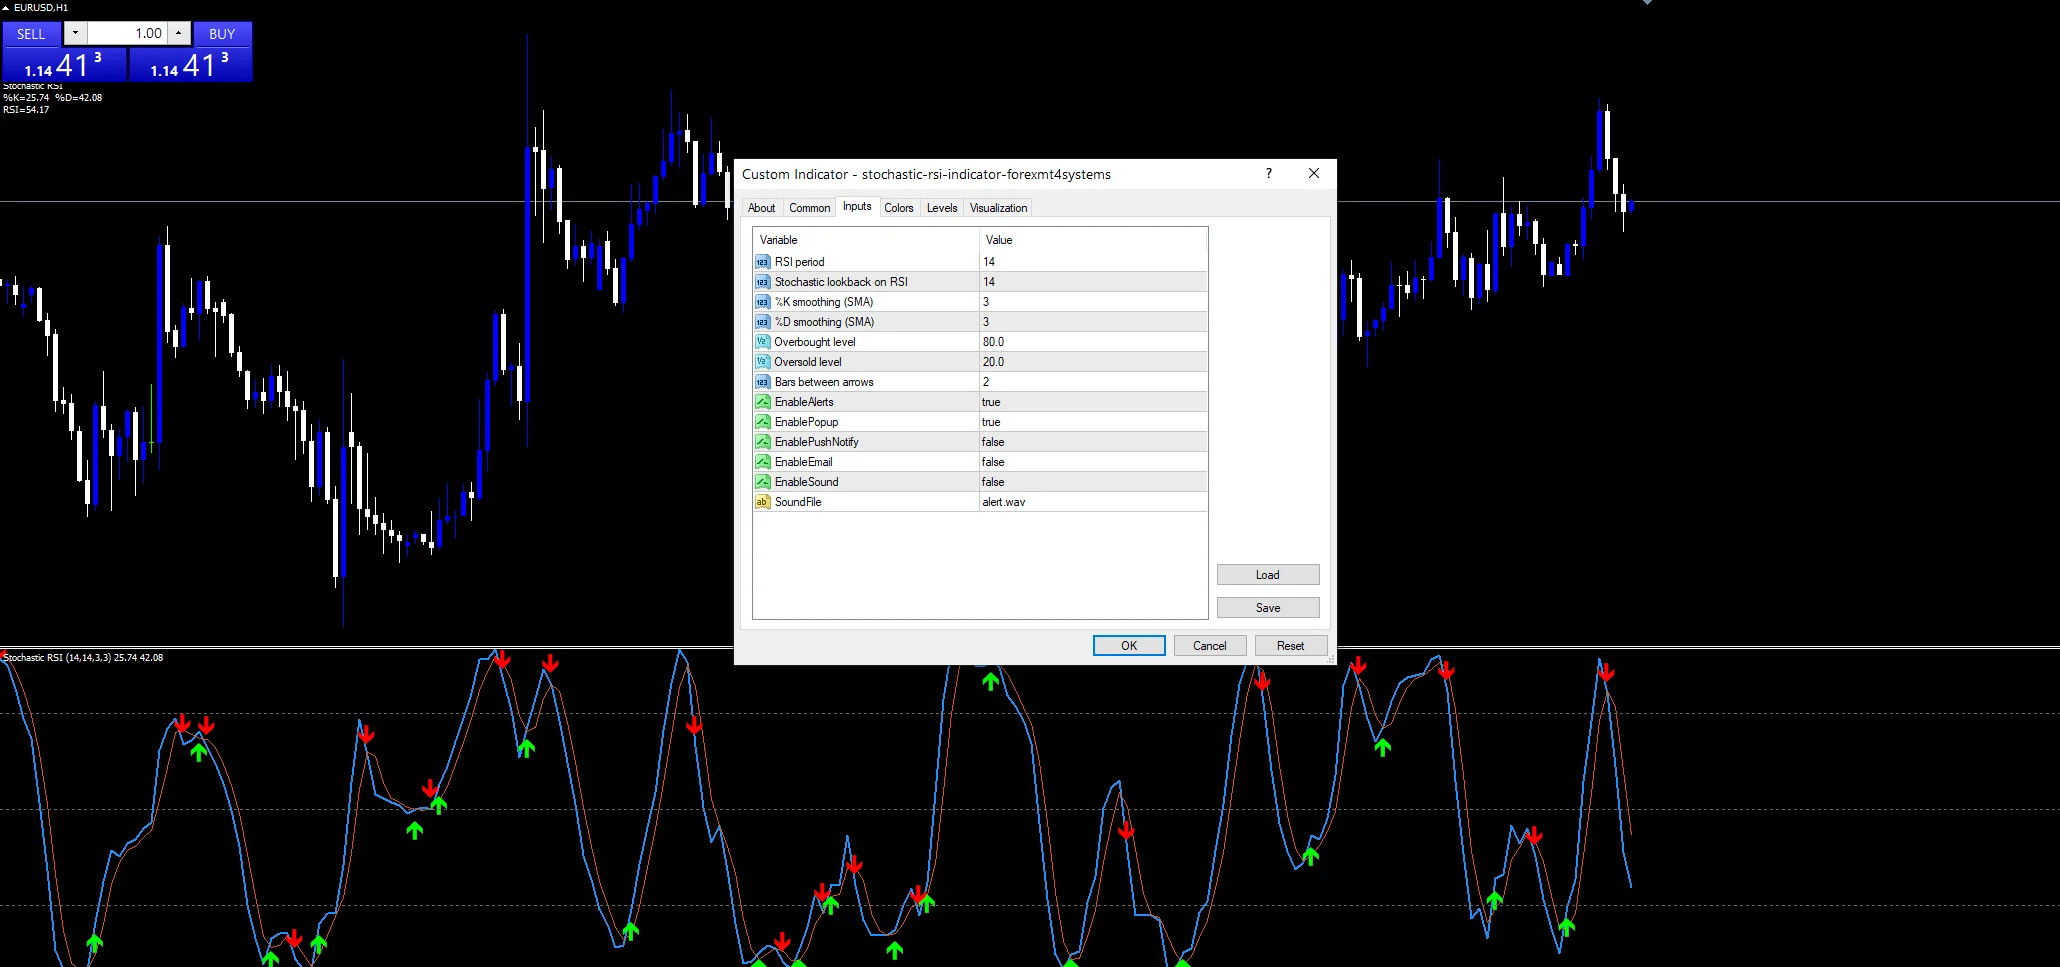
RSI period. RsiPeriod is the lookback for the underlying RSI. It defaults to 14. | 14 |
StochPeriod |
Stochastic lookback on RSI. StochPeriod is how many RSI values the high and low range covers, also 14. | 14 |
SmoothK |
%K smoothing (SMA). SmoothK averages the raw result into the %K line, 3 by default. | 3 |
SmoothD |
%D smoothing (SMA). SmoothD averages %K into %D, also 3. Raising it slows every crossing down. | 3 |
LevelOB |
Overbought level. LevelOB is the upper boundary at 80.0. | 80.0 |
LevelOS |
Oversold level. LevelOS is the lower boundary at 20.0. | 20.0 |
CooldownBars |
Bars between arrows. CooldownBars is the minimum gap between arrows, 2 by default. | 2 |
Alert settings
| Setting | What it does | Default |
|---|---|---|
EnableAlerts |
(see inputs panel) | on |
EnablePopup |
(see inputs panel) | on |
EnablePushNotify |
(see inputs panel) | off |
EnableEmail |
(see inputs panel) | off |
EnableSound |
(see inputs panel) | off |
SoundFile |
(see inputs panel) | alert.wav |
Timeframes worth trying
The screenshot uses EURUSD H1. This reading suits charts that swing rather than grind, because it needs RSI itself to travel across a range. H1 and H4 give crossings that last long enough to act on. On M5 the double smoothing is not enough to stop the lines whipping across the pane.
When the Stochastic RSI Indicator fails
Two layers of derivation put this two steps away from price. A crossing describes what RSI did inside its own range, which is a long way from what price did.
It hits the boundaries constantly, so treating every extreme as meaningful buries you in signals.
When RSI stays flat across the whole window the range collapses and the result is forced to 50, which looks like a real value but is a fallback.
The 20 and 80 boundaries are inherited from the plain stochastic. Nothing about this chain makes them the right levels here.
Copy the compiled Stochastic RSI Indicator file into your MQL4/Indicators folder, and the MT5 build into MQL5/Indicators, then restart the terminal and drag it onto a chart. The step-by-step guide with screenshots is at how to install MT4 and MT5 indicators.
Download the Stochastic RSI Indicator for MT4 and MT5
The zip holds the compiled Stochastic RSI Indicator build for MT4 and MT5, plus a short README. Compiled files only, no source. Enter your email below and the download link arrives in your inbox.
Download this indicator free
Enter your email and the file is yours. You also get the full MT4 and MT5 library.
FAQ
Why does this reach 0 and 100 more often than plain RSI?
Because it measures RSI against its own recent range rather than a fixed scale. Whenever the current reading is the highest of the last StochPeriod values, the result is 100 by definition, even if RSI itself only reached 60. These extremes are relative, not absolute.
What happens when RSI does not move across StochPeriod?
The high and low of the window become the same number, so the range is zero. Rather than divide by nothing, the code returns 50. A flat stretch in the middle of the pane can therefore be a genuine value or that fallback, and the two look identical.
Does CooldownBars stop the lines crossing or just the arrows?
Just the arrows. %K and %D keep crossing as often as the maths dictates. CooldownBars, 2 by default, only suppresses a marker that would print within that many bars of the previous one, so the pane stays readable in fast conditions.
Is RsiPeriod or StochPeriod more useful to change?
StochPeriod usually. It sets the range the reading gets measured against, so widening it makes extremes rarer and more meaningful. RsiPeriod changes the underlying series itself, which shifts everything downstream and is harder to reason about.
Are results guaranteed?
No. Trading involves risk. Results are not guaranteed; past performance is not indicative of future results. Use the Stochastic RSI Indicator as one input. Always backtest before trading live.
Category: this is part of our Oscillators collection. Browse more Oscillators for MetaTrader, or explore every MT4 indicator and MT5 indicator on the site.
External references
- The core method is documented in Uptick rule on Wikipedia.
- Additional market context is at Shootingstar at Investopedia.

About the author
Written by Dominic Walsh, a Forex trader and MT4/MT5 indicator, Expert Advisor and script developer. Every tool on forexmt4systems.com is tested on live charts before release and ships with ready-to-use compiled MT4 (.ex4) and MT5 (.ex5) files. Learn more about the trader and developer behind this site.
How we build, test and correct every tool: Editorial & Testing Policy. Trading carries risk; see the disclaimer.