
The Relative Vigor Index compares where bars close with how far they range. Running a stochastic over it shows where that vigour sits within its own recent span. The stochastic RVI indicator computes a 10-bar RVI, places it within its 14-bar range, smooths %K and %D, and marks their crosses.
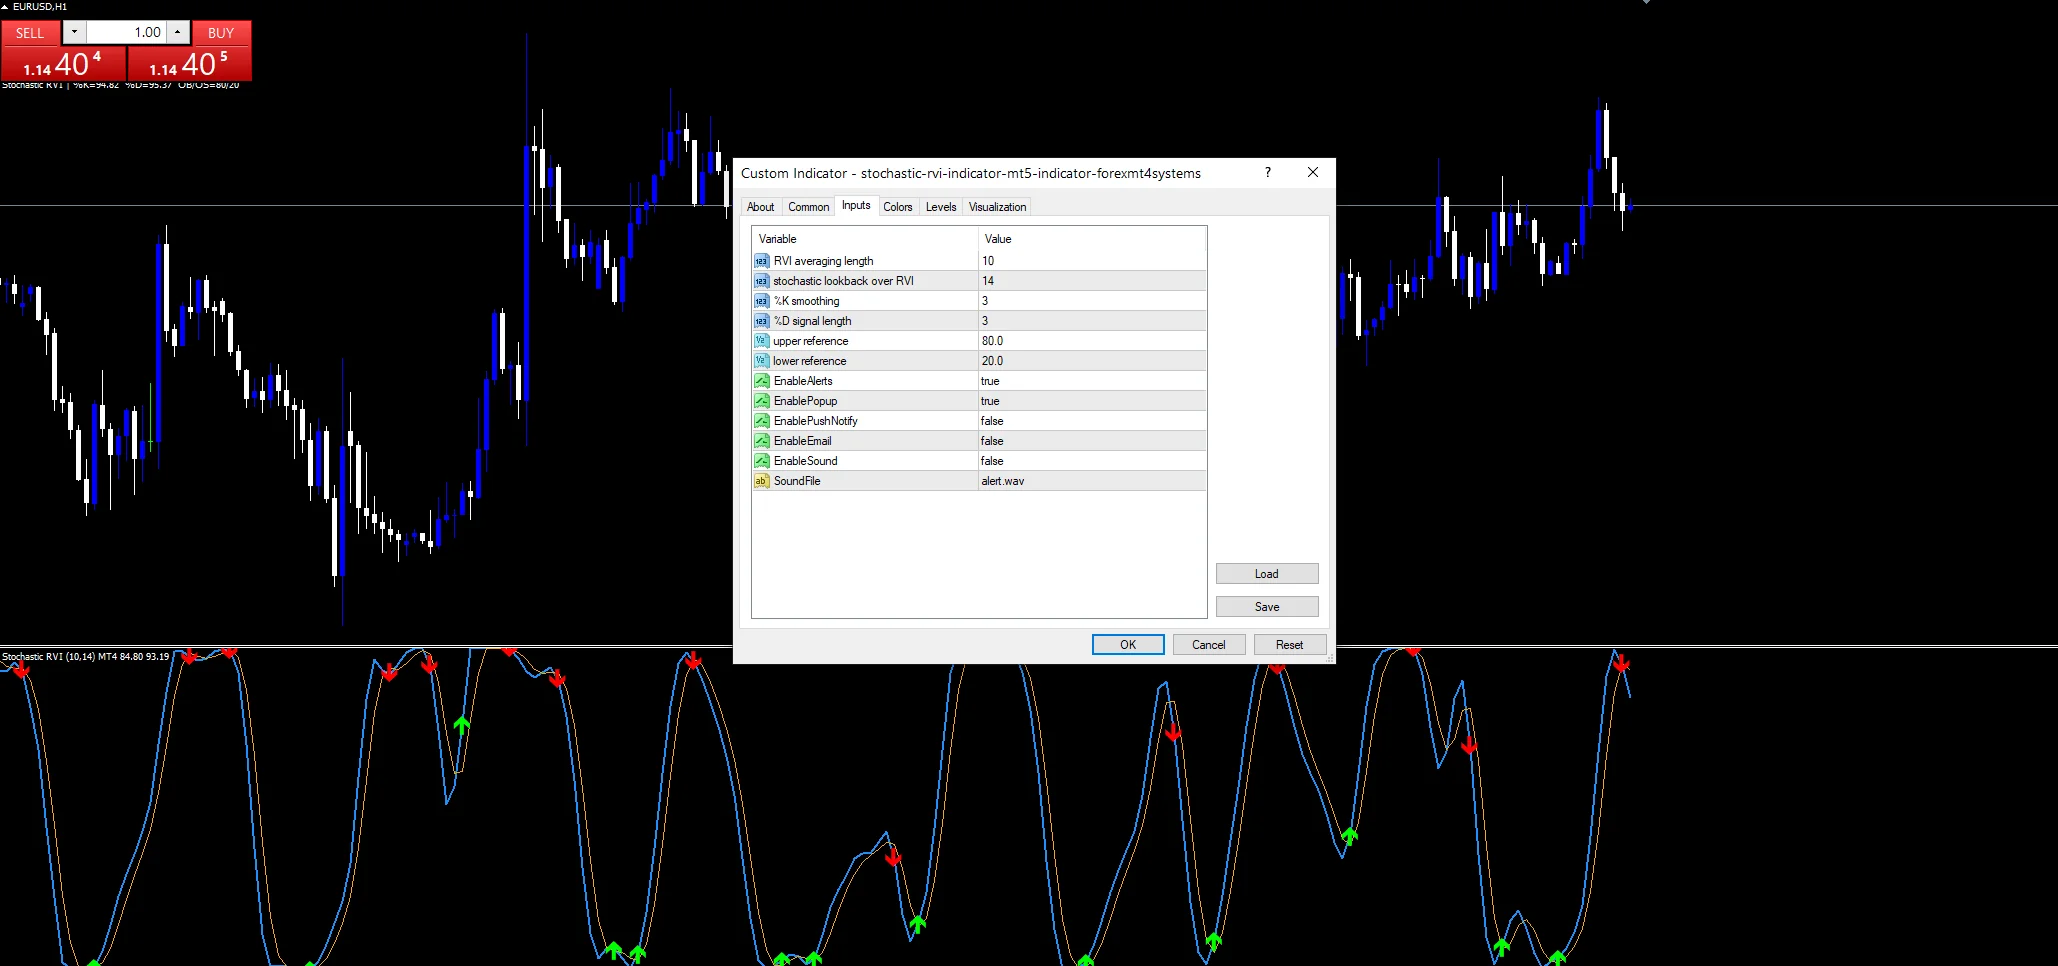
This build ships as a compiled .ex4 for MT4 and .ex5 for MT5; the screenshots below come from EURUSD H1.
| Platforms | MT4 (.ex4) + MT5 (.ex5) |
|---|---|
| Chart window | Separate window (levels 20 / 50 / 80) |
| Plots | 4: %K, %D, Buy, Sell |
| Alerts | popup, push notification, email, sound |
| Inputs | 12 |
Chart elements
Two lines and two marks in a pane.
`%K` runs dodger blue at width 2.
`%D` runs orange.
Buy marks ride the %K line in lime.
`Sell` sits on %K in red.
Dotted guides mark 20, 50 and 80.
- %K: line, dodger blue, width 2
- %D: line, orange, width 1
- Buy: arrow, lime, arrow code 233
- Sell: arrow, red, arrow code 234

The build in stages
RVI
`RVIPeriod` `10` averages close-minus-open against high-minus-low, with symmetric weights over four bars.
Stochastic
`StochPeriod` `14` finds the RVI’s high and low. `Slowing` `3` smooths %K, and `DPeriod` `3` averages %K into %D.
Crosses
A cross of %K above %D prints a buy while %K is under `OverBought` `80.0`. A cross below prints a sell while %K is above `OverSold` `20.0`.
How to read it
High readings mean strong closing vigour.
Low readings mean weak closes.
Crosses deep at the far extreme are skipped.
Lines swing fully several times a day.
Marks sit on the %K line.
Warm-up needs about thirty bars.
Alert channels in this build: popup, push notification, email and sound, one message per closed bar.
Crosses of %K and %D report once per closed bar under `EnableAlerts`; popups are the only route at the start.
Every Stochastic Rvi Indicator input
Core settings
| Setting | What it does | Default |
|---|---|---|
RVIPeriod |
RVI averaging length. RVI averaging length, `10`. | 10 |
StochPeriod |
stochastic lookback over RVI. Stochastic window over RVI, `14`. | 14 |
Slowing |
%K smoothing. %K smoothing, `3`. | 3 |
DPeriod |
%D signal length. %D length, `3`. | 3 |
OverBought |
upper reference. Upper reference, `80.0`. | 80.0 |
OverSold |
lower reference. Lower reference, `20.0`. | 20.0 |
Alert settings
| Setting | What it does | Default |
|---|---|---|
EnableAlerts |
Master alert switch, `true`. | on |
EnablePopup |
Popup, `true`. | on |
EnablePushNotify |
Phone route, `false`. | off |
EnableEmail |
(see inputs panel) | off |
EnableSound |
Speaker, `false`. | off |
SoundFile |
(see inputs panel) | alert.wav |
Which chart to load it on
A stochastic of RVI swings quickly on any chart. The hourly EURUSD screenshot shows marks most days. On M15 crosses come constantly. On D1 each cross marks a pullback.
What it misses
Crosses come very often.
RVI can flip on a single bar.
Levels block only the most extreme crosses.
Only the popup is on until you change it.
Copy the compiled Stochastic Rvi Indicator file into your MQL4/Indicators folder, and the MT5 build into MQL5/Indicators, then restart the terminal and drag it onto a chart. The step-by-step guide with screenshots is at how to install MT4 and MT5 indicators.
Download the Stochastic Rvi Indicator for MT4 and MT5
The zip holds the compiled Stochastic Rvi Indicator build for MT4 and MT5, plus a short README. Compiled files only, no source. Enter your email below and the download link arrives in your inbox.
Download this indicator free
Enter your email and the file is yours. You also get the full MT4 and MT5 library.
FAQ
What does RVIPeriod 10 measure?
How strongly bars close toward their highs or lows, relative to their full range, averaged over ten bars. Closes near the high give a high RVI.
Why block a Buy when %K is above OverBought 80.0?
A buy cross that high comes when vigour is already stretched. Skipping it keeps buy marks to crosses with room left to rise, which removes some of the weakest signals.
How is Stochastic RVI different from Stoch RSI?
Both run a stochastic over another oscillator. RSI measures closing gains and losses, while RVI measures where each bar closes within its own range, so the two react to different things.
What does Slowing 3 add to %K?
A three-bar average of the raw stochastic value. It removes single-bar jumps so the %K line, and the crosses it makes with %D, are easier to read.
Are results guaranteed?
No. Trading involves risk. Results are not guaranteed; past performance is not indicative of future results. Use the Stochastic Rvi Indicator as one input. Always backtest before trading live.
Category: this is part of our Oscillators collection. Browse more Oscillators for MetaTrader, or explore every MT4 indicator and MT5 indicator on the site.
External references
- The core method is documented in Voting interest on Wikipedia.
- Additional market context is at Triangle at Investopedia.

About the author
Written by Dominic Walsh, a Forex trader and MT4/MT5 indicator, Expert Advisor and script developer. Every tool on forexmt4systems.com is tested on live charts before release and ships with ready-to-use compiled MT4 (.ex4) and MT5 (.ex5) files. Learn more about the trader and developer behind this site.
How we build, test and correct every tool: Editorial & Testing Policy. Trading carries risk; see the disclaimer.