
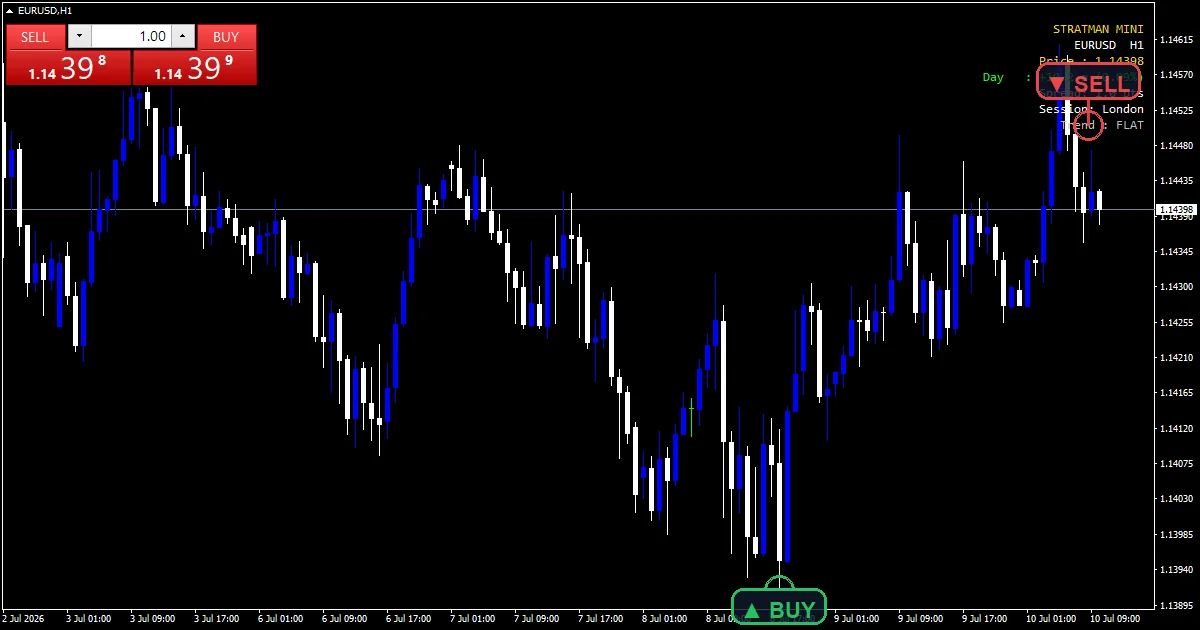
The stratman mini chart indicator is a readout rather than a drawing tool. It writes a small panel in the corner showing which way a short average is sloping and how far price has moved since the day opened. Nothing appears on the price scale at all.
This build ships as a compiled .ex4 for MT4 and .ex5 for MT5; the screenshots below come from EURUSD H1.
| Platforms | MT4 (.ex4) + MT5 (.ex5) |
|---|---|
| Chart window | Main price chart |
| Plots | 1: Stratman Hidden |
| Alerts | popup, push notification, email, sound |
| Inputs | 18 |
What each plot looks like
Label objects form the panel, positioned by InpCornerCode with pixel offsets.
Stratman Hidden is a buffer holding the close, which exists so the tool has a data series and never draws visibly.
The slope reading takes InpUpColor, InpDownColor or InpFlatColor depending on which state it lands in.
- Stratman Hidden: hidden buffer, clr_none
How the Stratman Mini Chart Indicator reaches a value
The slope in pips
An average at InpEmaPeriod gets read on the current bar and the one before, and the difference is divided by the pip size for the symbol.
The code works that pip size out itself, treating three and five digit symbols as fractional pricing. So the reading comes out in pips rather than in raw points.
The flat band
InpFlatPipsThresh decides how small a slope counts as flat, one pip by default.
Without that band the reading would flick between up and down on almost every bar, since an average is rarely perfectly level.
Today against the daily open
The panel also reads the daily open directly and compares the current price against it, both as a distance and as a percentage.
That reads the daily series rather than the chart, so the figure stays the same whichever timeframe you have open.
Making it useful
The panel is the whole output. Nothing on the price scale changes.
Slope colour is the quick read and the pip figure behind it is the precise one.
The daily change figure comes from the daily open, so it resets once a day rather than rolling.
A flat reading means the slope sat inside InpFlatPipsThresh, not that price stood still.
Alert channels in this build: popup, push notification, email and sound, one message per closed bar.
Alerts cover popup, push, email and sound when the slope state changes. A bar time check keeps it to one alert per closed bar.
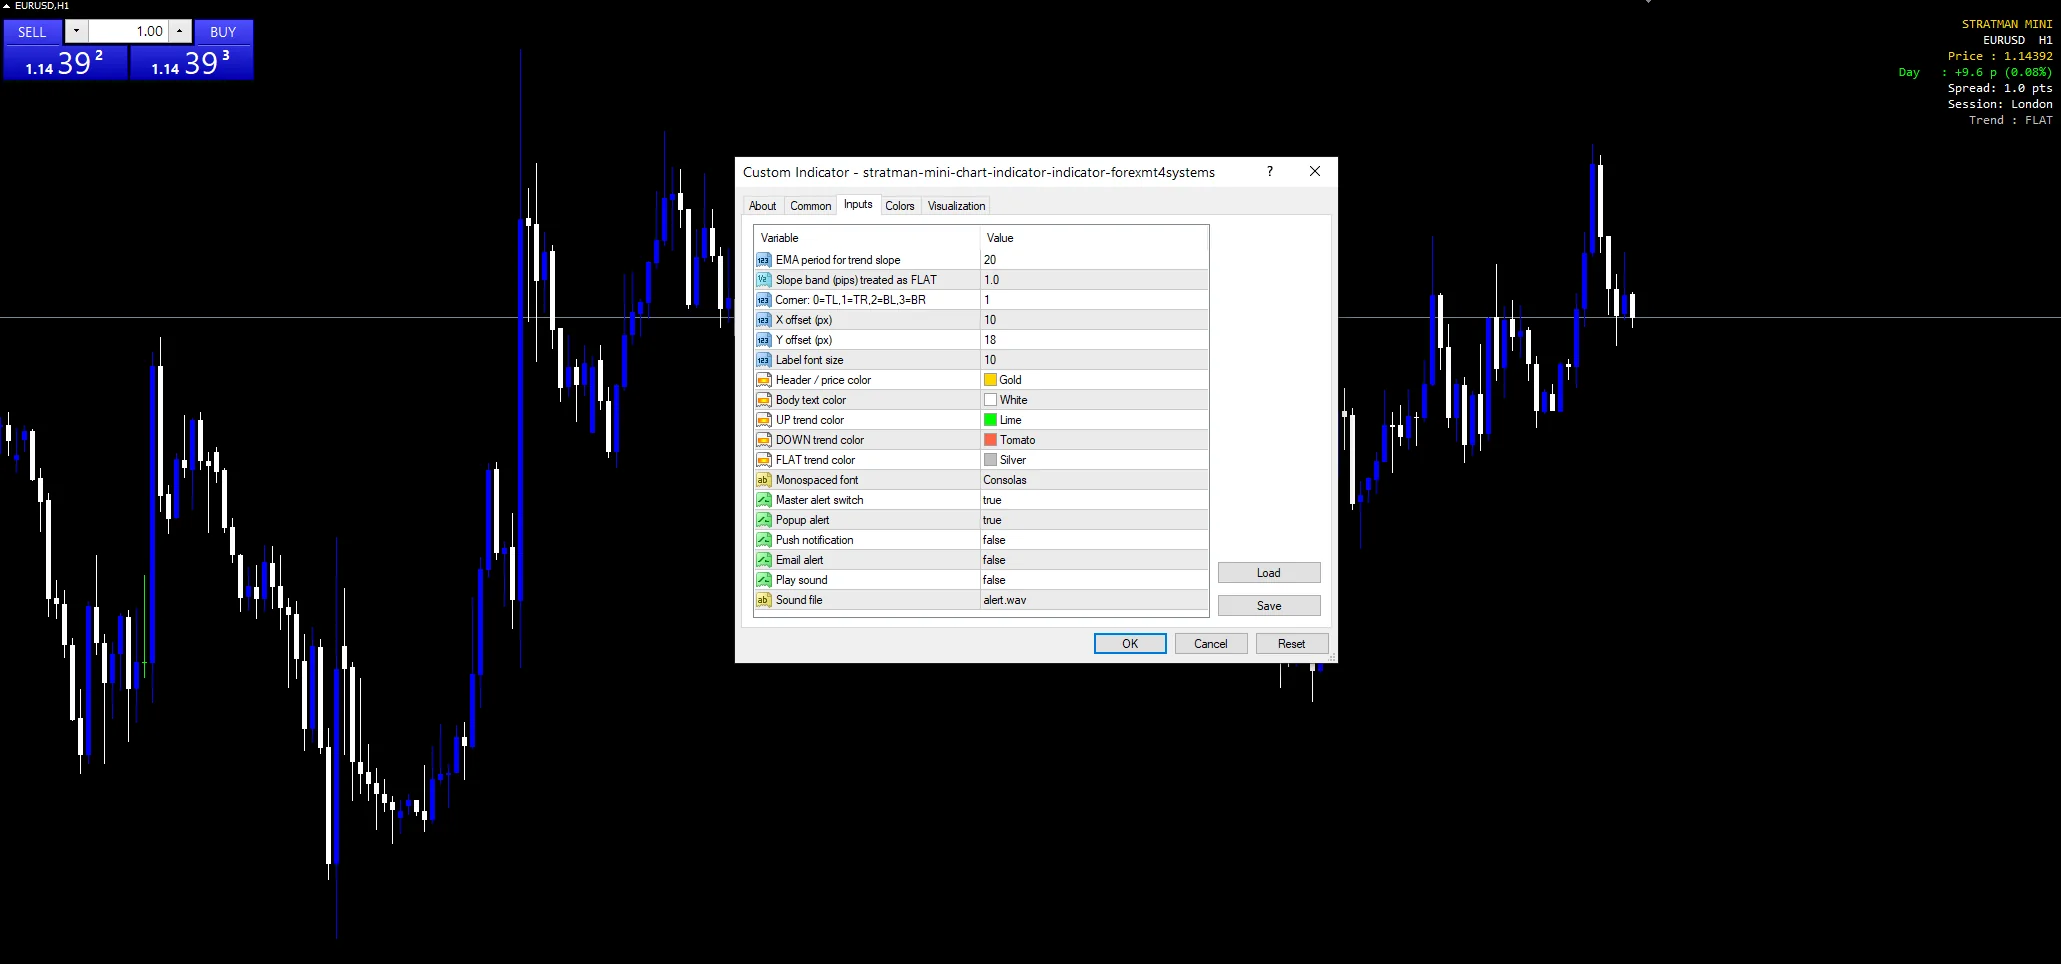
Every Stratman Mini Chart Indicator input
Core settings
| Setting | What it does | Default |
|---|---|---|
InpEmaPeriod |
EMA period for trend slope. InpEmaPeriod is the average whose slope gets measured. It defaults to 20. | 20 |
InpFlatPipsThresh |
Slope band (pips) treated as FLAT. InpFlatPipsThresh is the slope in pips below which the reading counts as flat, 1.0 by default. | 1.0 |
InpXOffsetPx |
X offset (px). InpXOffsetPx nudges the panel horizontally, 10 pixels by default. | 10 |
InpYOffsetPx |
Y offset (px). InpYOffsetPx does the same vertically at 18. | 18 |
Display settings
| Setting | What it does | Default |
|---|---|---|
InpCornerCode |
Corner: 0=TL,1=TR,2=BL,3=BR. InpCornerCode picks which corner holds the panel, 1 by default. | 1 |
InpFontSize |
Label font size. InpFontSize sets the panel text size, 10 by default. | 10 |
InpHeaderColor |
Header / price color. | gold |
InpTextColor |
Body text color. | white |
InpUpColor |
UP trend color. | lime |
InpDownColor |
DOWN trend color. | tomato |
InpFlatColor |
FLAT trend color. | silver |
InpFontName |
Monospaced font. | Consolas |
Alert settings
| Setting | What it does | Default |
|---|---|---|
InpEnableAlerts |
Master alert switch. | on |
InpEnablePopup |
Popup alert. | on |
InpEnablePush |
Push notification. | off |
InpEnableEmail |
Email alert. | off |
InpEnableSound |
Play sound. | off |
InpSoundFile |
Sound file. | alert.wav |
Which chart to load it on
The screenshot uses EURUSD H1. A corner readout suits whatever chart you actually watch, and the daily figure stays constant across timeframes because it reads the daily series. The slope half does follow your chart, so it means something different on M5 than on H4.
What it will not tell you
A slope over one bar is a very short read. It says where the average just went rather than where it is heading.
The flat band is fixed in pips, so one pip means a lot on a quiet pair and very little on a volatile one.
The daily change resets at the broker day boundary, which may not match the session you trade.
Nothing here is a signal. The panel reports two numbers and leaves every decision to you.
Copy the compiled Stratman Mini Chart Indicator file into your MQL4/Indicators folder, and the MT5 build into MQL5/Indicators, then restart the terminal and drag it onto a chart. The step-by-step guide with screenshots is at how to install MT4 and MT5 indicators.
Download the Stratman Mini Chart Indicator for MT4 and MT5
The zip holds the compiled Stratman Mini Chart Indicator build for MT4 and MT5, plus a short README. Compiled files only, no source. Enter your email below and the download link arrives in your inbox.
Download this indicator free
Enter your email and the file is yours. You also get the full MT4 and MT5 library.
FAQ
Why does the tool declare a hidden buffer?
Stratman Hidden holds the close so the tool has a data series attached, while drawing nothing visible on the price scale. The whole output is the corner panel, and the buffer simply keeps the platform happy about an indicator that plots nothing.
What does InpFlatPipsThresh 1.0 prevent?
The slope reading flicking between up and down on every bar. An average is rarely perfectly level, so without a dead band the state would change constantly on movement too small to matter. One pip filters that out on a typical major.
Does the daily change figure follow my chart timeframe?
No. It reads the daily open directly and compares current price against it, so the number stays the same on M5 and on H4. The slope half does follow your chart, which means the two figures in the panel answer questions at different scales.
Where does InpCornerCode put the panel?
It selects one of the four chart corners, defaulting to 1. InpXOffsetPx and InpYOffsetPx then nudge it away from the edge in pixels, which matters when the terminal one-click trading panel occupies the top left of the chart.
Are results guaranteed?
No. Trading involves risk. Results are not guaranteed; past performance is not indicative of future results. Use the Stratman Mini Chart Indicator as one input. Always backtest before trading live.
Category: this is part of our Signal and Forecast collection. Browse more Signal and Forecast for MetaTrader, or explore every MT4 indicator and MT5 indicator on the site.
External references
- Learn more about the underlying method in Backtesting on Wikipedia.
- For wider market background, see Trendanalysis at Investopedia.

About the author
Written by Dominic Walsh, a Forex trader and MT4/MT5 indicator, Expert Advisor and script developer. Every tool on forexmt4systems.com is tested on live charts before release and ships with ready-to-use compiled MT4 (.ex4) and MT5 (.ex5) files. Learn more about the trader and developer behind this site.
How we build, test and correct every tool: Editorial & Testing Policy. Trading carries risk; see the disclaimer.