
The super macd indicator plots a standard MACD in a pane under price, then colours the histogram in two parts. Hist+ carries the bars above zero and Hist- carries the ones below. MACD and Signal run on top of them. The extra work here is presentation and a two part alert rule, not a new formula.
This build ships as a compiled .ex4 for MT4 and .ex5 for MT5; the screenshots below come from EURUSD H1.
| Platforms | MT4 (.ex4) + MT5 (.ex5) |
|---|---|
| Chart window | Separate window (levels 0) |
| Plots | 4: MACD, Signal, Hist+, Hist- |
| Alerts | popup, push notification, email, sound |
| Inputs | 9 |
Output you can see
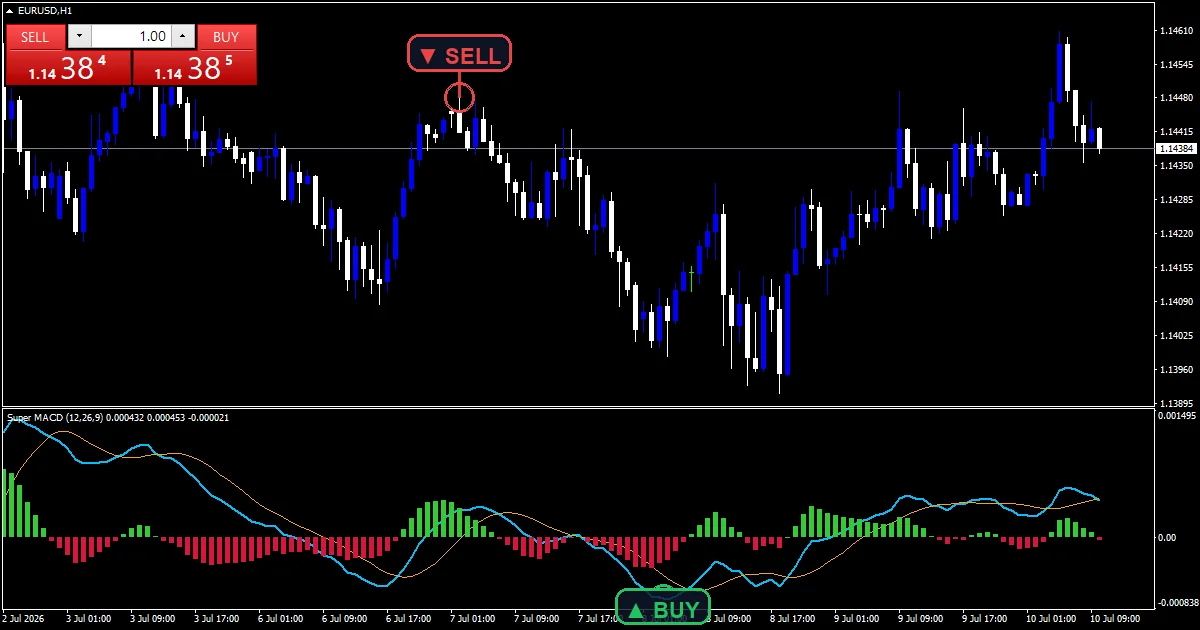
MACD (blue line) tracks how far the FastEma and SlowEma averages sit apart.
Signal (orange line) smooths that gap over SignalSmooth bars.
Hist+ (green bars) holds the histogram wherever MACD sits above Signal.
Hist- (crimson bars) holds it wherever MACD sits below.
A zero line runs across the pane, since the histogram changes sides there.
- MACD: line, deep sky blue, width 2
- Signal: line, orange, width 1
- Hist+: histogram, lime green, width 3
- Hist-: histogram, crimson, width 3
Behind the plots
The main line and its signal
Two calls to the platform MACD routine do the arithmetic. One asks for the main value, the other for the signal value, and both use FastEma, SlowEma and SignalSmooth.
The histogram comes from a subtraction. It takes the main value, removes the signal value, and repeats that on every bar.
Splitting the histogram in two
One histogram written into two buffers gives the pane its colour change. A positive difference lands in Hist+ and a negative one lands in Hist-.
Nothing about the reading itself changes. The split exists so the side of zero is obvious at a glance instead of something you measure against the axis.
What triggers the alert
The alert rule asks for two things at once. The histogram has to cross above zero, and the main value has to sit above Signal on the same closed bar.
The code reads bars one and two to see that cross, so it compares the last closed bar with the one before it. A sell needs the mirror of both conditions.
How to read the signals
Bars flipping from Hist- to Hist+ mark the moment MACD crosses above Signal.
Tall bars mean the two averages are pulling apart. Shrinking bars mean they are closing again.
MACD above zero means FastEma sits above SlowEma, which is a slower reading than the histogram flip.
A histogram flip with MACD still well below zero is a counter move inside a larger down leg.
Alert channels in this build: popup, push notification, email and sound, one message per closed bar.
Alerts run through popup, push, email and sound. A bar time check sits in front of them, so the pair of conditions can only fire one alert per closed bar.
Every Super Macd Indicator input
Core settings
| Setting | What it does | Default |
|---|---|---|
FastEma |
FastEma is the shorter average length, 12 by default. Cutting it makes the main line respond sooner and cross Signal more often. | 12 |
SlowEma |
SlowEma is the longer average at 26. It needs to stay longer than FastEma for the reading to make sense. | 26 |
SignalSmooth |
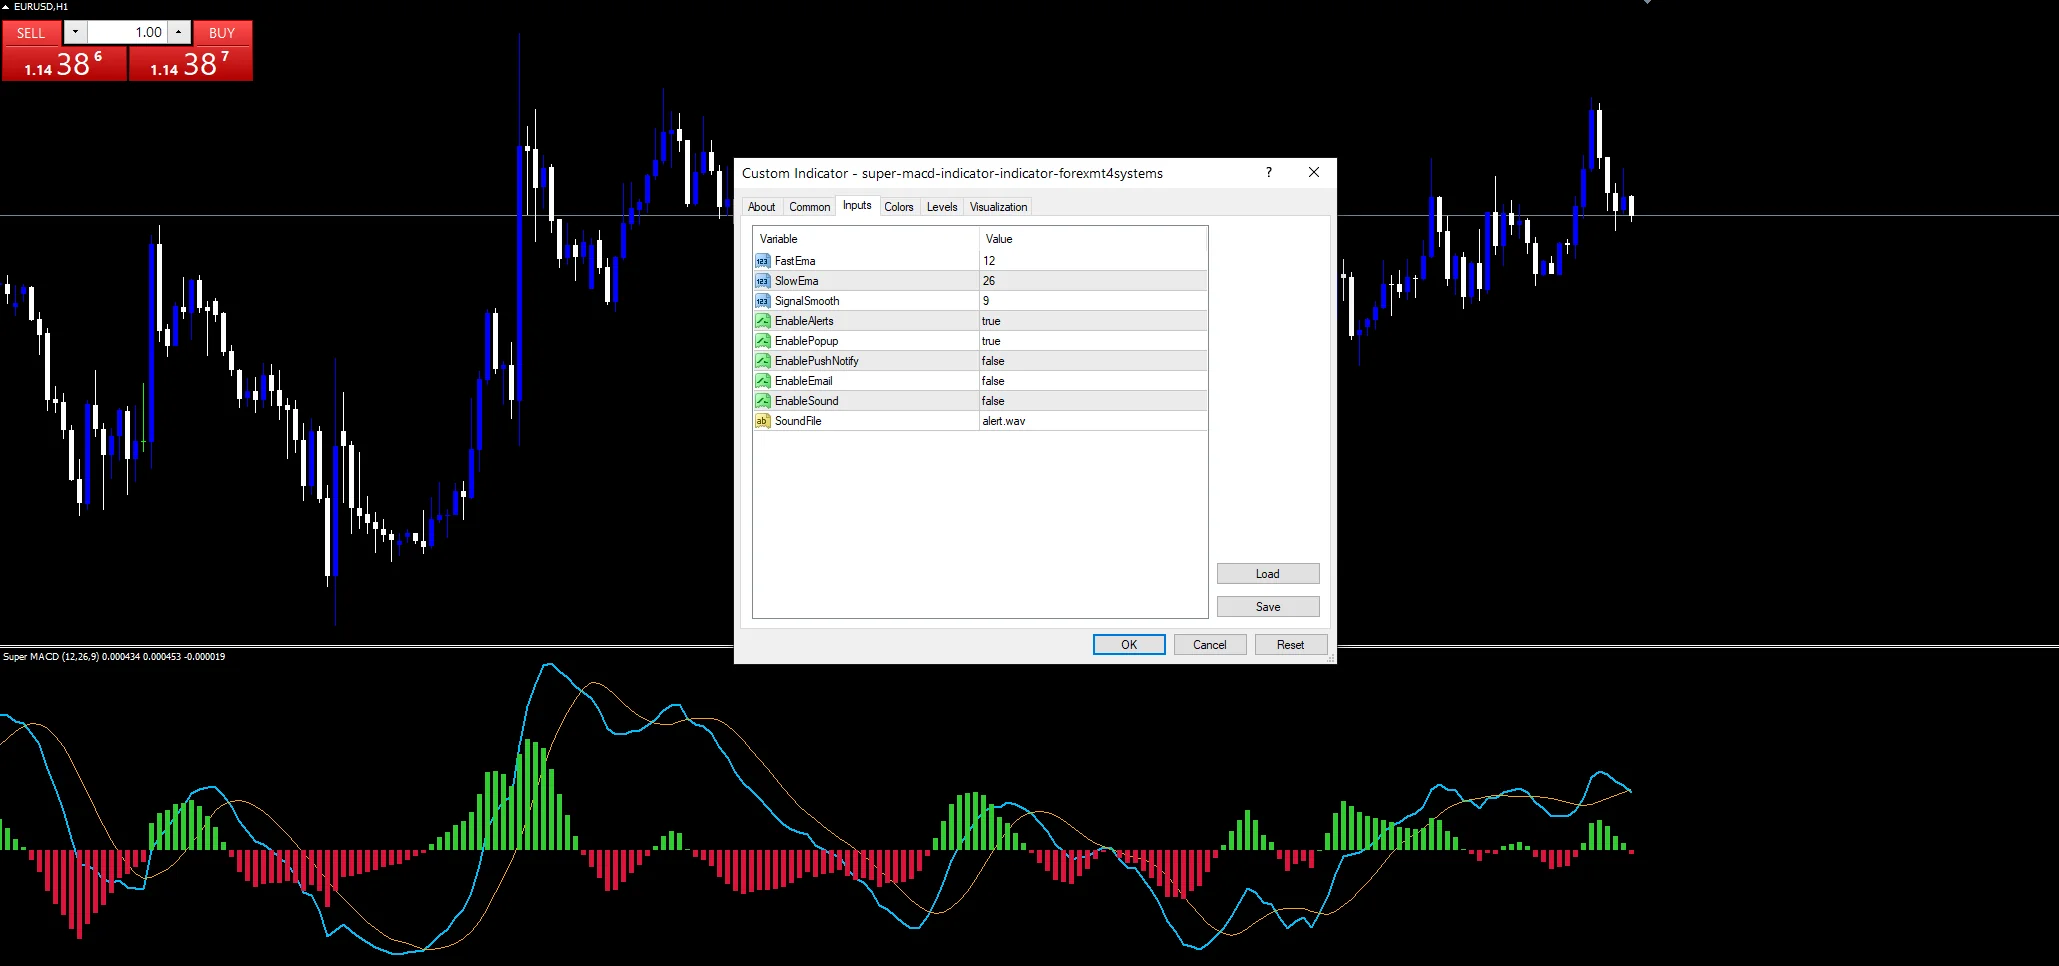
SignalSmooth sets how closely the signal line follows the main value. It defaults to 9, and raising it widens the histogram swings. | 9 |
Alert settings
| Setting | What it does | Default |
|---|---|---|
EnableAlerts |
(see inputs panel) | on |
EnablePopup |
(see inputs panel) | on |
EnablePushNotify |
(see inputs panel) | off |
EnableEmail |
EnableEmail routes each alert to the address configured under Tools, then Options, then Email. It defaults to false. | off |
EnableSound |
(see inputs panel) | off |
SoundFile |
(see inputs panel) | alert.wav |
Placing it well
The screenshot runs EURUSD H1. A 12 and 26 pair covers roughly half a trading day on H1, which is why those defaults have travelled so widely. On daily charts the same settings turn the pane into a slow swing reading. Below M15 the flips come fast and the two alert conditions rarely line up for long.
Where it breaks down
This family lags by construction. Both averages need bars to move, so the histogram flip arrives after the price turn it describes.
In a range the histogram crosses zero repeatedly and each crossing looks the same as the one before it.
You cannot compare the reading across symbols. It measures a price gap, so an instrument quoted in the hundreds produces far taller bars than one quoted near one.
A strong trend can hold Hist+ positive for a long stretch with no fresh alert, because the histogram never returns to zero to cross it again.
Copy the compiled Super Macd Indicator file into your MQL4/Indicators folder, and the MT5 build into MQL5/Indicators, then restart the terminal and drag it onto a chart. The step-by-step guide with screenshots is at how to install MT4 and MT5 indicators.
Download the Super Macd Indicator for MT4 and MT5
The zip holds the compiled Super Macd Indicator build for MT4 and MT5, plus a short README. Compiled files only, no source. Enter your email below and the download link arrives in your inbox.
Download this indicator free
Enter your email and the file is yours. You also get the full MT4 and MT5 library.
FAQ
How do Hist+ and Hist- split the same histogram?
Both plots carry one histogram across two buffers. Hist+ takes the bars where the main value sits above Signal, and Hist- takes the ones where it sits below. Splitting them lets each side carry its own colour, so the zero crossing shows up without reading the axis.
Why does the alert need MACD above Signal as well as a zero cross?
A histogram crossing zero and MACD sitting above Signal describe the same event from two angles, and asking for both filters out a bar where the values sit almost on top of each other. The code checks the last two closed bars, so a flicker inside one bar cannot trigger it.
Does changing SignalSmooth affect the MACD line itself?
No. SignalSmooth only controls how closely the signal line tracks the main value. The main line depends on FastEma and SlowEma alone. Raising SignalSmooth from 9 makes Signal lag further behind, which widens the histogram and delays each flip between the two colours.
Can I compare the histogram height between two different pairs?
Not directly. The histogram measures a gap between two averages in the symbol own price, so an instrument quoted in the hundreds produces much taller bars than one quoted near one. Compare a symbol against its own history instead, or normalise the reading yourself.
Are results guaranteed?
No. Trading involves risk. Results are not guaranteed; past performance is not indicative of future results. Use the Super Macd Indicator as one input. Always backtest before trading live.
Category: this is part of our Oscillators collection. Browse more Oscillators for MetaTrader, or explore every MT4 indicator and MT5 indicator on the site.
External references
- The core method is documented in Carhart four-factor model on Wikipedia.
- Additional market context is at Oversold at Investopedia.

About the author
Written by Dominic Walsh, a Forex trader and MT4/MT5 indicator, Expert Advisor and script developer. Every tool on forexmt4systems.com is tested on live charts before release and ships with ready-to-use compiled MT4 (.ex4) and MT5 (.ex5) files. Learn more about the trader and developer behind this site.
How we build, test and correct every tool: Editorial & Testing Policy. Trading carries risk; see the disclaimer.