
The volumetric order block indicator adds a condition most block tools leave out: the candle has to have carried real volume. A zone only forms when the bar volume beats a multiple of its recent average. OB Buy Reject and OB Sell Reject then mark price rejecting one of those zones.
This build ships as a compiled .ex4 for MT4 and .ex5 for MT5; the screenshots below come from EURUSD H1.
| Platforms | MT4 (.ex4) + MT5 (.ex5) |
|---|---|
| Chart window | Main price chart |
| Plots | 2: OB Buy Reject, OB Sell Reject |
| Alerts | popup, push notification, email, sound |
| Inputs | 18 |
What gets drawn, and where
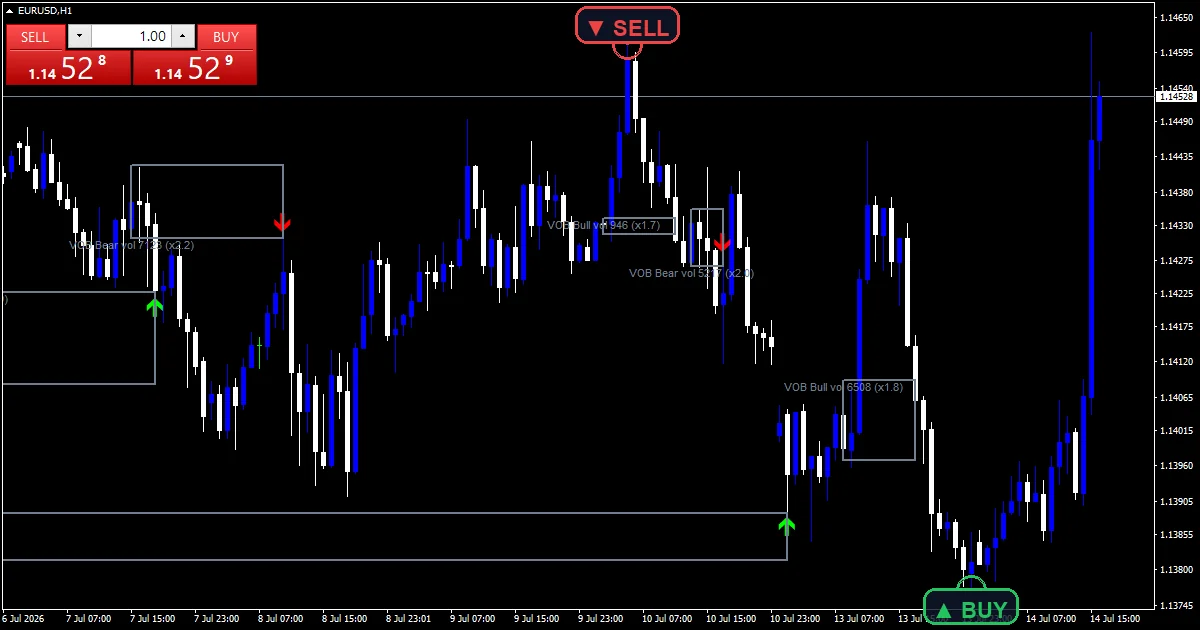
OB Buy Reject marks price rejecting upward out of a bullish zone.
OB Sell Reject marks the mirror rejection from a bearish zone.
Rectangle objects draw each zone, recoloured to the mitigated colour once price has worked through them.
Text objects label each zone with its volume reading when ShowVolumeLabel stays on.
- OB Buy Reject: arrow, lime, width 2, arrow code 233
- OB Sell Reject: arrow, red, width 2, arrow code 234
What happens on each bar
The volume test
Average volume gets measured over VolAvgPeriod bars. A candidate candle has to carry more than VolMult times that average before it can become a zone.
That single condition is what the name refers to. A structurally perfect block on a quiet candle gets rejected, which is the opposite of how most block tools behave.
Structure around the volume
SwingLookback qualifies swing highs and lows, checking that a bar beats its neighbours on both sides. Those swings mark where structure broke.
MaxSearchBars limits how far back the code looks from a break to find the candle that started it, so a zone always sits near the move it belongs to.
Zone life and rejection
Each zone spans either the candle body or its full range, depending on UseBodyZone. It defaults to false, so the whole range counts.
MaxOB caps how many zones stay tracked. Price returning and rejecting from a zone marks the bar, and a zone that gets worked through changes to the mitigated colour rather than vanishing.
Reading it correctly
A zone here has passed a volume test as well as a structural one, so there are fewer of them than a plain block tool would draw.
The volume label tells you how much the candle actually carried, which is worth checking before trusting a zone.
A mitigated zone stays visible in a different colour, so you can see where price has already been.
Rejection markers only fire on zones still being tracked, and MaxOB decides how many that is.
Alert channels in this build: popup, push notification, email and sound, one message per closed bar.
Alerts cover popup, push, email and sound on a rejection. A bar time check keeps it to one alert per closed bar.
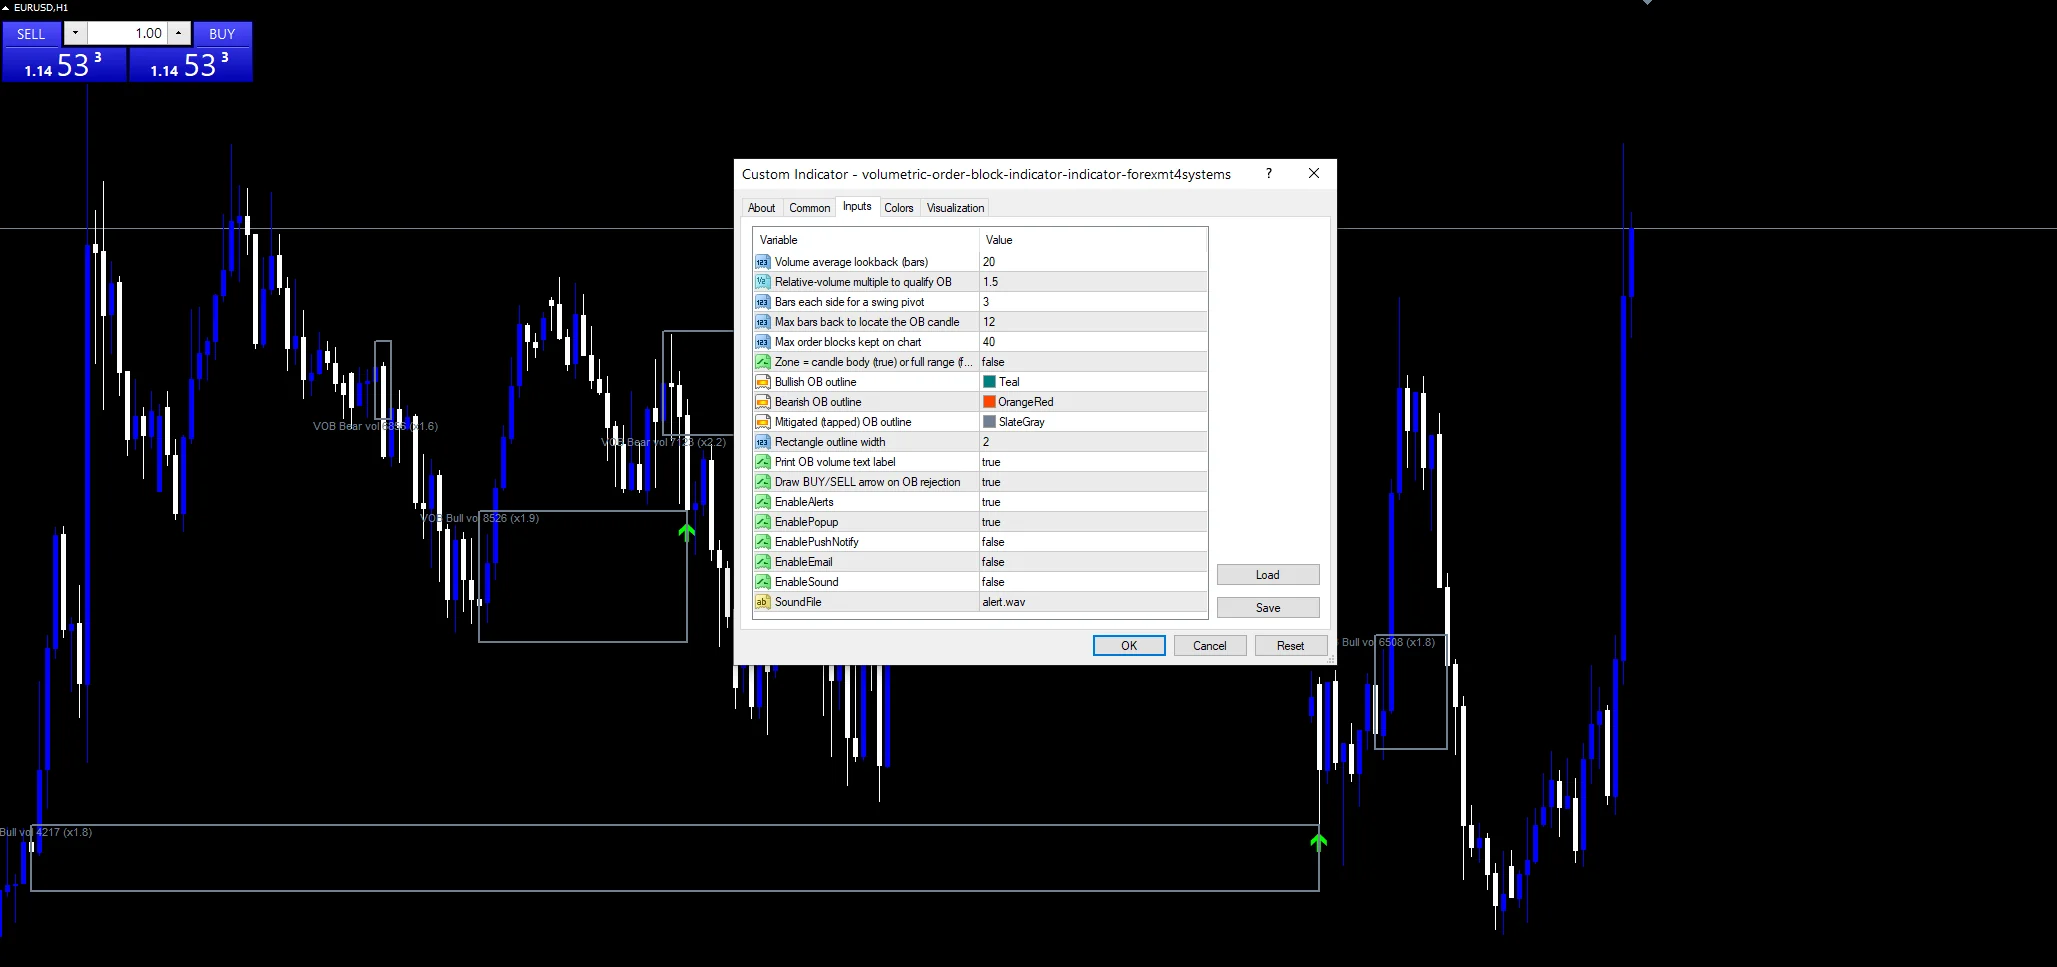
Every Volumetric Order Block Indicator input
Core settings
| Setting | What it does | Default |
|---|---|---|
VolAvgPeriod |
Volume average lookback (bars). VolAvgPeriod is the window the average volume comes from, 20 bars by default. | 20 |
VolMult |
Relative-volume multiple to qualify OB. VolMult is how many times that average a candle has to carry. It defaults to 1.5, and raising it towards 2.5 leaves only the heaviest bars. | 1.5 |
SwingLookback |
Bars each side for a swing pivot. SwingLookback is how many bars either side a swing point has to beat, 3 by default. | 3 |
MaxSearchBars |
Max bars back to locate the OB candle. MaxSearchBars limits how far back from a break the origin search runs, 12 bars by default. | 12 |
MaxOB |
Max order blocks kept on chart. MaxOB caps how many zones stay tracked at once, 40 by default. | 40 |
UseBodyZone |
Zone = candle body (true) or full range (false). UseBodyZone narrows each zone to the candle body instead of its full range. It defaults to false. | off |
Display settings
| Setting | What it does | Default |
|---|---|---|
BullColor |
Bullish OB outline. | teal |
BearColor |
Bearish OB outline. | orange red |
MitigatedColor |
Mitigated (tapped) OB outline. | slate gray |
ZoneWidth |
Rectangle outline width. | 2 |
ShowVolumeLabel |
Print OB volume text label. ShowVolumeLabel writes the volume reading onto each zone. It defaults to true. | on |
ShowRejectArrows |
Draw BUY/SELL arrow on OB rejection. | on |
Alert settings
| Setting | What it does | Default |
|---|---|---|
EnableAlerts |
(see inputs panel) | on |
EnablePopup |
(see inputs panel) | on |
EnablePushNotify |
(see inputs panel) | off |
EnableEmail |
(see inputs panel) | off |
EnableSound |
(see inputs panel) | off |
SoundFile |
(see inputs panel) | alert.wav |
Fitting the settings to a market
The screenshot uses EURUSD H1. Volume on a forex chart is tick volume, which counts price updates rather than traded size, so the comparison works best where update activity genuinely varies. H1 and H4 give that. On M1 nearly every session open clears the multiple.
Honest weaknesses
Tick volume counts price updates, not contracts. A candle that beats the average was busy, which is not the same as heavily traded.
The average resets nothing at a session boundary, so a quiet Asian average makes early London candles qualify easily.
MaxSearchBars at 12 means an origin further back than that never gets found, and the zone is skipped rather than misplaced.
A rejection marker describes one bar leaving a zone, which is a much weaker statement than the zone holding.
Copy the compiled Volumetric Order Block Indicator file into your MQL4/Indicators folder, and the MT5 build into MQL5/Indicators, then restart the terminal and drag it onto a chart. The step-by-step guide with screenshots is at how to install MT4 and MT5 indicators.
Background reading on the method behind the Volumetric Order Block Indicator: Pakistan Forex scam case on Wikipedia, Record High Percent at StockCharts ChartSchool.
Download the Volumetric Order Block Indicator for MT4 and MT5
The zip holds the compiled Volumetric Order Block Indicator build for MT4 and MT5, plus a short README. Compiled files only, no source. Enter your email below and the download link arrives in your inbox.
Download this indicator free
Enter your email and the file is yours. You also get the full MT4 and MT5 library.
FAQ
What does VolMult 1.5 require of a candle?
Its volume has to exceed one and a half times the average over VolAvgPeriod bars. A candle failing that never becomes a zone, however good the structure around it looks. Raising VolMult towards 2.5 leaves only the heaviest bars on the chart.
Does VolAvgPeriod use real volume or tick volume?
On a forex chart it is tick volume, which counts how many times the price updated during the bar. That correlates with activity but not with contracts traded. Treat a qualifying candle as busy rather than as heavily transacted, and read the labels with that in mind.
Should I set UseBodyZone to true?
It depends how tight you want the zones. Left false the zone spans the whole candle range including wicks, which is more forgiving and catches more rejections. Set true it covers the body only, giving a narrower area that price has to enter more precisely.
What happens to an OB Buy Reject zone once mitigated?
It changes to the mitigated colour and stays on the chart rather than disappearing. That keeps the history visible, so you can see which zones have already been worked through and which are still untouched, up to the MaxOB limit.
Are results guaranteed?
No. Trading involves risk. Results are not guaranteed; past performance is not indicative of future results. Use the Volumetric Order Block Indicator as one input. Always backtest before trading live.
Category: this is part of our Smart Money collection. Browse more Smart Money for MetaTrader, or explore every MT4 indicator and MT5 indicator on the site.
External references
- Learn more about the underlying method in Pakistan Forex scam case on Wikipedia.
- For wider market background, see Record High Percent at StockCharts ChartSchool.

About the author
Written by Dominic Walsh, a Forex trader and MT4/MT5 indicator, Expert Advisor and script developer. Every tool on forexmt4systems.com is tested on live charts before release and ships with ready-to-use compiled MT4 (.ex4) and MT5 (.ex5) files. Learn more about the trader and developer behind this site.
How we build, test and correct every tool: Editorial & Testing Policy. Trading carries risk; see the disclaimer.