
The williams ad ma indicator ships as a long-window Williams %R oscillator. Its one plot sits in a pane below price. The reading tracks where each close lands inside the last fifty bars of range. Position traders who want a slow, bounded momentum gauge get a simple one here.
This build ships as a compiled .ex4 for MT4 and .ex5 for MT5; the screenshots below come from EURUSD H1.
| Platforms | MT4 (.ex4) + MT5 (.ex5) |
|---|---|
| Chart window | Separate window |
| Plots | 1: Williams %R |
| Alerts | popup, push notification, email, sound |
| Inputs | 7 |
What you get on the chart
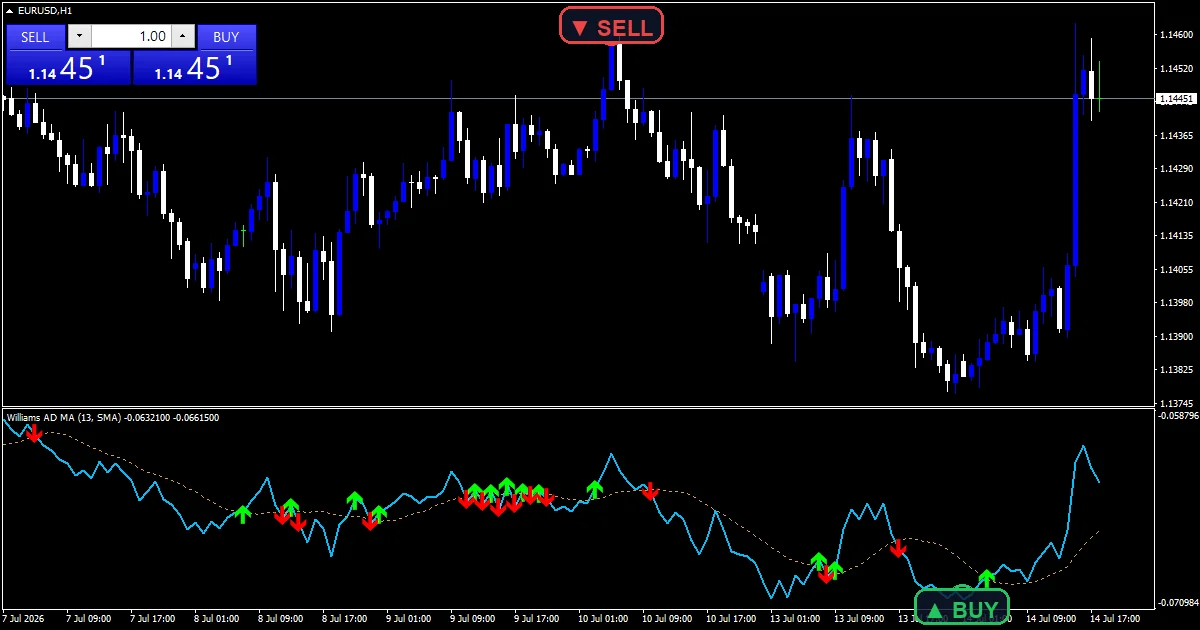
One buffer carries everything. The pane holds a single sandy-brown curve, labelled Williams %R. Its ceiling sits at zero and its floor at minus one hundred. Nothing else prints: no histogram, no second curve and no smoothing overlay.
The scale never shifts with the symbol. Gold and a currency pair produce the same bounded shape, because the maths divides by each symbol’s own bracket. So the pane stays easy to compare across a watchlist.
- Williams %R: plot, sandy brown
How the Williams AD MA Indicator calculates its values
The fifty-bar bracket
Each bar starts a small scan. The code walks back across Period bars and keeps the top high and the bottom low. Those two prices bracket the stretch. The wider that bracket runs, the less a single close can move the reading.
Turning the close into a number
One division handles it. The code measures the gap from the top of the bracket down to the close, divides that gap by the bracket width, then flips the sign. A close sitting on the top edge scores zero. Down at the floor it reads minus one hundred. A bracket of zero width returns minus fifty.
Reading the output
Slow settings change the message. With a fifty-bar bracket the curve spends long stretches near one edge while a trend runs. A drift back toward the centre marks a genuine pause rather than a small pullback.
Watch the turns, not the touches. A push to the top of the scale followed by a firm roll over hints that buyers stopped closing at the highs. The same logic mirrors at the bottom edge. Combine that turn with a level on the price chart before you act on it.
Alert channels in this build: popup, push notification, email and sound, one message per closed bar.
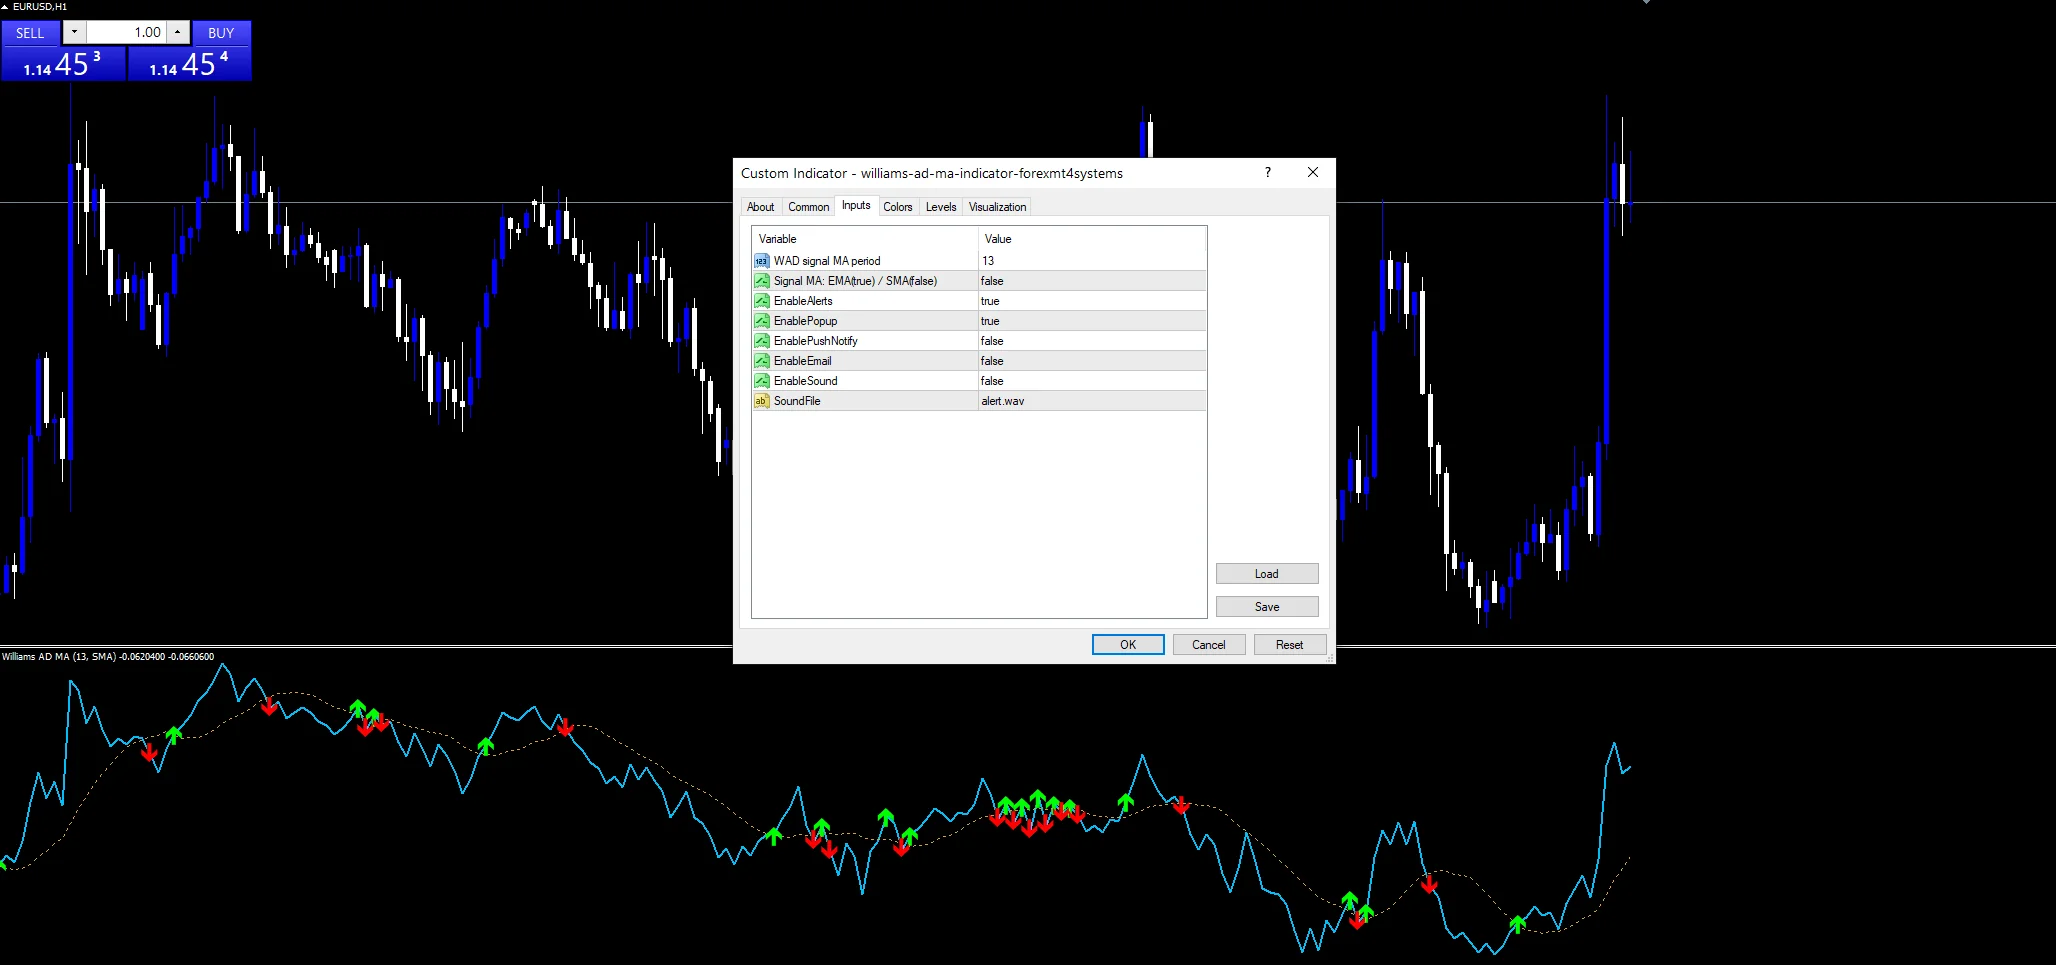
EnableAlerts covers the alert block, while EnablePopup, EnablePushNotify, EnableEmail and EnableSound map to popup, mobile push, email and sound.
Every Williams AD MA Indicator input
Core settings
| Setting | What it does | Default |
|---|---|---|
Period |
Period (default 50) covers the number of bars in the high-low bracket. A shorter setting sharpens the swings, while a longer one flattens them. | 50 |
Alert settings
| Setting | What it does | Default |
|---|---|---|
EnableAlerts |
(see inputs panel) | on |
EnablePopup |
(see inputs panel) | on |
EnablePushNotify |
(see inputs panel) | off |
EnableEmail |
(see inputs panel) | off |
EnableSound |
(see inputs panel) | off |
SoundFile |
(see inputs panel) | alert.wav |
Getting the chart right
The screenshot for this page runs on EURUSD H1. Fifty bars there stretch across roughly two sessions, so the curve turns slowly. Daily charts suit the setting well, because fifty candles cover about ten weeks of trade. Intraday scalpers usually want something much faster. Majors, gold and index CFDs all behave the same way under the formula.
When it will mislead you
The name and the code disagree. Nothing here accumulates volume, and no moving average smooths the output. The source declares one buffer and prints one Williams %R curve. Read the plot label rather than the product name.
A long bracket buries fresh information. It only shifts when a new extreme arrives, so the curve can sit almost still for hours while price works inside old highs and lows.
Extremes persist during trends. A strong run keeps the reading pinned near the floor for days at a time. Selling every touch there costs money. Use structure or a trend filter alongside the pane.
The alert section sends nothing on its own. Its dispatcher notes each new bar, then exits without calling any channel.
Copy the compiled Williams AD MA Indicator file into your MQL4/Indicators folder, and the MT5 build into MQL5/Indicators, then restart the terminal and drag it onto a chart. The step-by-step guide with screenshots is at how to install MT4 and MT5 indicators.
Download the Williams AD MA Indicator for MT4 and MT5
The zip holds the compiled Williams AD MA Indicator build for MT4 and MT5, plus a short README. Compiled files only, no source. Enter your email below and the download link arrives in your inbox.
Download this indicator free
Enter your email and the file is yours. You also get the full MT4 and MT5 library.
FAQ
Does the williams ad ma indicator track accumulation or distribution?
Nothing in the source does. It reads only high, low and close, finds the highest high and the lowest low across the bracket, then places the close inside it. No accumulation total and no distribution total appear anywhere in the loop.
Why does the pane label read Williams %R rather than AD MA?
The label comes straight from the source. Its single buffer carries the plot name Williams %R, and the calculation matches that classic oscillator exactly. No accumulation line and no smoothing pass sit behind it. The label tells you what the pane really shows.
How does Period 50 compare with the classic fourteen-bar setting?
A fifty-bar bracket updates far less often. Extremes then arrive rarely, and each reading reflects a much wider slice of history. The classic short setting flips between edges several times a day instead. Use the long window for bias and a short one for timing.
Which timeframe suits a fifty-bar bracket on EURUSD?
H1 and H4 both work well. On EURUSD H1 the window spans about two sessions, which keeps the curve smooth without freezing it. On daily charts the same count reaches back roughly ten weeks, so it becomes a slow bias tool. M5 turns it into a lagging curve.
Are results guaranteed?
No. Trading involves risk. Results are not guaranteed; past performance is not indicative of future results. Use the Williams AD MA Indicator as one input. Always backtest before trading live.
Category: this is part of our Oscillators collection. Browse more Oscillators for MetaTrader, or explore every MT4 indicator and MT5 indicator on the site.
External references
- For background on this concept, see Williams %R on Wikipedia.
- For broader market context, see Balance Of Power Bop at StockCharts ChartSchool.

About the author
Written by Dominic Walsh, a Forex trader and MT4/MT5 indicator, Expert Advisor and script developer. Every tool on forexmt4systems.com is tested on live charts before release and ships with ready-to-use compiled MT4 (.ex4) and MT5 (.ex5) files. Learn more about the trader and developer behind this site.
How we build, test and correct every tool: Editorial & Testing Policy. Trading carries risk; see the disclaimer.