
The williams accumulation distribution indicator plots Larry Williams’ WAD line in a pane under the chart. It adds a smoothed WAD Signal line and divergence arrows. Each bar adds or takes away a slice of its true range. The rule looks at where the bar closed against the prior close. It suits traders who want a price-only pressure gauge.
This build ships as a compiled .ex4 for MT4 and .ex5 for MT5; the screenshots below come from EURUSD H1.
| Platforms | MT4 (.ex4) + MT5 (.ex5) |
|---|---|
| Chart window | Separate window |
| Plots | 4: WAD, WAD Signal, Bearish Divergence, Bullish Divergence |
| Alerts | popup, push notification, email, sound |
| Inputs | 10 |
What each plot looks like
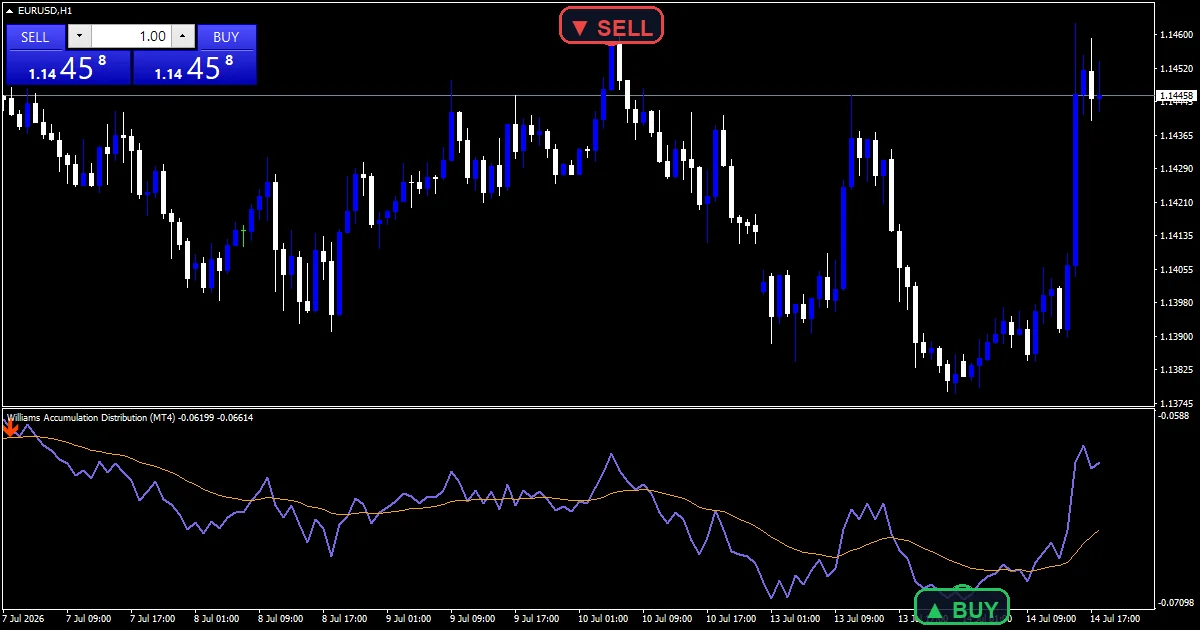
WAD is the main plot. It is a medium-slate-blue line, two pixels wide. The line runs as a running total from the oldest loaded bar. Its level means little, because the code anchors that bar at zero. Read the slope and the swings instead. WAD Signal is a thinner orange line. It is an EMA of WAD over InpSignalPeriod (default 21) bars. InpShowSignal can hide it.
Bearish Divergence prints an orange-red down arrow, code 234. It marks a pivot high where price rose but WAD did not. Bullish Divergence is the spring-green up arrow, code 233. It marks a pivot low where price fell but WAD held up. InpShowDiverge switches both arrow sets off.
- WAD: line, medium slate blue, width 2
- WAD Signal: line, orange, width 1
- Bearish Divergence: arrow, orange red, width 2, arrow code 234
- Bullish Divergence: arrow, spring green, width 2, arrow code 233
From price to plot
The WAD line
The loop runs from the oldest bar forward. It carries a running total. For each bar it takes the previous close. The true-range high is the larger of this bar’s high and that close. The true-range low is the smaller of the low and that close. A close above the previous close adds close minus the true-range low. A close below adds close minus the true-range high, a negative number. An unchanged close adds nothing.
The WAD Signal EMA
This step only runs when InpShowSignal is on. Alpha is two divided by one more than InpSignalPeriod. The code seeds the first value with a plain average of the oldest InpSignalPeriod readings. After that it runs the usual EMA step. The new signal is the old one plus alpha times the gap to WAD. The seed stops the orange line from spiking at the start.
Finding pivots and divergences
A pivot high must top every bar InpPivotLookback bars to each side. InpPivotLookback defaults to 6. A pivot low is the mirror test. The scan runs from oldest to newest. It remembers the last pivot high and its WAD value. A higher pivot high with a lower WAD reading is a bearish divergence. The code drops a Bearish Divergence arrow on that pivot. A lower pivot low with a higher WAD reading is the bullish case.
How to work with it
Rising WAD under rising price confirms the move. Closes keep landing near the highs of their bars, so buyers hold control. Falling WAD under falling price confirms the other side. Trouble shows when the two disagree.
A Bearish Divergence arrow is the seller’s cue. Price pushed to a higher swing high, yet WAD made a lower high. The later rally closed weaker inside its range. A Bullish Divergence arrow marks the reverse at a swing low. WAD crossing below its orange WAD Signal leans bearish. Some traders use that cross as a filter for the arrows.
Alert channels in this build: popup, push notification, email and sound, one message per closed bar.
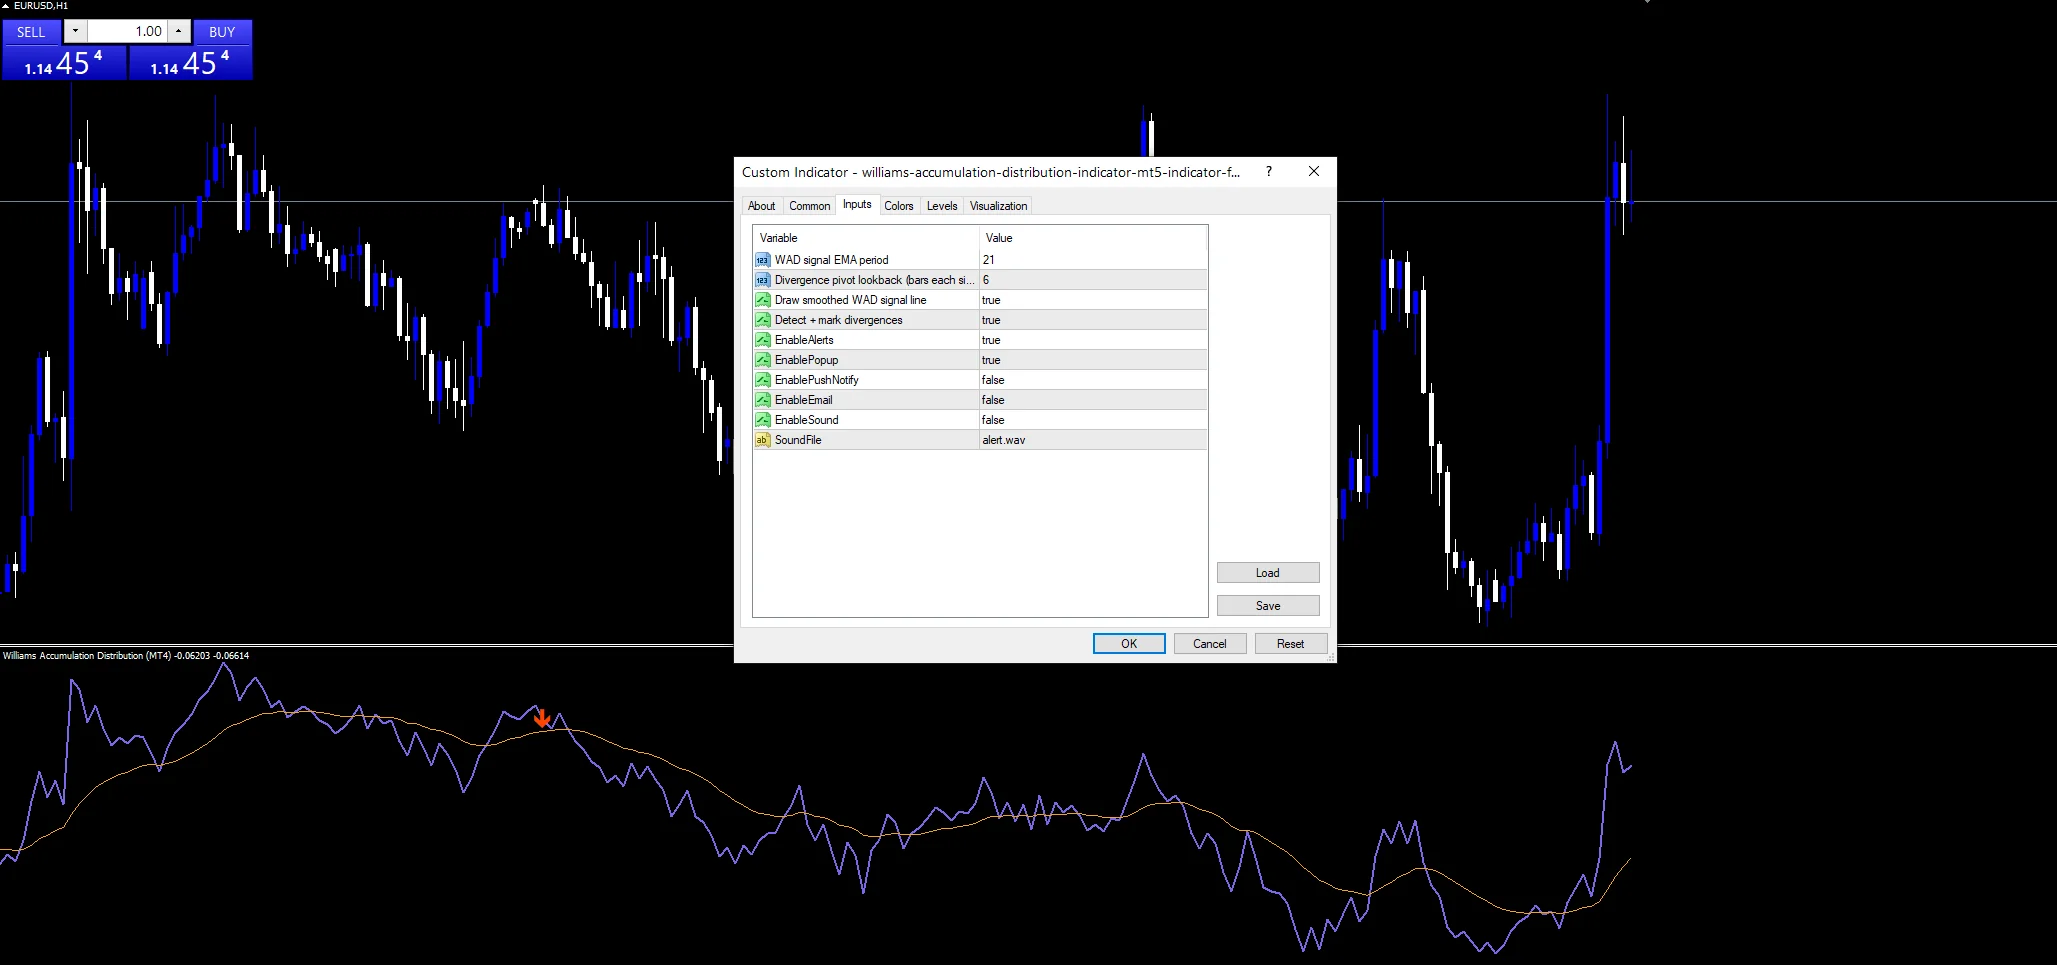
Alerts go out by popup, push notification, email and sound. EnableAlerts gates the block. EnablePopup, EnablePushNotify, EnableEmail and EnableSound choose the channels. The code fires at most once per closed bar. It only fires when the newest confirmed pivot is a divergence.
Every Williams Accumulation Distribution Indicator input
Core settings
| Setting | What it does | Default |
|---|---|---|
InpSignalPeriod |
WAD signal EMA period. InpSignalPeriod (default 21) sets the EMA length of the WAD Signal line. Shorter values hug the WAD line and cross more often. Longer values smooth it into a slow trend reference. | 21 |
InpPivotLookback |
Divergence pivot lookback (bars each side). InpPivotLookback (default 6) is the number of bars each side that a high or low must dominate. Larger values find fewer, bigger swings and delay the arrows. | 6 |
Display settings
| Setting | What it does | Default |
|---|---|---|
InpShowSignal |
Draw smoothed WAD signal line. InpShowSignal (default true) draws or hides the orange WAD Signal line. The divergence logic keeps running either way. | on |
InpShowDiverge |
Detect + mark divergences. | on |
Alert settings
| Setting | What it does | Default |
|---|---|---|
EnableAlerts |
(see inputs panel) | on |
EnablePopup |
(see inputs panel) | on |
EnablePushNotify |
(see inputs panel) | off |
EnableEmail |
(see inputs panel) | off |
EnableSound |
(see inputs panel) | off |
SoundFile |
(see inputs panel) | alert.wav |
Where to run it
Honest highs and lows are all the line needs. It works on forex majors, gold and index CFDs. The screenshot pair is EURUSD on H1. There a 21-bar signal and a 6-bar pivot window give a few arrows per week. On M5 the same settings find far more pivots and more false divergences. On H4 and daily charts the arrows are rare but sit at swings that matter.
Limits worth knowing
The arrows arrive late by design. A pivot needs InpPivotLookback bars on each side before it counts. A divergence at a swing high prints six bars after that high. Price can already be deep into the reversal by then. It can also have resumed the trend.
Divergence is not a reversal signal on its own. In a strong trend WAD can make three or four lower highs while price climbs. Each prints a Bearish Divergence arrow and each one fails. Treat the arrow as a warning to tighten risk, not as an entry.
The level of the WAD line depends on how many bars the chart holds. The code anchors zero at the oldest bar, so more history shifts the whole line. A large weekend gap adds one outsized step. The previous close then sits far outside the bar’s range.
Copy the compiled Williams Accumulation Distribution Indicator file into your MQL4/Indicators folder, and the MT5 build into MQL5/Indicators, then restart the terminal and drag it onto a chart. The step-by-step guide with screenshots is at how to install MT4 and MT5 indicators.
Download the Williams Accumulation Distribution Indicator for MT4 and MT5
The zip holds the compiled Williams Accumulation Distribution Indicator build for MT4 and MT5, plus a short README. Compiled files only, no source. Enter your email below and the download link arrives in your inbox.
Download this indicator free
Enter your email and the file is yours. You also get the full MT4 and MT5 library.
FAQ
Why does a Bullish Divergence arrow appear six bars after the swing low?
The code only trusts a low once InpPivotLookback bars on both sides are higher. That takes six closed bars with the default. It then compares the new pivot with the previous one. If price is lower while WAD is higher, it paints the arrow back on the pivot bar.
Why does the WAD line sit at a different level on another chart?
The build starts the running total at zero on the oldest bar the chart holds. A terminal with more history anchors at a different bar. The whole line then shifts. Levels do not match between charts. Read the slope, the swings and the divergence arrows instead.
When does the williams accumulation distribution indicator fire its popup alert?
Once per closed bar, and only when the bar that just became a confirmed pivot shows a divergence. A Bearish Divergence sends a SELL message. A Bullish Divergence sends a BUY message. EnableAlerts gates the block. EnablePopup, EnablePushNotify, EnableEmail and EnableSound choose the channels.
Can a Bearish Divergence arrow vanish after it prints in the pane?
No. The code recomputes every bar on each pass. A pivot still needs InpPivotLookback bars on its right before it qualifies. New candles cannot change bars that old. An arrow appears late, but the comparison behind it is fixed.
Are results guaranteed?
No. Trading involves risk. Results are not guaranteed; past performance is not indicative of future results. Use the Williams Accumulation Distribution Indicator as one input. Always backtest before trading live.
Category: this is part of our Oscillators collection. Browse more Oscillators for MetaTrader, or explore every MT4 indicator and MT5 indicator on the site.
External references
- Learn more about the underlying method in Accumulation/distribution index on Wikipedia.
- For wider market background, see Chande Trend Meter Ctm at StockCharts ChartSchool.

About the author
Written by Dominic Walsh, a Forex trader and MT4/MT5 indicator, Expert Advisor and script developer. Every tool on forexmt4systems.com is tested on live charts before release and ships with ready-to-use compiled MT4 (.ex4) and MT5 (.ex5) files. Learn more about the trader and developer behind this site.
How we build, test and correct every tool: Editorial & Testing Policy. Trading carries risk; see the disclaimer.