
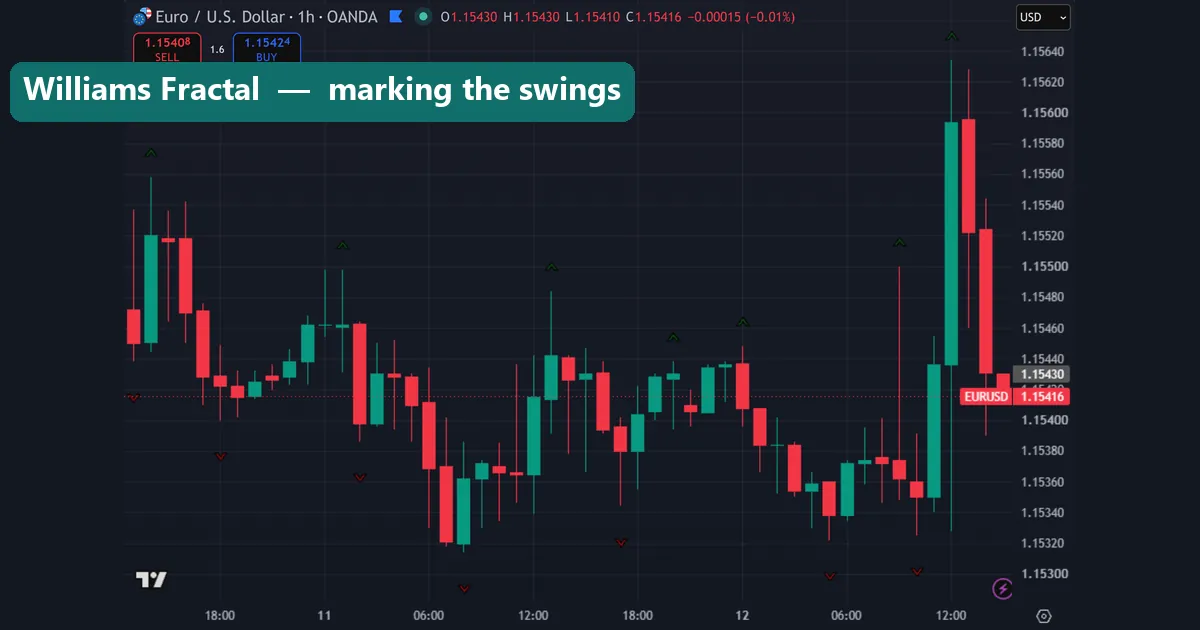
A fractal in trading is a five-bar price pattern that marks a local turning point on a chart. Bill Williams defined it without any maths. For an up fractal, the middle bar of five holds the highest high of the group. A down fractal needs the lowest low instead. That one rule turns a noisy chart into a clean map of swing highs and swing lows. This guide shows how fractals form and why each one confirms two bars late. You will also see how traders use them for stops, structure breaks and Fibonacci anchors.
What a fractal in trading actually is
Bill Williams introduced fractals in his book Trading Chaos as a mechanical way to mark structure. Take any five consecutive candles. An up fractal needs the middle candle’s high to beat all four highs around it. Flip the logic for a down fractal: the middle candle’s low must sit below the four lows beside it.
Platforms draw the result as a small arrow above or below that middle bar. Nothing gets smoothed, averaged or weighted, so two traders looking at the same chart see identical fractals. Because of that consistency, the tool slots into almost any strategy without argument. Some platforms let you widen the pattern to seven or nine bars, which produces fewer and more significant swing points.
Up fractals and down fractals
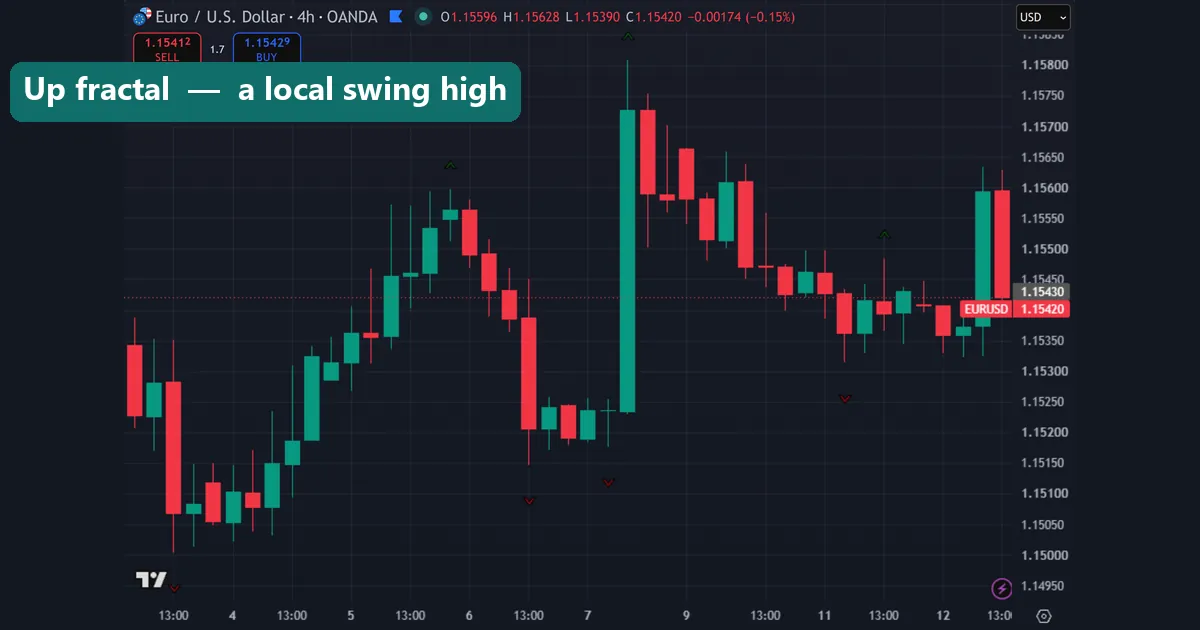
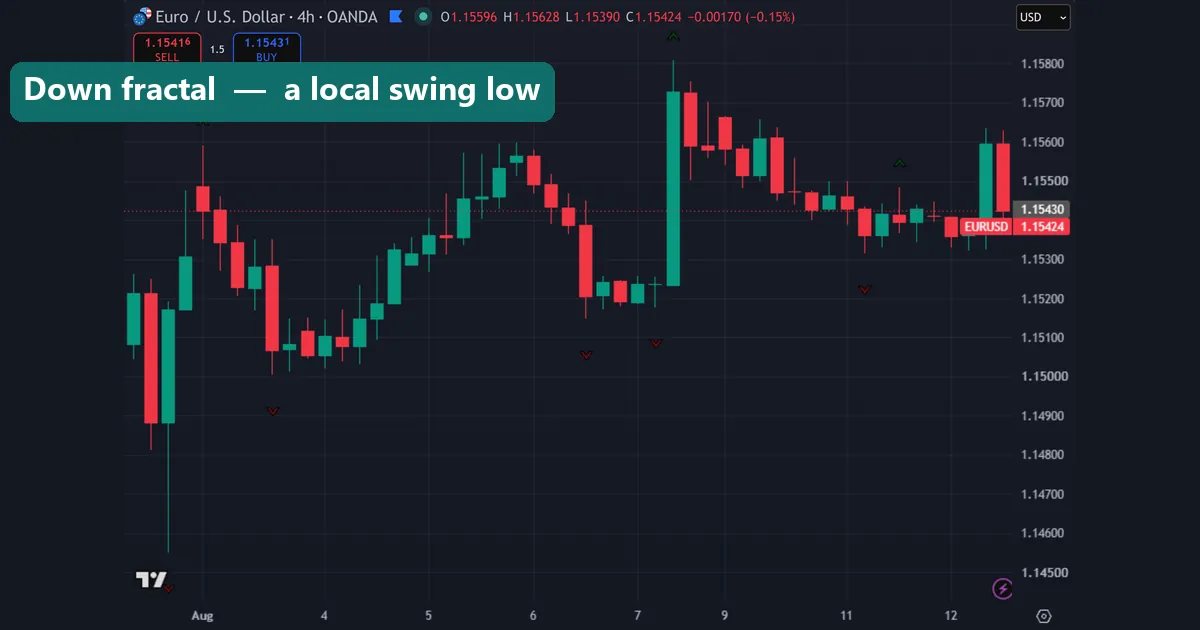
An up fractal prints above the candle and marks a local high. Buyers ran out of momentum there, at least for the moment. A down fractal prints below the candle and marks a local low. Together, the two types trace the swing skeleton of the market.
Read them as a sequence rather than as individual signals. Rising up fractals paired with rising down fractals describe an uptrend. Falling ones on both sides describe a downtrend. When the market stops printing higher up fractals and starts printing lower ones, structure has shifted. That shift tells you far more than any single arrow does.
The two-bar lag you cannot ignore
Now for the honest part. No fractal is confirmed until the two bars to its right have closed. The middle bar might look like the highest high right now, yet the very next candle can print higher and cancel it. So every arrow on a finished chart actually appeared two bars after the high or low it marks.
Several platforms display a provisional arrow on the newest qualifying bar. Treat it as provisional, because it can disappear. This behaviour is not repainting in the deceptive sense. The definition simply works as written. Still, it makes fractals a confirmation tool rather than a leading one. Price the lag into your entries. On an M5 chart the delay costs ten minutes. On a daily chart it costs two days, which changes the trade entirely.
How to use fractals on a chart
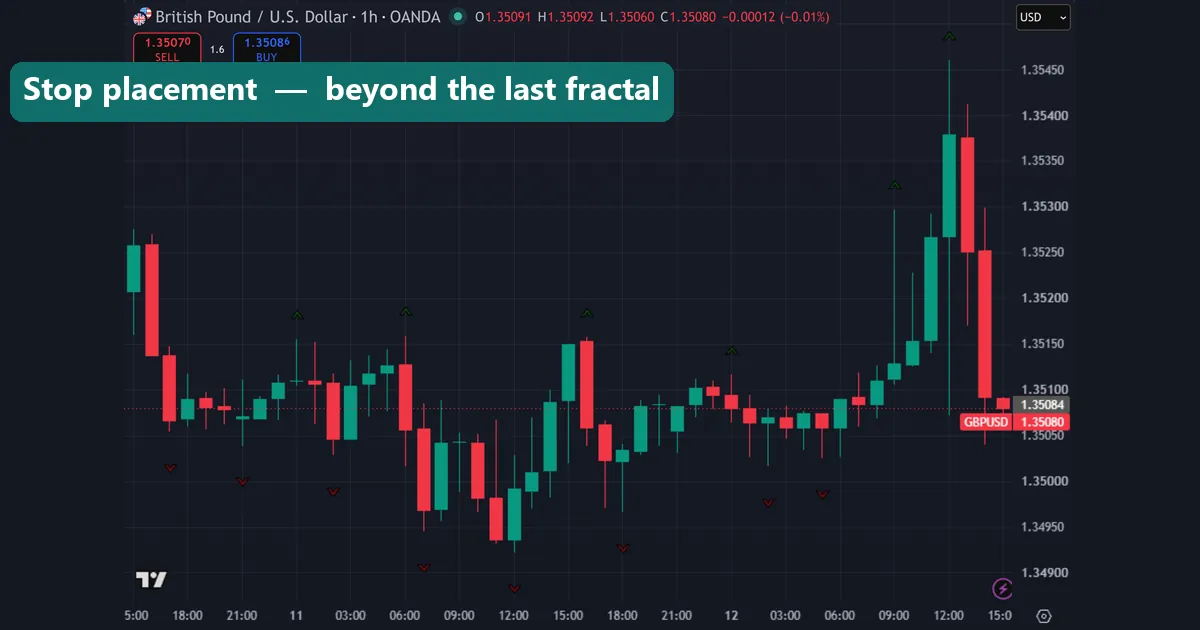
Four jobs cover almost everything fractals are good for. First, marking swing structure: the arrows give you objective highs and lows, so you stop guessing where a swing began. Second, stop placement — a stop beyond the last opposite fractal sits behind a level the market has already respected. Third, breakout triggers: a close beyond the most recent fractal level signals that the previous swing point has failed. Fourth, Fibonacci anchoring, because a retracement drawn between two confirmed fractals is repeatable rather than eyeballed.
That fourth use pairs neatly with projection work. Once you have anchored a retracement, the same fractal pair defines the leg for targets. Our walkthrough on how to draw a Fibonacci extension covers the exact drawing steps.
Fractal uses at a glance
| Use | What you look for | What it needs | Main risk |
|---|---|---|---|
| Swing marking | Sequence of up and down fractals | A clean timeframe, H1 or higher | Too many arrows on low timeframes |
| Stop placement | Last opposite fractal beyond entry | Volatility buffer such as ATR | Stop sits too tight in fast markets |
| Breakout trigger | Candle closing past the fractal level | Trend filter plus closed-bar rule | False breaks during quiet sessions |
| Structure read | Failure to make a new fractal high | Two confirmed fractals to compare | Two-bar confirmation delay |
| Fibonacci anchor | Confirmed fractal low to fractal high | A completed swing leg | Re-anchoring after every new fractal |
Add a volatility buffer to any fractal stop instead of parking it exactly on the wick. Our guide on how to use ATR as a stop loss covers the arithmetic in detail.
Combining fractals with a trend filter
On its own, a fractal says nothing about direction. Every swing high in a strong downtrend produces an up fractal, and buying each one is a fast way to lose money. So filter them. Bill Williams paired fractals with his Alligator — three smoothed moving averages representing the jaw, teeth and lips. His rule was straightforward: act on up fractals only when price sits above the Alligator’s teeth, and on down fractals only when price sits below.
A single 50 or 200-period moving average does much the same job with less clutter. Above the average, you only trade up-fractal breaks; below it, only down-fractal breaks. Momentum tools work as a second opinion too — check our notes on the best RSI indicator settings before stacking one underneath. Whichever filter you choose, apply it consistently, because selective filtering is just hindsight.
Where to find the Williams Fractal indicator
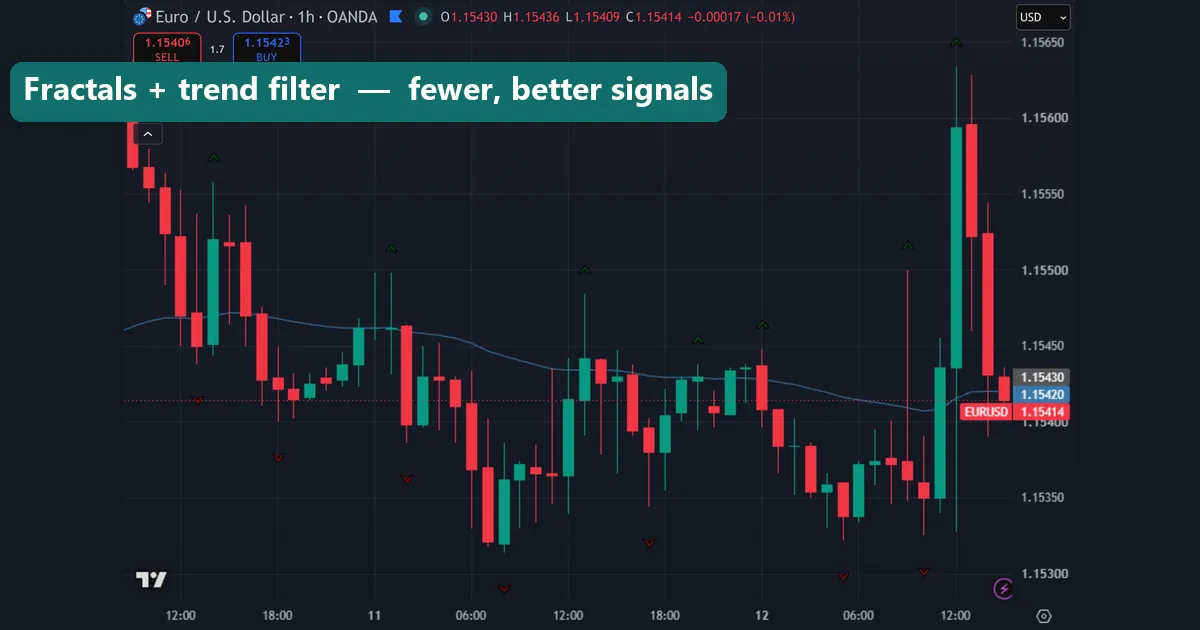
Good news: you do not need to download anything. The Fractals indicator ships with MetaTrader. In MT4, open Insert → Indicators → Bill Williams → Fractals. MT5 uses the same path, and both let you set the arrow colours in the properties dialog. TradingView carries it as “Williams Fractal” in the indicator search, where you can also change the periods input to widen the pattern.
Custom versions add alerts, higher-timeframe arrows or fractal-based channels. Those do need installing, and the steps for dropping any custom tool into your terminal are in our guide on how to install MT4 and MT5 indicators. Before you reach for a custom build, though, spend a week with the stock version — it does most of the work.
Download the complete indicator database
Put these concepts on your charts. One email unlocks the full library of 1,380+ indicators with compiled MT4 and MT5 files, plus my TradingView scripts. No paywall, no spam, unsubscribe any time.
Get free access to my indicator database
One email unlocks 1,380+ free MT4, MT5 and TradingView indicators — the complete library. No single-tool download; you get the whole database.
Common fractal mistakes
Three habits ruin most fractal setups. Trading every arrow is the first and worst. A busy M1 chart prints dozens of fractals per session, and most mark nothing but intraday noise. Forgetting the two-bar lag comes second. Traders backtest visually, see the arrow sitting perfectly at the swing top, and forget it only appeared two candles later. Chasing the level after the break is third. When price has already run 40 pips past the fractal, the edge has gone; wait for a retest instead.
One more habit deserves a mention. Fractals describe structure, not momentum, so pairing them with a second structure tool tells you nothing new. Combine them with something that measures a different thing entirely — trend, volatility or momentum.
Where to go next
Fractals sit on top of candlestick structure, so start there with our guide on how to read candlestick charts. If you trade intraday, the roundup of the best day trading technical indicators shows which filters pair well with fractal breaks. For background reading, Investopedia explains the fractal concept at Investopedia, and Wikipedia covers Bill Williams on Wikipedia, the trader who defined the pattern.
FAQ
What is a fractal in trading?
It is a five-bar pattern where the middle bar has the highest high, or the lowest low, of the five. The middle bar marks a local swing point, and MetaTrader draws a small arrow above or below it.
Do fractals repaint?
The confirmed arrows never move. However, the newest fractal stays provisional until the two bars to its right close, so an arrow on the current bar can still disappear. Judge signals on closed bars only.
Which timeframe works best for fractals?
H1 and above give the cleanest structure. Lower timeframes print far more arrows, and most of them mark noise rather than meaningful swings. Many traders read fractals on H4 and then execute on M15.
How do I place a stop loss using fractals?
Put the stop just beyond the last opposite fractal — below the most recent down fractal for a long, above the most recent up fractal for a short. Then add a small ATR buffer so ordinary volatility does not clip you.
Is the Williams Fractal indicator free?
Yes. It is built into MT4, MT5 and TradingView at no cost, so there is nothing to buy or install. Custom variants with alerts exist, but the stock indicator covers the core use cases.
Are fractal signals guaranteed to be profitable?
No. Fractals only describe structure that has already formed; they cannot predict what price does next. Trading involves risk, results are not guaranteed, and past performance is not indicative of future results.

About the author
Written by Dominic Walsh, a Forex trader and MT4/MT5 indicator, Expert Advisor and script developer. Every tool on forexmt4systems.com is tested on live charts before release and ships with ready-to-use compiled MT4 (.ex4) and MT5 (.ex5) files. Learn more about the trader and developer behind this site.
How we build, test and correct every tool: Editorial & Testing Policy. Trading carries risk; see the disclaimer.