
Most momentum readings net the two sides against each other and show you one number. The absolute strength indicator refuses to. It sums the rises over ten bars and the falls over the same ten, smooths each, and plots them as two lines you can watch move apart or together.
This build ships as a compiled .ex4 for MT4 and .ex5 for MT5; the screenshots below come from EURUSD H1.
| Platforms | MT4 (.ex4) + MT5 (.ex5) |
|---|---|
| Chart window | Separate window (levels 0) |
| Plots | 2: Bulls, Bears |
| Alerts | popup, push notification, email, sound |
| Inputs | 15 |
Which plots exist
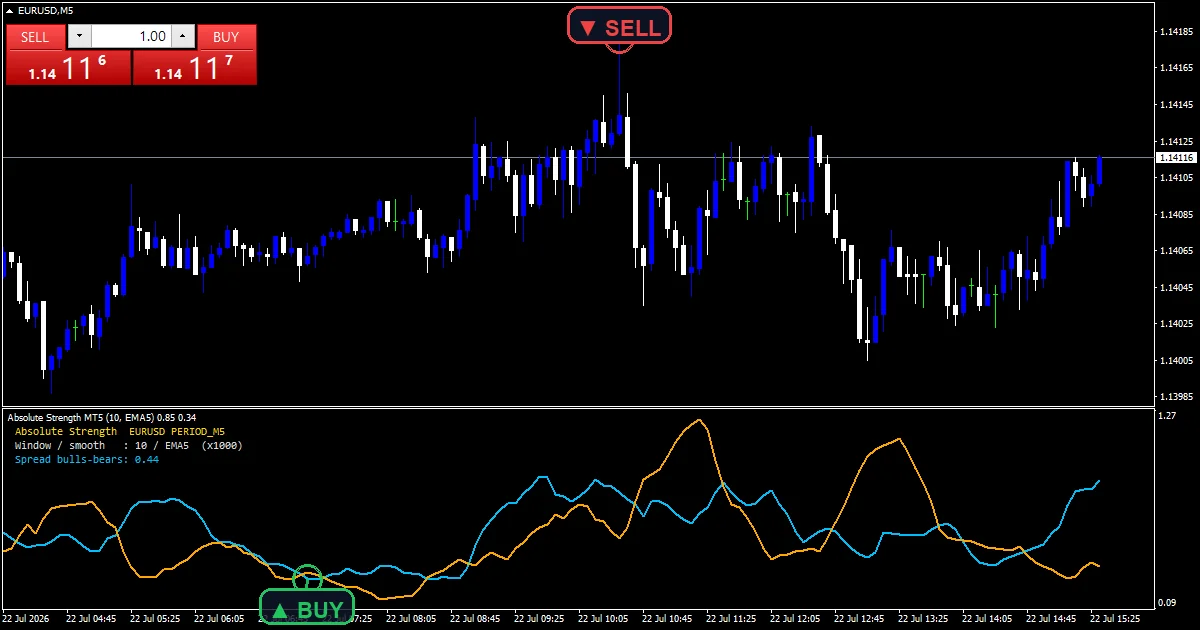
Two plots, in a pane below price.
`Bulls` traces deep sky blue at width 2.
`Bears` traces orange beside it.
A reference sits at zero beneath both.
`ShowNote` prints a settings label on the pane.
`NoteX` `12` and `NoteY` `16` place that label.
- Bulls: line, width 2
- Bears: line, width 2
Following the source
Two separate sums
`StrengthPeriod` `10` is the window for both. Bars that rose add to one running total and bars that fell add to the other, and neither total ever subtracts from the other.
Smoothing each side
`Smooth` `5` runs an exponential pass over each raw total. A plain average seeds it at the boundary, so both lines start from a real figure instead of climbing out of zero.
Making it readable
`DisplayScale` `1000.0` multiplies both lines identically. Raw sums on a currency pair are fractions of a pip and would otherwise draw flat against the zero reference.
Reading the plots
Both lines live above zero; neither goes negative.
The higher line names the side in control.
Lines pulling apart means one side is dominating.
Lines converging means the two are balancing.
A crossing is the reported event.
`MaxBars` `2000` limits how far back it draws.
Alert channels in this build: popup, push notification, email and sound, one message per closed bar.
`Bulls` crossing `Bears` is the reported event, and `EnableAlerts` governs whether it goes anywhere. `EnablePopup` is the route already open. The phone, the mail and the desktop audio behind `SoundFile` all begin closed, one message per closed bar.
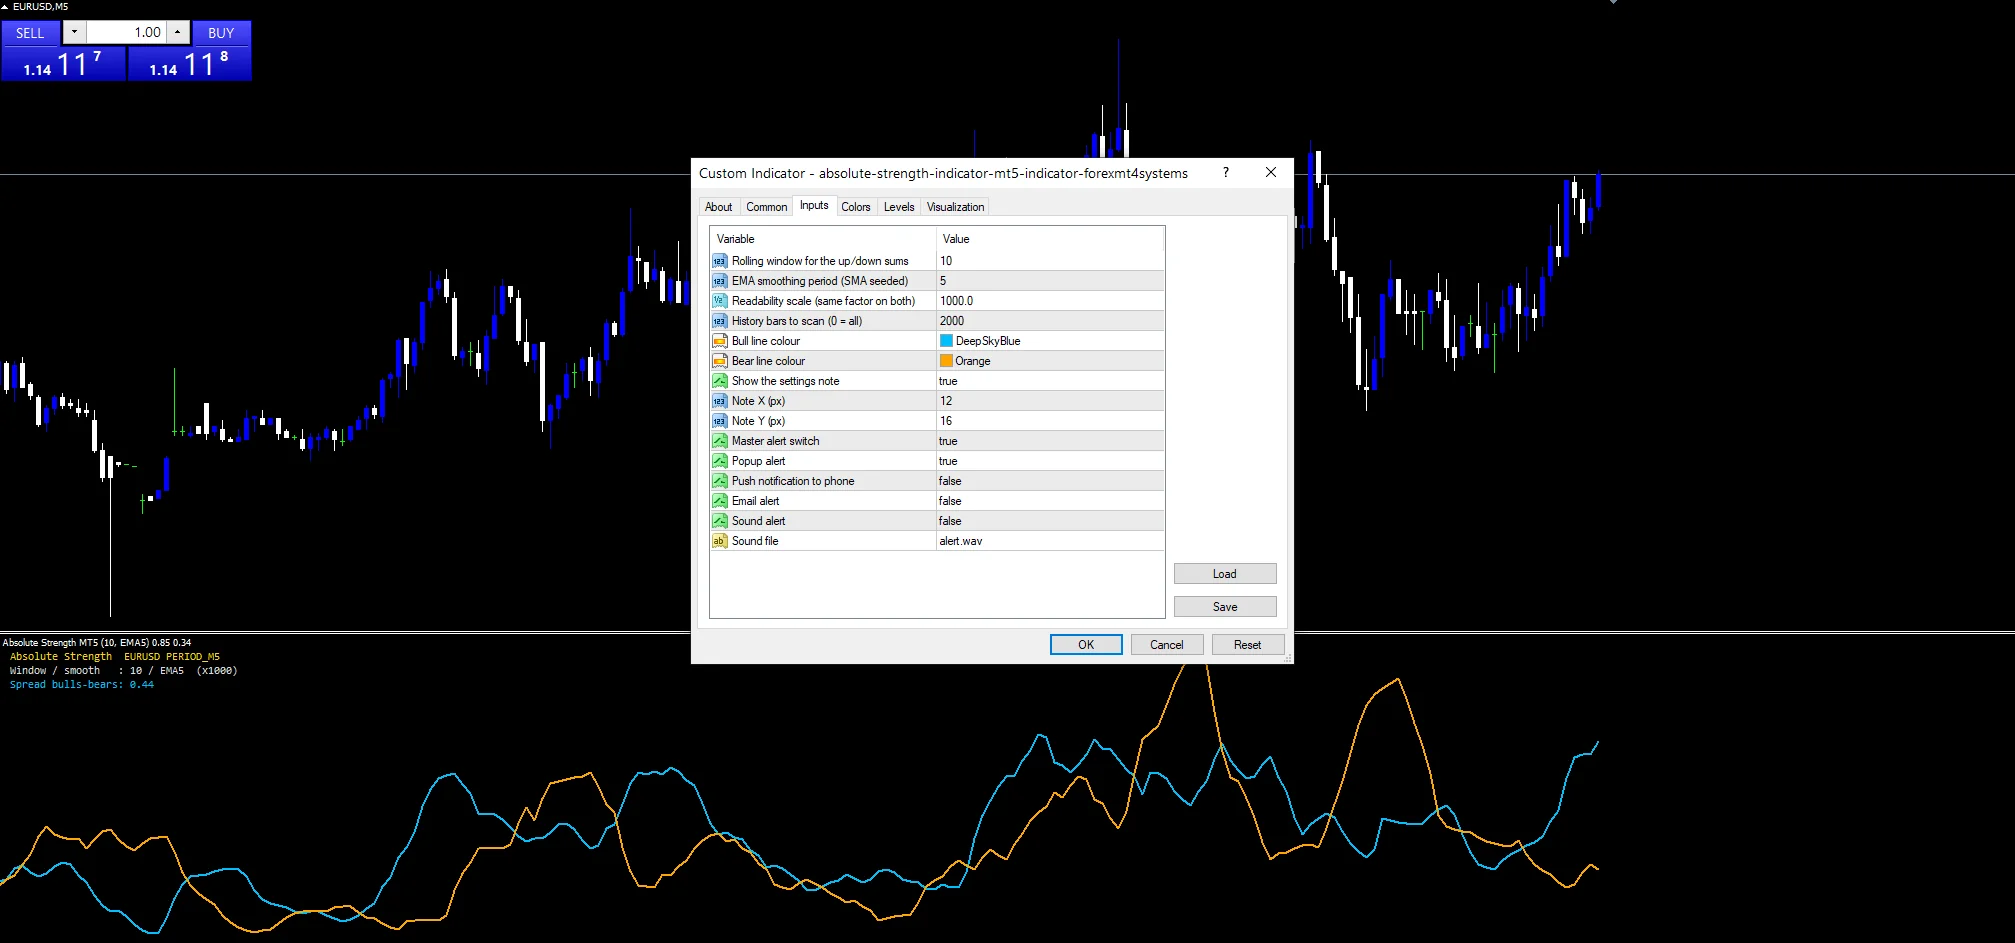
Every Absolute Strength Indicator input
Core settings
| Setting | What it does | Default |
|---|---|---|
StrengthPeriod |
Rolling window for the up/down sums. Window for both running sums, `10`. | 10 |
Smooth |
EMA smoothing period (SMA seeded). Exponential pass over each, `5`. | 5 |
Display settings
| Setting | What it does | Default |
|---|---|---|
DisplayScale |
Readability scale (same factor on both). Identical multiplier on both lines, `1000.0`. | 1000.0 |
BullColor |
Bull line colour. | deep sky blue |
BearColor |
Bear line colour. | orange |
Alert settings
| Setting | What it does | Default |
|---|---|---|
MaxBars |
History bars to scan (0 = all). History drawn, `2000`. | 2000 |
ShowNote |
Show the settings note. Print the settings label, `true`. | on |
NoteX |
Note X (px). | 12 |
NoteY |
Note Y (px). | 16 |
EnableAlerts |
Master alert switch. Governs the crossing message, `true`. | on |
EnablePopup |
Popup alert. A popup box is the default route, `true`. | on |
EnablePushNotify |
Push notification to phone. The phone route, `false`. | off |
EnableEmail |
Email alert. The mail route, `false`. | off |
EnableSound |
Sound alert. | off |
SoundFile |
Sound file. Audio file for it, `”alert.wav”`. | alert.wav |
Where it earns its keep
Ten bars is quick, and the smoothing pass is what makes the pair readable. EURUSD H1 is the reference chart, where the lines cross a few times a week. Faster charts cross constantly. On D1 a single dominance run can hold for a month.
The rough edges
Two lines both above zero take practice to read.
A crossing says the balance tipped, nothing more.
Ten bars is short enough to respond to one candle.
The scale factor makes values incomparable across symbols.
Copy the compiled Absolute Strength Indicator file into your MQL4/Indicators folder, and the MT5 build into MQL5/Indicators, then restart the terminal and drag it onto a chart. The step-by-step guide with screenshots is at how to install MT4 and MT5 indicators.
Download the Absolute Strength Indicator for MT4 and MT5
The zip holds the compiled Absolute Strength Indicator build for MT4 and MT5, plus a short README. Compiled files only, no source. Enter your email below and the download link arrives in your inbox.
Download this indicator free
Enter your email and the file is yours. You also get the full MT4 and MT5 library.
FAQ
Why are the Bulls and Bears lines never negative?
Because each sums only the bars that moved its own way. Rises go into one total and falls into the other, so neither can fall below zero no matter how one-sided the market becomes.
What does Smooth 5 do to the raw sums?
It runs an exponential pass over each one, seeded with a plain average at the warm-up boundary. Without it the two lines would jump bar to bar and crossings would be far too frequent to act on.
Why is DisplayScale set as high as 1000.0?
Because the raw sums are fractions of a pip on a currency pair. Multiplying both lines by the same factor makes the pane readable without changing which one sits above the other at any moment.
What is the note that ShowNote prints?
A small settings label drawn on the pane itself, positioned by the two coordinate inputs. It is a display convenience so you can read the current period off the chart rather than reopening the panel.
Are results guaranteed?
No. Trading involves risk. Results are not guaranteed; past performance is not indicative of future results. Use the Absolute Strength Indicator as one input. Always backtest before trading live.
Authoritative references
- Learn more about technical indicators.

About the author
Written by Dominic Walsh, a Forex trader and MT4/MT5 indicator, Expert Advisor and script developer. Every tool on forexmt4systems.com is tested on live charts before release and ships with ready-to-use compiled MT4 (.ex4) and MT5 (.ex5) files. Learn more about the trader and developer behind this site.
How we build, test and correct every tool: Editorial & Testing Policy. Trading carries risk; see the disclaimer.