
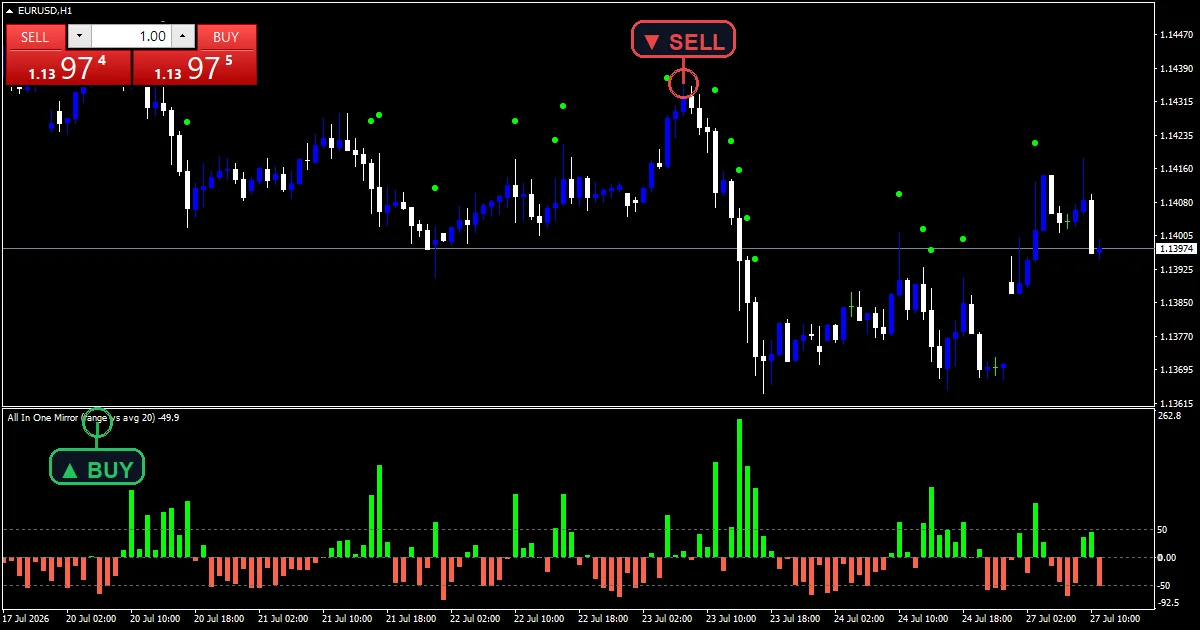
One question, asked of every bar: is this candle bigger or smaller than usual? The all in one mirror indicator answers it as a percentage against a twenty-bar average range, draws that as a two-sided histogram, and drops a marker on the price chart when a bar clears the threshold.
This build ships as a compiled .ex4 for MT4 and .ex5 for MT5; the screenshots below come from EURUSD H1.
| Platforms | MT4 (.ex4) + MT5 (.ex5) |
|---|---|
| Chart window | Separate window (levels 0) |
| Plots | 2: Expansion %, Contraction % |
| Alerts | none |
| Inputs | 8 |
Which plots exist
Two histogram plots plus chart markers.
`Expansion %` fills lime at width 3.
`Contraction %` fills tomato at the same width.
A reference sits at zero between them.
Markers land on price using `MarkArrowCode` `159`.
`MaxMarks` `40` limits how many are kept.
- Expansion %: histogram, width 3
- Contraction %: histogram, width 3
Inside the calculation
The reference range
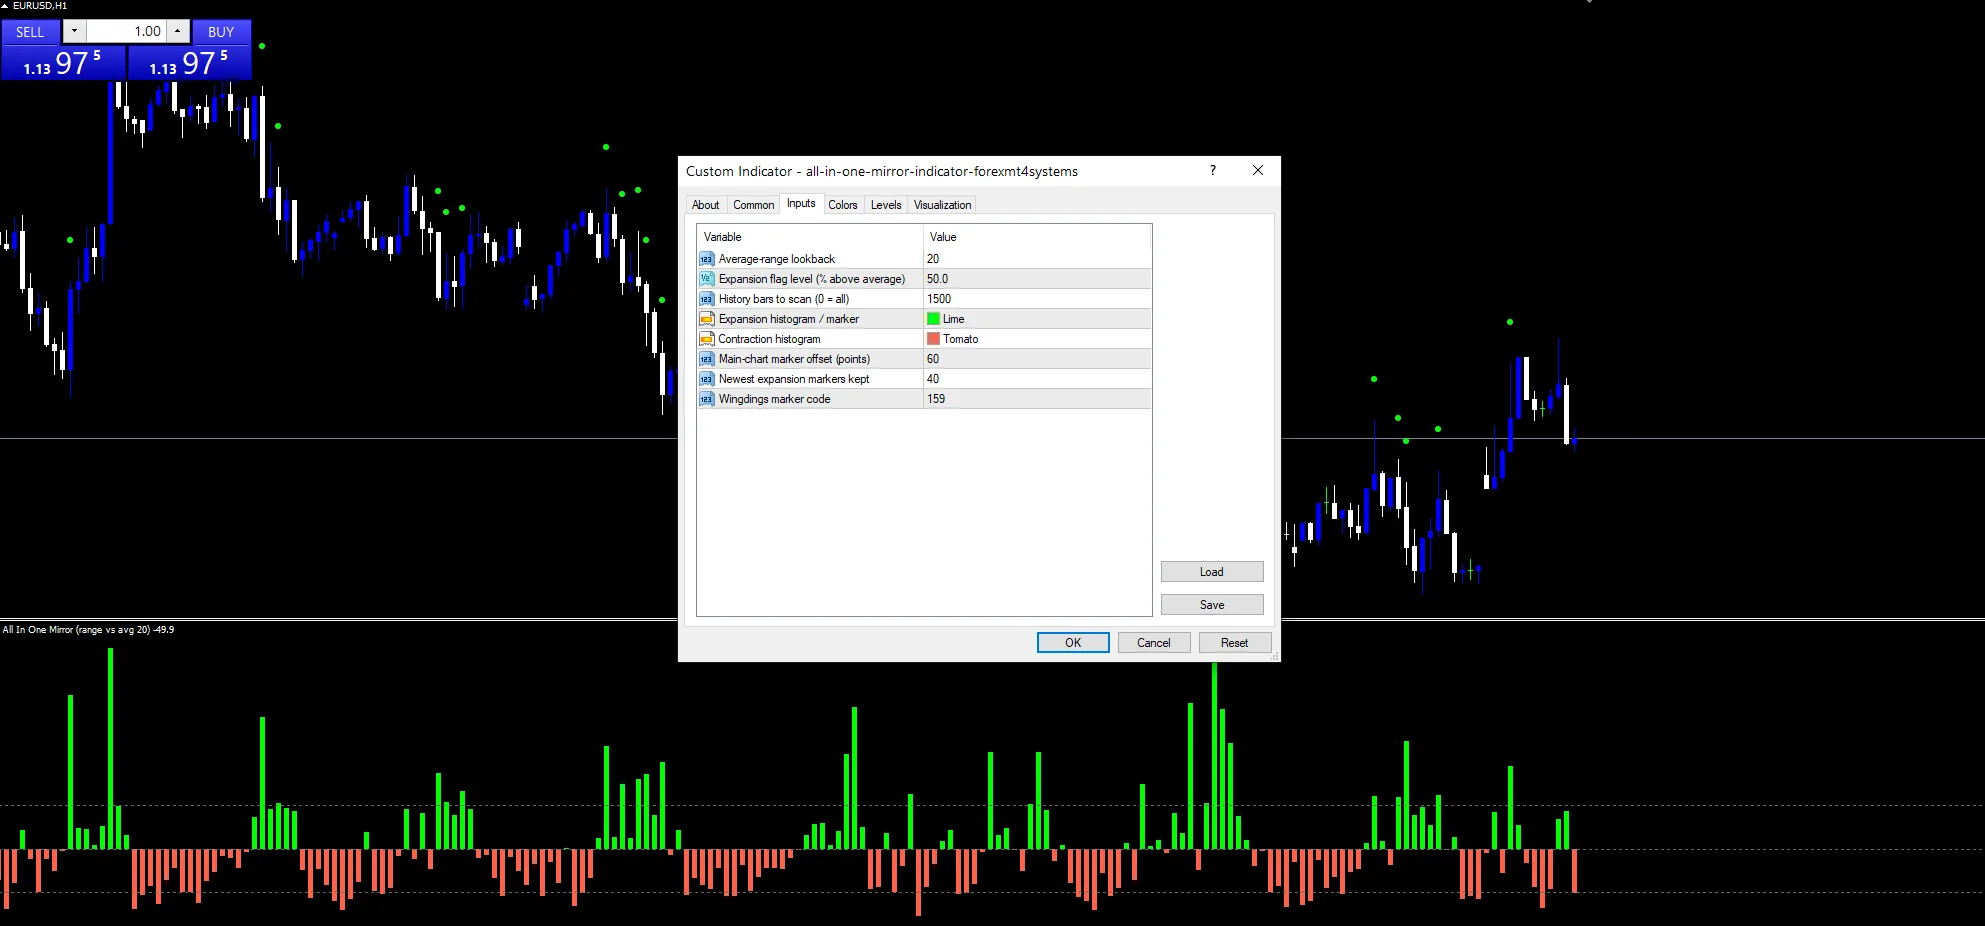
`RangePeriod` `20` averages high minus low across twenty bars. That figure is what every later comparison is made against, and it updates on every bar.
Turning it into a percentage
The bar’s own range less the average, divided by the average, times a hundred. A bar twice the usual size reads a hundred; a bar half the size reads minus fifty.
Marking the big ones
`ExpandThreshold` `50.0` is the gate for a chart marker. Clear it and a marker is placed `MarkOffsetPts` `60` points above the bar.
Making it useful
Lime columns are bars larger than recent average.
Tomato columns, by contrast, are bars smaller than it.
Column height is a percentage, not a price.
So a run of tomato means the market is compressing.
Meanwhile markers flag only bars past the threshold.
`MaxBars` `1500` limits how far back it draws.
Nothing here speaks to you. This build carries no message inputs whatsoever, so everything it has to report happens on the chart: the histogram gives every bar a column, and `ExpandThreshold` `50.0` decides which bars also earn a marker above price.
Every All In One Mirror Indicator input
Core settings
| Setting | What it does | Default |
|---|---|---|
RangePeriod |
Average-range lookback. Bars in the reference average, `20`. | 20 |
ExpandThreshold |
Expansion flag level (% above average). Percentage a bar must clear for a marker, `50.0`. | 50.0 |
MarkOffsetPts |
Main-chart marker offset (points). Gap between a marker and its bar, `60`. | 60 |
MaxMarks |
Newest expansion markers kept. Newest markers kept on the chart, `40`. | 40 |
Display settings
| Setting | What it does | Default |
|---|---|---|
ExpandColor |
Expansion histogram / marker. Tint for the upper columns, `clrLime`. | lime |
ContractColor |
Contraction histogram. Tint for the lower ones, `clrTomato`. | tomato |
MarkArrowCode |
Wingdings marker code. Wingdings symbol used, `159`. | 159 |
Alert settings
| Setting | What it does | Default |
|---|---|---|
MaxBars |
History bars to scan (0 = all). History drawn, `1500`. | 1500 |
Choosing a timeframe
Range expansion means most on charts where sessions differ in character. EURUSD H1 is the reference chart, where the London open regularly clears the threshold. On M5 the readings are noisy. On D1 a fifty percent bar is a genuinely large day.
What it gets wrong
A large bar is a description, not a direction.
The average moves, so the comparison keeps shifting.
Nothing here says which way the big bar went.
Forty markers is all the chart will ever hold.
Copy the compiled All In One Mirror Indicator file into your MQL4/Indicators folder, and the MT5 build into MQL5/Indicators, then restart the terminal and drag it onto a chart. The step-by-step guide with screenshots is at how to install MT4 and MT5 indicators.
Background reading on the method behind the All In One Mirror Indicator: Volatility (finance) on Wikipedia, Volatility at Investopedia.
Download the All In One Mirror Indicator for MT4 and MT5
The zip holds the compiled All In One Mirror Indicator build for MT4 and MT5, plus a short README. Compiled files only, no source. Enter your email below and the download link arrives in your inbox.
Download this indicator free
Enter your email and the file is yours. You also get the full MT4 and MT5 library.
FAQ
What percentage does the Expansion % column show?
How far the bar’s range sits above the twenty-bar average, as a percentage of that average. A bar half again as large as usual reads fifty, which is also where the marker threshold sits by default.
Does ExpandThreshold 50.0 affect the histogram?
No, only the chart markers. Every bar still gets a column whatever its size; the threshold decides which of them additionally earns a symbol above the candle on the price chart.
Why does MaxMarks 40 cap the markers?
Because each one is a chart object and a long history would accumulate hundreds. Keeping the newest forty means the markers describe recent trade rather than filling the chart with old ones.
What does MarkArrowCode 159 change on the chart?
The symbol drawn above a qualifying bar. It is a Wingdings code, so swapping the number swaps the shape; the default is the small filled dot, which stays legible without covering the candle behind it.
Are results guaranteed?
No. Trading involves risk. Results are not guaranteed; past performance is not indicative of future results. Use the All In One Mirror Indicator as one input. Always backtest before trading live.
External references
- The core method is documented in Mirror trading on Wikipedia.
- Additional market context is at Cvr3 Vix Market Timing at StockCharts ChartSchool.

About the author
Written by Dominic Walsh, a Forex trader and MT4/MT5 indicator, Expert Advisor and script developer. Every tool on forexmt4systems.com is tested on live charts before release and ships with ready-to-use compiled MT4 (.ex4) and MT5 (.ex5) files. Learn more about the trader and developer behind this site.
How we build, test and correct every tool: Editorial & Testing Policy. Trading carries risk; see the disclaimer.