
The better dynamic liquidity heatmap profile indicator answers where trading happened, not when. It splits the recent range into horizontal bins and totals the volume that traded inside each one. The busiest bin gets marked.
This build ships as a compiled .ex4 for MT4 and .ex5 for MT5; the screenshots below come from EURUSD H1.
| Platforms | MT4 (.ex4) + MT5 (.ex5) |
|---|---|
| Chart window | Main price chart |
| Plots | 0 |
| Alerts | none |
| Inputs | 9 |
A look at the plots
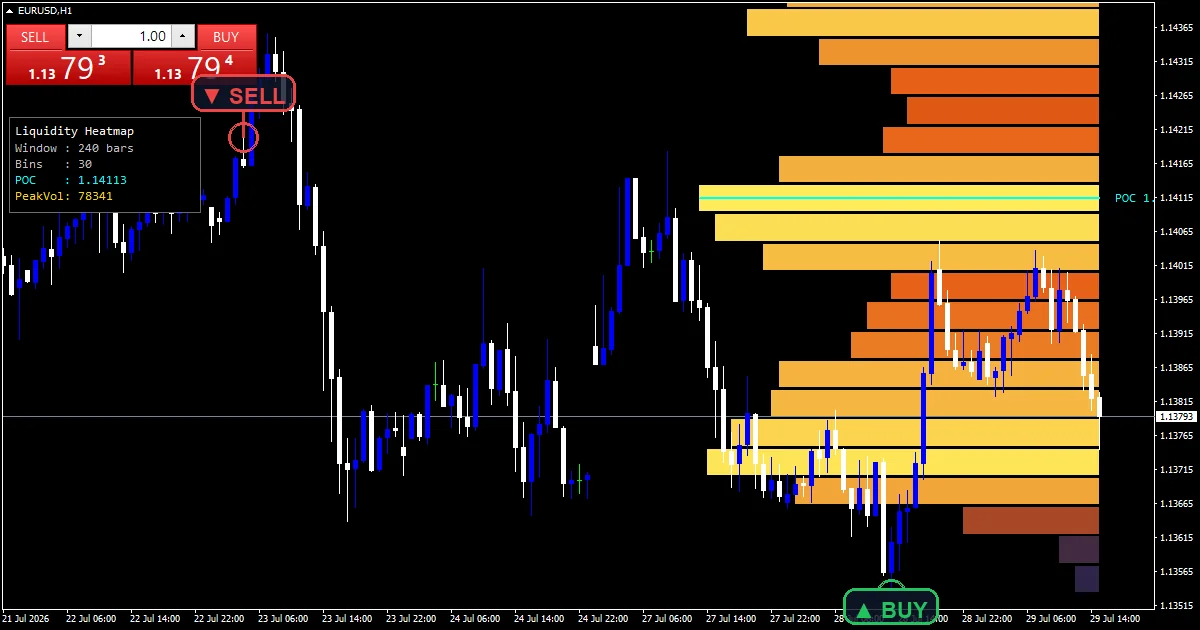
Filled rectangles pin to the right edge, one per price bin.
Bar length shows volume at that price, and colour runs cool to hot.
`InpPocColor` `clrAqua` marks the busiest bin with a line and a price tag.
A corner panel summarises the profile, and no plot buffers exist.
What happens on each bar
Bins first
The high and low across `InpLookback` `240` bars set the span. `InpBins` `30` divides that span into equal price slices. Every slice then collects volume.
Spreading beats bucketing
`InpSpreadRange` `true` shares each bar’s volume across every bin its own range touched. Switch it off and the whole bar lands in the bin holding its typical price. Spreading gives a smoother, fairer profile.
Length and colour both encode volume
The fullest bin gets `InpMaxWidth` `50` bars of length, and the rest scale against it. Colour runs from dark blue for thin liquidity to yellow for heavy. So the shape reads at a glance.
How to interpret it
A long hot bar marks a price the market kept returning to.
Thin bins mark prices that traded through quickly.
The point of control is the single busiest price in the window.
`InpBinGapPct` `10` leaves a gap between bins so they read as separate rows.
This build ships no alerts at all. There is no master switch, no popup, no phone route, no mail and no sound. It is a drawing tool that recomputes once per new bar, so anything you want to act on has to be watched by eye.
Every Better Dynamic Liquidity HeatMap Profile Indicator input
Core settings
| Setting | What it does | Default |
|---|---|---|
InpLookback |
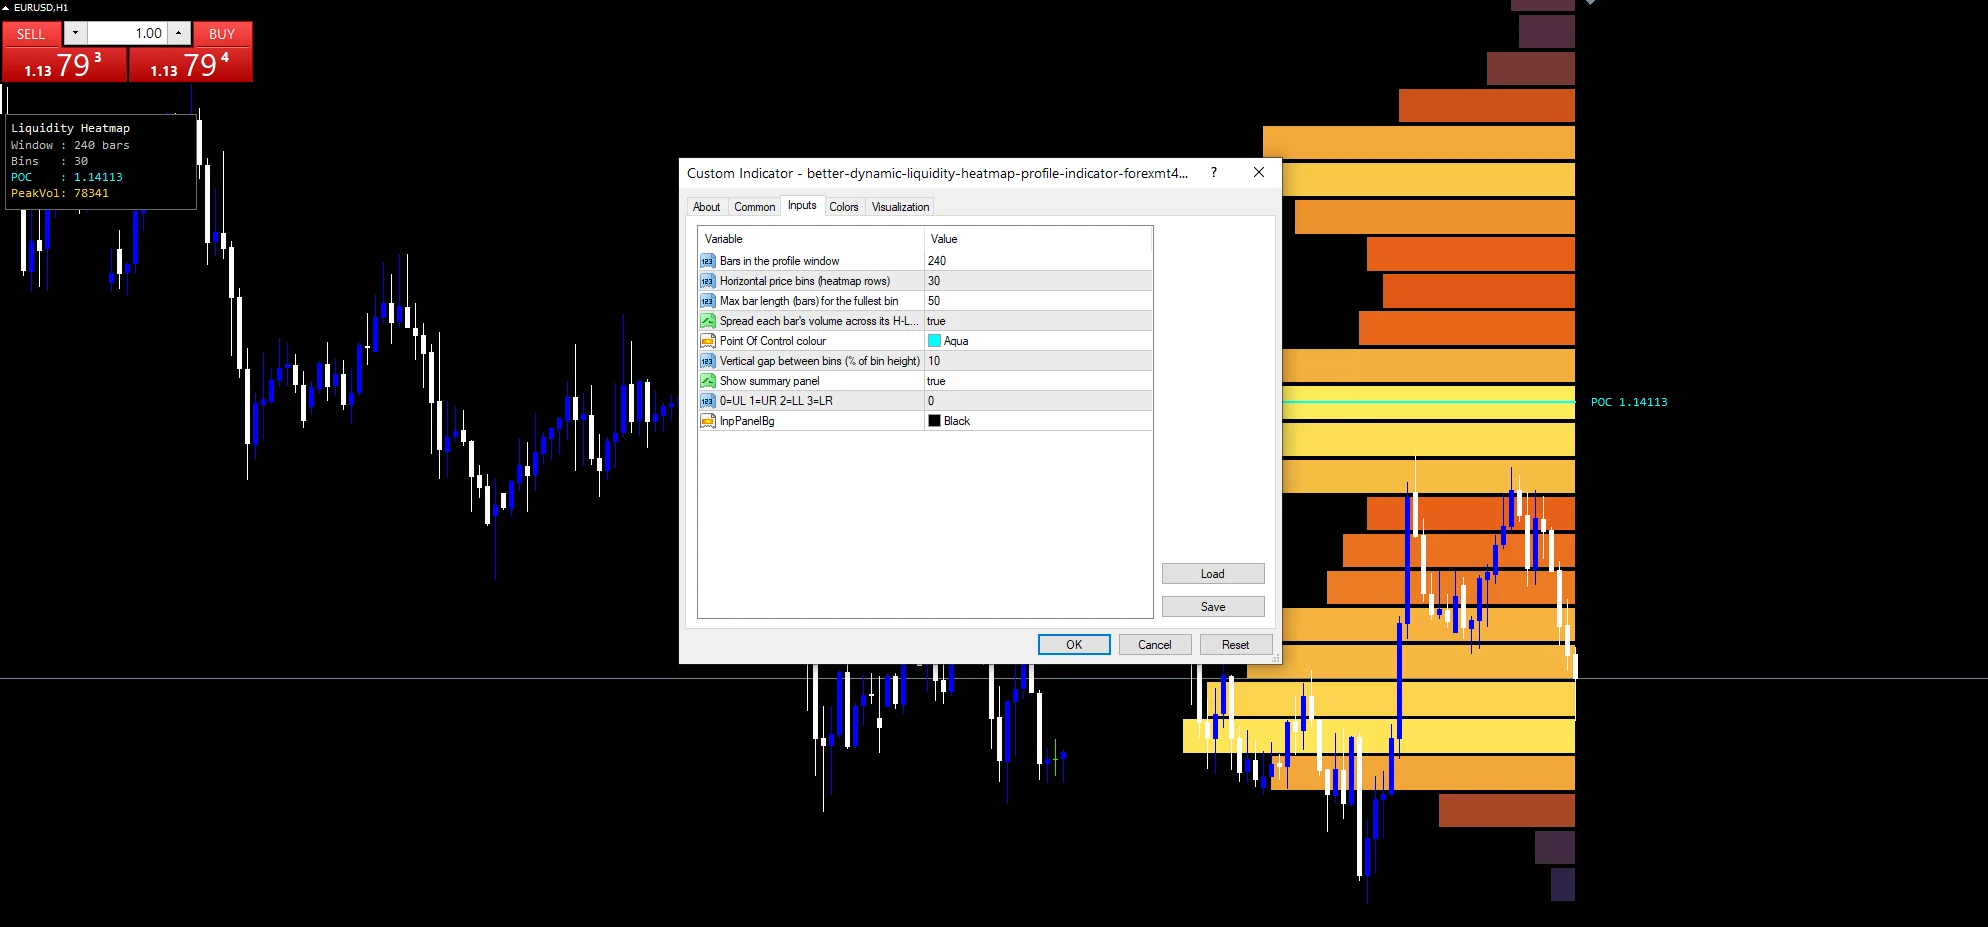
Bars in the profile window. Bars in the profile window, default `240`. | 240 |
InpBins |
Horizontal price bins (heatmap rows). Horizontal price slices, default `30`. | 30 |
InpSpreadRange |
Spread each bar’s volume across its H-L range. Share each bar across the bins its range touched, default `true`. | on |
InpBinGapPct |
Vertical gap between bins (% of bin height). Gap between bins as a percent of bin height, default `10`. | 10 |
Display settings
| Setting | What it does | Default |
|---|---|---|
InpMaxWidth |
Max bar length (bars) for the fullest bin. Length of the fullest bin, in bars, default `50`. | 50 |
InpPocColor |
Point Of Control colour. Colour of the busiest bin marker, default `clrAqua`. | aqua |
InpShowPanel |
Show summary panel. Show the summary readout, default `true`. | on |
InpPanelCorner |
0=UL 1=UR 2=LL 3=LR. Corner the readout uses, default `0`. | 0 |
InpPanelBg |
Readout background colour, default `clrBlack`. | black |
Matching it to your chart
A profile needs enough bars to fill its bins. EURUSD H1 is the reference chart, where `InpLookback` `240` covers about ten days. On M5 the same count is under a day. Higher timeframes give a broader, slower map.
Where care is needed
Forex tick volume counts price updates rather than contracts, and brokers differ.
The profile recomputes once per bar, so it never reflects the forming candle.
Thirty bins across a wide range makes each slice coarse.
Copy the compiled Better Dynamic Liquidity HeatMap Profile Indicator file into your MQL4/Indicators folder, and the MT5 build into MQL5/Indicators, then restart the terminal and drag it onto a chart. The step-by-step guide with screenshots is at how to install MT4 and MT5 indicators.
Background reading on the method behind the Better Dynamic Liquidity HeatMap Profile Indicator: Market manipulation on Wikipedia, Shootingstar at Investopedia.
Download the Better Dynamic Liquidity HeatMap Profile Indicator for MT4 and MT5
The zip holds the compiled Better Dynamic Liquidity HeatMap Profile Indicator build for MT4 and MT5, plus a short README. Compiled files only, no source. Enter your email below and the download link arrives in your inbox.
Download this indicator free
Enter your email and the file is yours. You also get the full MT4 and MT5 library.
FAQ
What does InpSpreadRange true change?
It shares each bar’s volume across every bin the bar’s high to low range covered. Switching it off drops the whole bar into one bin at its typical price, which makes the profile blockier and less faithful to wide bars.
How does InpBins 30 affect the reading?
It sets how finely the range gets sliced. More bins give a detailed profile that needs a taller chart to read. Fewer bins give broad zones. Thirty is a compromise that suits most screens.
What does the InpPocColor marker show?
The point of control, meaning the single price bin that accumulated the most volume in the window. It is the price the market spent most effort at, which is why it gets its own line and tag.
Does InpLookback 240 include the current bar?
Yes, but the whole profile only recomputes when a new bar opens. So the forming candle contributes nothing until it closes, and the map you see always describes completed bars.
Are results guaranteed?
No. Trading involves risk. Results are not guaranteed; past performance is not indicative of future results. Use the Better Dynamic Liquidity HeatMap Profile Indicator as one input. Always backtest before trading live.
External references
- For background on this concept, see Market manipulation on Wikipedia.
- For broader market context, see Shootingstar at Investopedia.

About the author
Written by Dominic Walsh, a Forex trader and MT4/MT5 indicator, Expert Advisor and script developer. Every tool on forexmt4systems.com is tested on live charts before release and ships with ready-to-use compiled MT4 (.ex4) and MT5 (.ex5) files. Learn more about the trader and developer behind this site.
How we build, test and correct every tool: Editorial & Testing Policy. Trading carries risk; see the disclaimer.