
This build pairs two ideas. A triangular moving average with ATR bands frames where price usually trades, and John Ehlers’ center of gravity oscillator flags turning points early. The TMA + center of gravity indicator draws the bands on price and marks the bar where the oscillator makes a trough or a peak.
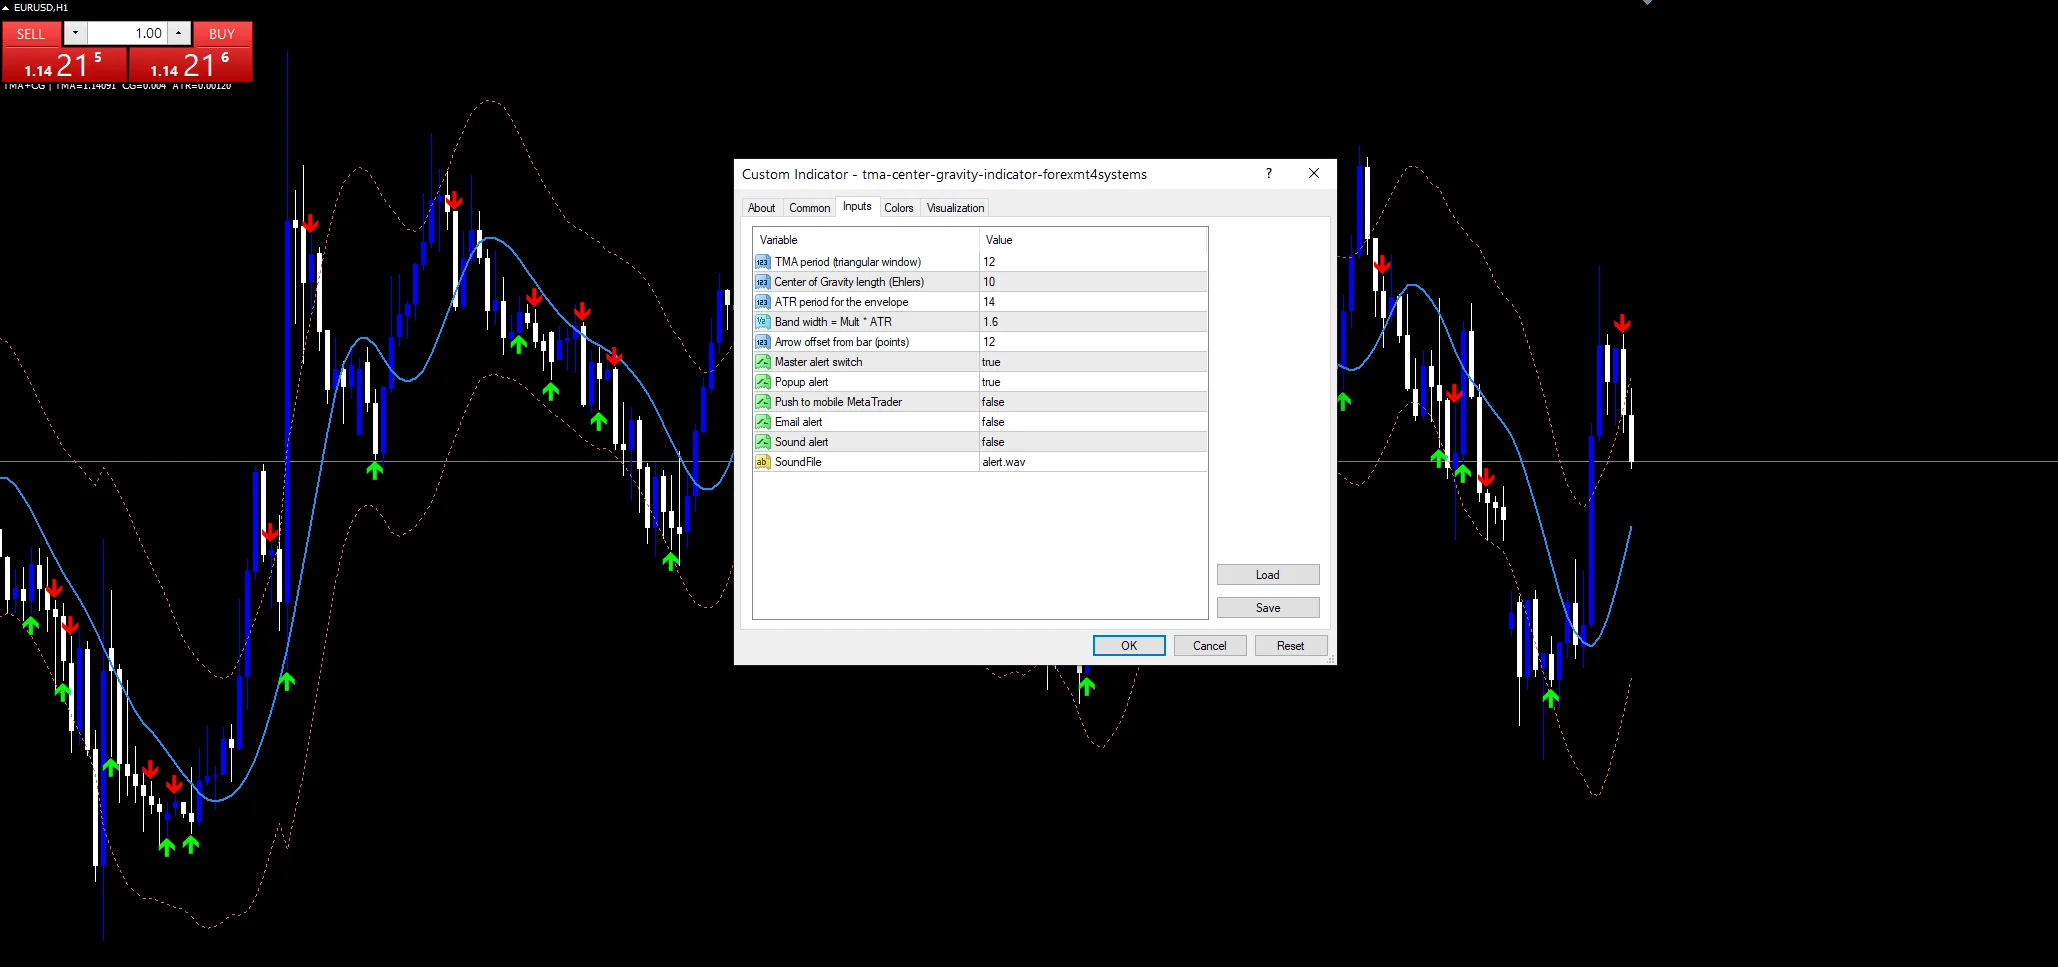
This build ships as a compiled .ex4 for MT4 and .ex5 for MT5; the screenshots below come from EURUSD H1.
| Platforms | MT4 (.ex4) + MT5 (.ex5) |
|---|---|
| Chart window | Main price chart |
| Plots | 5: TMA, TMA Upper, TMA Lower, CG Buy, CG Sell |
| Alerts | popup, push notification, email, sound |
| Inputs | 11 |
What the TMA + Center of Gravity Indicator draws on the chart
A line, two bands and two marks on price.
`TMA` runs dodger blue at width 2.
`TMA Upper` and `TMA Lower` run tomato.
`CG Buy` prints lime at an oscillator trough.
`CG Sell` prints red at an oscillator peak.
`ArrowGapPts` `12` sets the mark gap.
- TMA: line, dodger blue, width 2
- TMA Upper: line, tomato, width 1
- TMA Lower: line, tomato, width 1
- CG Buy: arrow, lime, width 2, arrow code 233
- CG Sell: arrow, red, width 2, arrow code 234

Inside the calculation
Triangular average
`TmaPeriod` `12` averages a simple average of the median price again. The result is a smooth centre line.
Bands
`BandMult` `1.6` times an `AtrPeriod` `14` range sits on each side of the TMA.
Center of gravity
`CgPeriod` `10` weights recent median prices by position, as Ehlers described. A trough prints a buy and a peak prints a sell.
What the output means
Price near the upper band is stretched up.
Price near the lower band is stretched down.
Marks show oscillator turns, not band touches.
Turns come often, so marks are frequent.
Marks on the forming bar never appear.
Warm-up needs about twenty-five bars.
Alert channels in this build: popup, push notification, email and sound, one message per closed bar.
Oscillator turns report once per closed bar under `EnableAlerts`; the popup is on, the other routes off.
Every TMA + Center of Gravity Indicator input
Core settings
| Setting | What it does | Default |
|---|---|---|
TmaPeriod |
TMA period (triangular window). Length of the triangular average, `12`. | 12 |
CgPeriod |
Center of Gravity length (Ehlers). Center of gravity window, `10`. | 10 |
AtrPeriod |
ATR period for the envelope. Range window for the bands, `14`. | 14 |
BandMult |
Band width = Mult * ATR. Band width in ranges, `1.6`. | 1.6 |
Display settings
| Setting | What it does | Default |
|---|---|---|
ArrowGapPts |
Arrow offset from bar (points). Mark gap in points, `12`. | 12 |
Alert settings
| Setting | What it does | Default |
|---|---|---|
EnableAlerts |
Master alert switch. Master alert switch, `true`. | on |
EnablePopup |
Popup alert. Popup, `true`. | on |
EnablePushNotify |
Push to mobile MetaTrader. Phone route, `false`. | off |
EnableEmail |
Email alert. Email route, `false`. | off |
EnableSound |
Sound alert. Speaker, `false`. | off |
SoundFile |
(see inputs panel) | alert.wav |
Picking a chart for it
A fast oscillator with slow bands suits intraday charts. The hourly EURUSD screenshot shows several marks a day. On M15 read marks near the bands only. On H4 each turn is a swing to note.
When not to trust the output
The oscillator turns often, so many marks are noise.
Marks ignore where price sits in the bands.
ATR bands widen late after spikes.
Only the popup route starts enabled.
Copy the compiled TMA + Center of Gravity Indicator file into your MQL4/Indicators folder, and the MT5 build into MQL5/Indicators, then restart the terminal and drag it onto a chart. The step-by-step guide with screenshots is at how to install MT4 and MT5 indicators.
Download the TMA + Center of Gravity Indicator for MT4 and MT5
The zip holds the compiled TMA + Center of Gravity Indicator build for MT4 and MT5, plus a short README. Compiled files only, no source. Enter your email below and the download link arrives in your inbox.
Download this indicator free
Enter your email and the file is yours. You also get the full MT4 and MT5 library.
FAQ
What does CgPeriod 10 measure?
Where the weight of the last ten median prices sits. Ehlers built it so the line turns close to price turning points, with less lag than most averages.
Do CG Buy marks need the lower band?
No. They mark every trough of the oscillator, wherever price sits. Many traders only act on marks near the lower band, where price is already stretched down and a turn matters more.
Why use BandMult 1.6 on the TMA?
It places each band about one and a half average ranges from the centre line. Most bars stay inside, so a close outside the band shows unusual stretch worth noticing.
How is the TMA line built?
It averages the median price over twelve bars, then averages that result again. The double pass gives a smooth line that bends less often than a single average.
Are results guaranteed?
No. Trading involves risk. Results are not guaranteed; past performance is not indicative of future results. Use the TMA + Center of Gravity Indicator as one input. Always backtest before trading live.
Category: this is part of our Signal and Forecast collection. Browse more Signal and Forecast for MetaTrader, or explore every MT4 indicator and MT5 indicator on the site.
External references
- The core method is documented in Currency manipulator on Wikipedia.
- Additional market context is at Elder Impulse System at StockCharts ChartSchool.

About the author
Written by Dominic Walsh, a Forex trader and MT4/MT5 indicator, Expert Advisor and script developer. Every tool on forexmt4systems.com is tested on live charts before release and ships with ready-to-use compiled MT4 (.ex4) and MT5 (.ex5) files. Learn more about the trader and developer behind this site.
How we build, test and correct every tool: Editorial & Testing Policy. Trading carries risk; see the disclaimer.