
Harmonic pattern trading looks for five-point price structures — labelled X, A, B, C and D — whose legs land inside specific Fibonacci ratios. Only when each leg measures within tolerance does the shape count as a valid harmonic pattern. The payoff is a defined zone where a reversal is expected, plus a stop that sits just beyond the structure. This guide covers the four core patterns and their exact ratios. It also shows how the reversal zone is built, how to structure the trade, and the limitations you should know first.
What harmonic patterns are
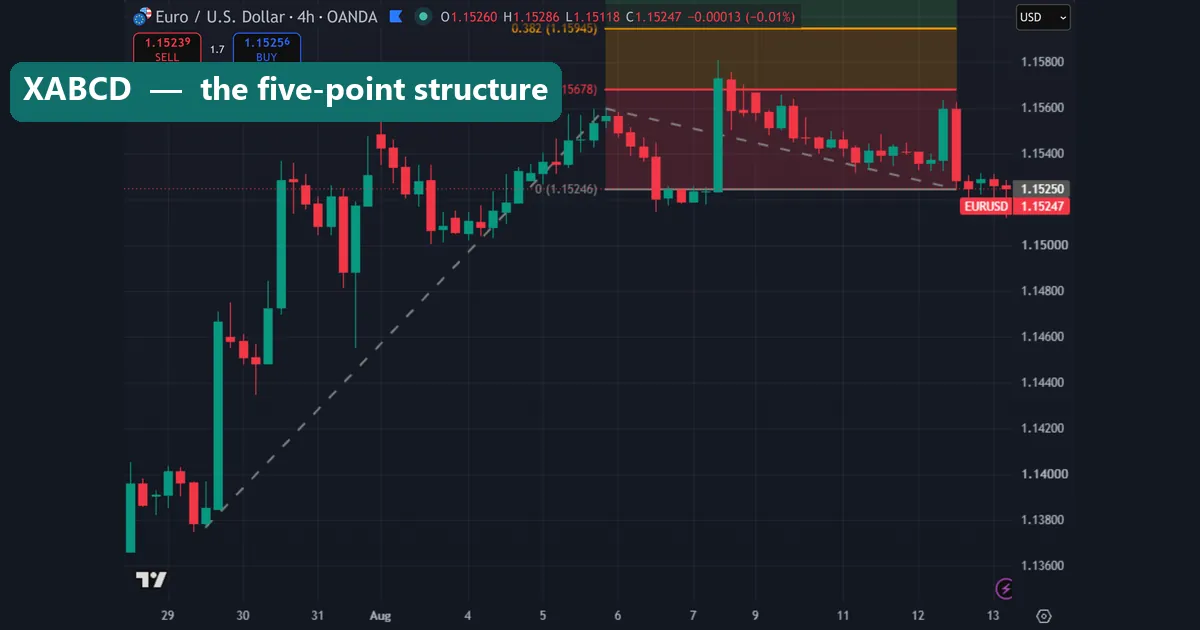
Harmonic patterns are geometric price structures measured with Fibonacci ratios. Scott Carney formalised most of them in the 1990s, building on H.M. Gartley’s earlier work. The core claim is simple. Swings often retrace and extend by repeating proportions. A structure whose legs match them marks a place where price may turn.
Every pattern shares the same skeleton. XA is the initial impulse leg. AB retraces part of XA. BC retraces part of AB. Then CD travels to point D, which is where you actually trade. So the pattern is a measurement exercise, not a drawing exercise.
One rule separates harmonics from ordinary chart patterns: the ratios are mandatory. Say a shape looks like a Gartley, but its B point sits at 0.5 rather than 0.618. That is not a Gartley — it is a different pattern, or nothing at all.
The Gartley pattern
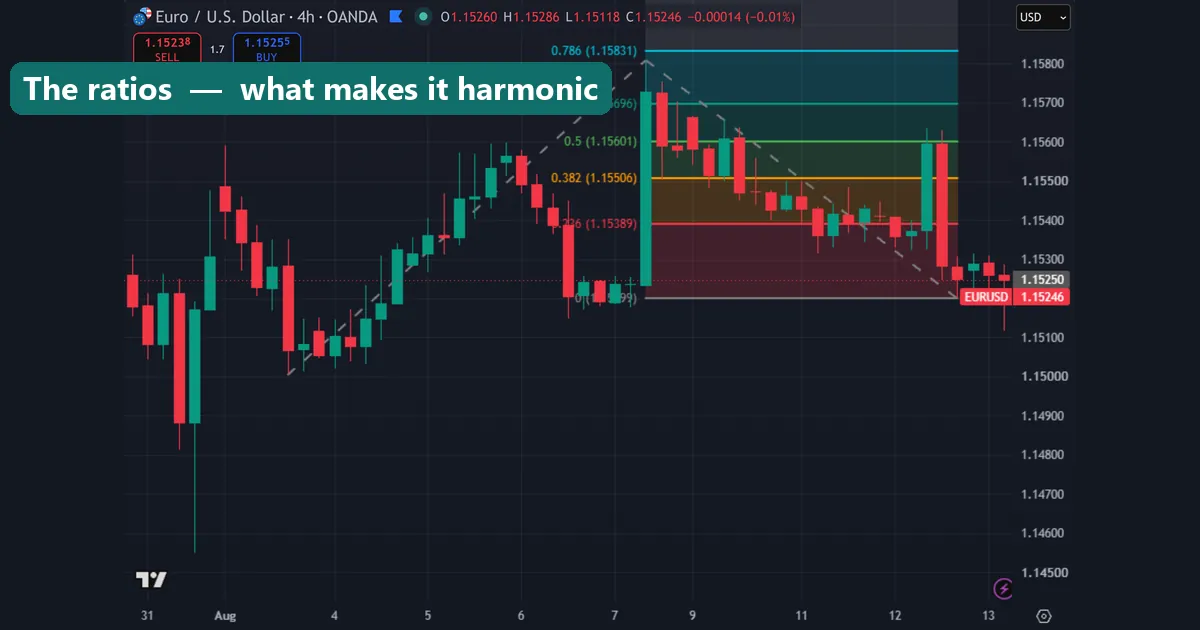
The Gartley is the original and still the most common. Point B retraces 0.618 of XA, which is the defining measurement. From there, C retraces between 0.382 and 0.886 of AB. CD then extends 1.272 to 1.618 of BC. Point D completes at 0.786 of XA.
Because D sits inside the XA leg, the Gartley is a retracement pattern. Price never breaks the original X point, so the structure stays contained and your stop rests just below X on a bullish setup. Many traders start here for that reason.
The Bat pattern
The Bat looks similar but measures differently in two important places. Point B retraces only 0.382 to 0.500 of XA, so the pullback is shallower than a Gartley’s. Point D then completes deeper, at 0.886 of XA, with the BC leg projecting 1.618 to 2.618.
That deep D is the Bat’s practical advantage. Entry sits close to X, so the gap between entry and a stop beyond X stays small. Risk per trade is tight, though the same tightness lets ordinary noise stop you out before the reversal develops.
The Butterfly and the Crab
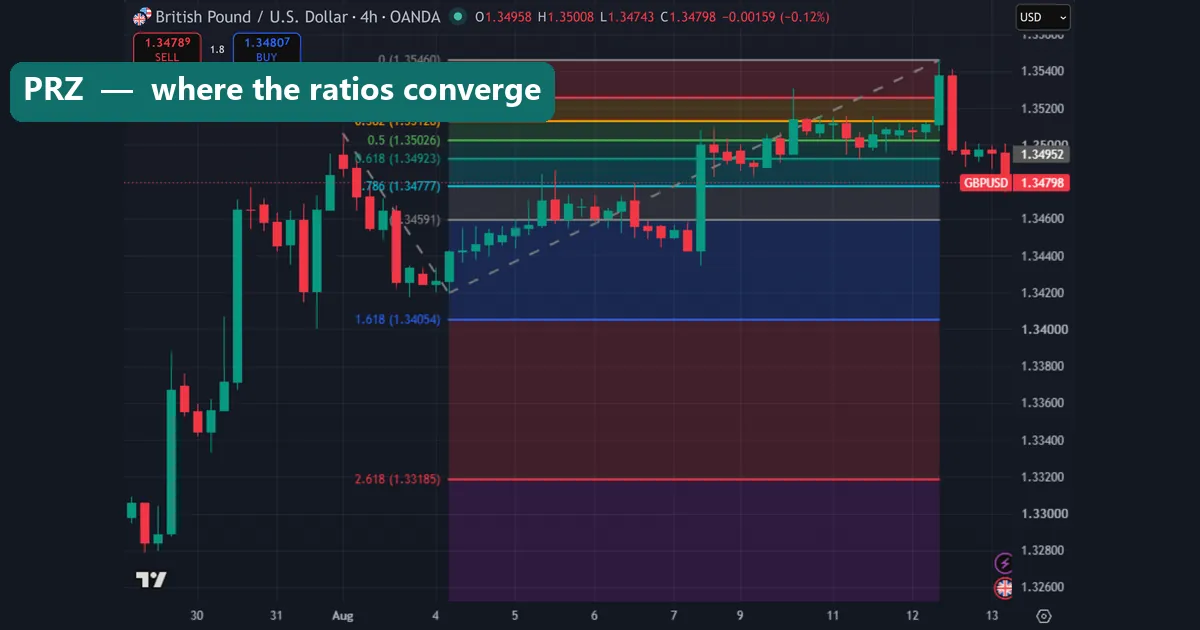
These two are extension patterns. Point D finishes beyond X rather than inside the XA leg, so they mark exhaustion at a new extreme instead of a pullback.
The Butterfly needs point B at 0.786 of XA — a deep retracement — and completes at the 1.272 extension of XA, with BC projecting 1.618 to 2.24. The Crab pushes furthest of all: B sits anywhere from 0.382 to 0.618 of XA, and D completes at the 1.618 extension of XA, with a BC projection of 2.24 to 3.618.
Both patterns put you against a strong move at its extreme. Reward can be large, since the AD leg is long. But you are catching a falling knife by design, so confirmation matters more here than in a Gartley.
The four harmonic patterns compared
| Pattern | B point (of XA) | D point (of XA) | BC projection | What sets it apart |
|---|---|---|---|---|
| Gartley | 0.618 | 0.786 retracement | 1.272–1.618 | The classic; D stays inside XA |
| Bat | 0.382–0.500 | 0.886 retracement | 1.618–2.618 | Shallow B, deep D, tightest stop |
| Butterfly | 0.786 | 1.272 extension | 1.618–2.24 | Deep B; D breaks beyond X |
| Crab | 0.382–0.618 | 1.618 extension | 2.24–3.618 | Most extended D; longest AD leg |
Point C behaves the same across all four: it retraces 0.382 to 0.886 of AB. So check the B and D measurements first to identify which pattern you have.
The potential reversal zone
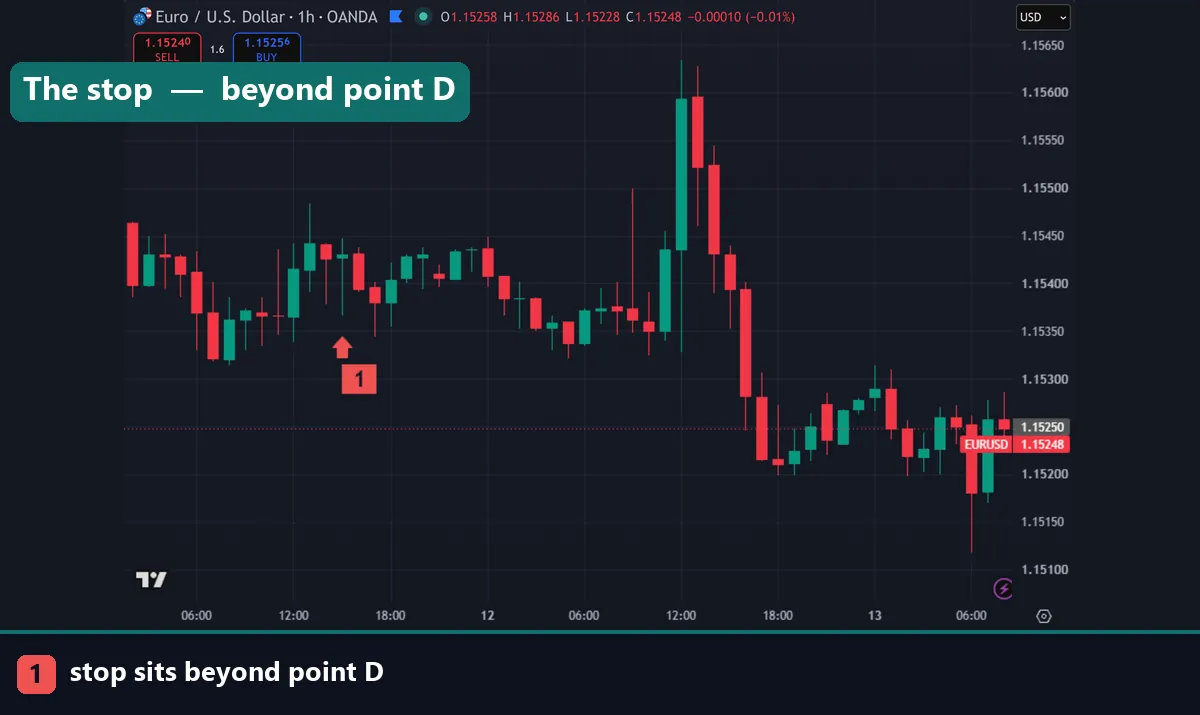
The potential reversal zone, or PRZ, is where several ratio calculations land close together. A Gartley’s PRZ holds the 0.786 retracement of XA, the BC projection and often an AB=CD completion. When those numbers cluster in a narrow band, that band becomes your area of interest.
Notice the wording. It is a zone, not a line. Price rarely stops at one decimal. So treat the PRZ as a band, maybe 10 to 30 pips on a major pair, rather than a precise touch. Tight clusters carry more weight, and a PRZ spread across 80 pips signals a weak pattern.
Confluence from outside the pattern helps too. A PRZ overlapping a prior swing high, a round number or a daily level gives you a second reason to be there. Our guide on how to draw a Fibonacci extension covers the measurement mechanics behind these projections.
How to structure a harmonic pattern trading setup
Entry comes first. Some traders use a limit order at the middle of the PRZ; others wait for a reversal candle inside the zone. Waiting costs a few pips but filters out the patterns price drives straight through, so most experienced traders take the second route. Candle confirmation is a skill on its own — the guide on how to read candlestick charts is the place to build it.
Stops go beyond the structure. On a retracement pattern like the Gartley or Bat, place the stop past point X, since a break of X invalidates the shape. On the Butterfly and Crab, D already sits beyond X, so the stop goes past D plus a volatility buffer. Size that buffer with average true range — see how to use ATR as a stop loss.
Targets get measured from the AD leg. The standard first target is a 0.382 retracement of AD, with a second at 0.618. Point A works as a third for traders who let a runner go. Many bank part of the position at the first target and move the stop to break even.
How to find harmonic patterns
TradingView ships an XABCD Pattern tool in the drawing sidebar. Click the five points and it prints each leg’s ratio, so validating a shape takes seconds. That manual route teaches the measurements better than any scanner.
MT4 and MT5 handle it through pattern-recognition indicators, which scan for valid ratio combinations and mark completed structures. Automation saves screen time. Still, read the tolerance settings before trusting the output — a wide tolerance flags shapes a strict trader would reject. New tools go on via the standard MT4 and MT5 indicator installation steps.
Either way, verify the ratios yourself before risking money. A tool marks candidates; you decide which qualify.
Download the complete indicator database
Put these concepts on your charts. One email unlocks the full library of 1,380+ indicators with compiled MT4 and MT5 files, plus my TradingView scripts. No paywall, no spam, unsubscribe any time.
Get free access to my indicator database
One email unlocks 1,380+ free MT4, MT5 and TradingView indicators — the complete library. No single-tool download; you get the whole database.
The honest limitations
Three problems deserve stating plainly. Tolerance is subjective, and that is the big one. Nobody agrees on how far from 0.786 is still 0.786, so two traders scanning one chart find different patterns. Widen the tolerance and setups appear everywhere; tighten it and months pass without a trade.
Hindsight is the second problem. Harmonic patterns look obvious once complete, because completion is what makes them visible. In real time you watch a possible C leg that may never reach a valid D, and plenty of promising structures dissolve.
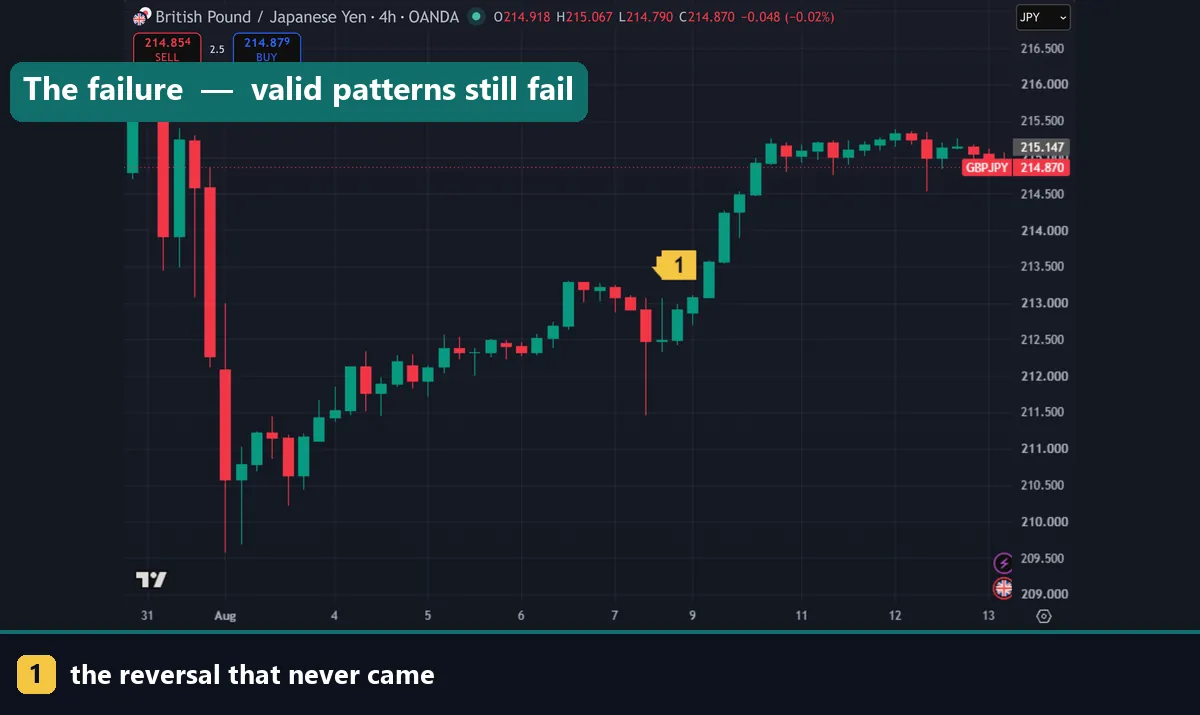
Failure is the third. A textbook-perfect Crab with a tight PRZ still fails regularly, and it should — no chart geometry predicts what price does next. Harmonics give you a structured place to risk a defined amount, nothing more. The stop is the part of the plan that actually protects you.
Common harmonic pattern trading mistakes
Forcing the ratios tops the list. Traders stretch a 0.55 retracement into “close enough to 0.618” and end up trading a shape that does not exist. Skipping the stop comes next, usually because the PRZ felt precise enough to make protection seem unnecessary. Others take every pattern the scanner prints instead of waiting for confluence, which turns a selective method into noise. And many ignore the higher timeframe — a bullish Gartley on M15 inside a daily downtrend is a poor trade however well it measures.
Where to go next
Harmonics work best alongside broader context. Build that foundation with our overview of forex currency trading strategies, then check forex pair volatility so your PRZ buffer matches the instrument. Size deserves the same care as the pattern, so run every setup through the forex position sizing calculator. For outside reading, Investopedia covers harmonic patterns in the currency markets at Investopedia, and Wikipedia explains the underlying Fibonacci retracement on Wikipedia.
FAQ
What are the main harmonic patterns?
The four core structures are the Gartley, Bat, Butterfly and Crab. Gartley and Bat complete inside the XA leg, while Butterfly and Crab extend beyond point X. Variants exist, including the Shark and Cypher, but these four cover most charts.
What is the difference between a Gartley and a Bat pattern?
The B and D points. A Gartley has B at 0.618 of XA and completes at 0.786 of XA. A Bat has a shallower B, between 0.382 and 0.500, and completes deeper at 0.886 of XA, which places entry closer to X.
Where does the butterfly pattern complete?
At the 1.272 extension of XA, beyond point X, with B sitting at 0.786 of XA. Because D breaks the original structure, the Butterfly marks exhaustion at a new extreme rather than a pullback inside a range.
What is the potential reversal zone?
The PRZ is the narrow band where a pattern’s Fibonacci calculations converge — typically the XA retracement or extension, the BC projection and an AB=CD completion. Trade it as a zone rather than a single price, and favour tight clusters over wide ones.
Do harmonic patterns work on every timeframe?
They form on all timeframes, but H1 and above give cleaner structures. Lower timeframes produce shapes that meet the ratios yet drown in noise and spread. Always check the higher-timeframe trend before taking a counter-trend completion.
Are harmonic patterns guaranteed to reverse price?
No. Even a pattern that measures perfectly can fail, which is why the stop beyond X or D is the essential part of the plan. Trading involves risk, results are not guaranteed, and past performance is not indicative of future results.

About the author
Written by Dominic Walsh, a Forex trader and MT4/MT5 indicator, Expert Advisor and script developer. Every tool on forexmt4systems.com is tested on live charts before release and ships with ready-to-use compiled MT4 (.ex4) and MT5 (.ex5) files. Learn more about the trader and developer behind this site.
How we build, test and correct every tool: Editorial & Testing Policy. Trading carries risk; see the disclaimer.