
Two traders compare results. One made three hundred dollars on gold, the other made forty on a small euro position, and neither figure tells you which trade was better.
The R multiple in trading fixes exactly that problem. It measures every outcome against the money you risked, so results from different pairs and different account sizes finally sit on one scale.
What the R Multiple in Trading Actually Means
One R equals the amount you stand to lose if the trade hits its stop. Nothing else defines it.
So R is not a percentage of your account, and it is not the stop distance in pips. It is the money at risk on that specific position.
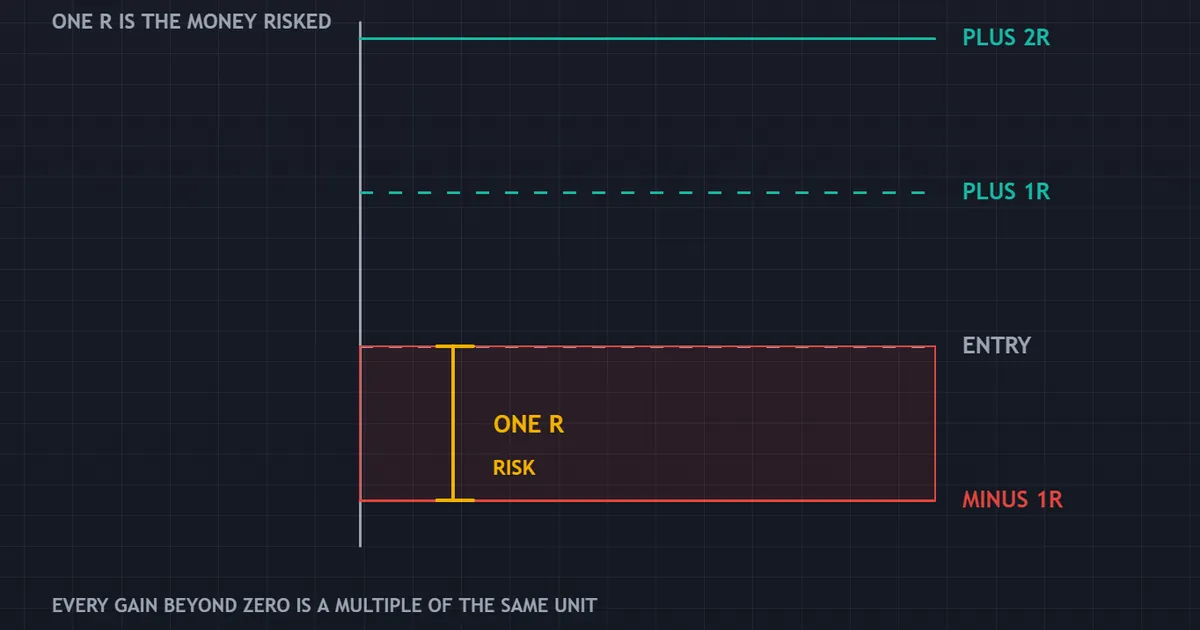
The panel above puts the definition on a scale. Minus one R sits at the stop, zero sits at the entry, and everything beyond becomes a multiple of the same unit.
One R Is Your Risk, Not Your Account
Suppose you run a ten thousand dollar account and risk one percent per trade. One R then equals one hundred dollars, whatever pair you trade and whatever the stop distance turns out to be.
Wide stops therefore get smaller positions, and tight stops get larger ones. The lot size varies precisely so that one R stays constant.
That constancy does the real work. Once every trade risks the same unit, the unit becomes a currency you can add, average and compare.
Watch what happens without it. A trader who risks eighty dollars on one idea and four hundred on the next cannot read their own record, because a single lucky large trade drowns out twenty careful small ones.
Every Outcome Converts to R
Take the profit or loss in money and divide by one R. A two hundred dollar gain on a one hundred dollar risk records as plus two R.
Losses work identically. A full stop records as minus one R, and an exit taken slightly early might record as minus zero point seven R.
Do the division after costs, never before. Spread, commission and swap all reduce the result, and a record that ignores them flatters every trade equally.
Swap deserves particular care on longer holds. A position carried for a fortnight can shed a noticeable slice of an R before the exit even arrives.
Record the sign as well as the size. Plus and minus in front of every figure sounds obvious, and mixed conventions ruin more spreadsheets than any other error.
The Arithmetic, Worked Through
Three trades make the conversion concrete. All three run on the same ten thousand dollar account at one percent risk, so one R equals one hundred dollars throughout.
Setting One R Before Anything Else
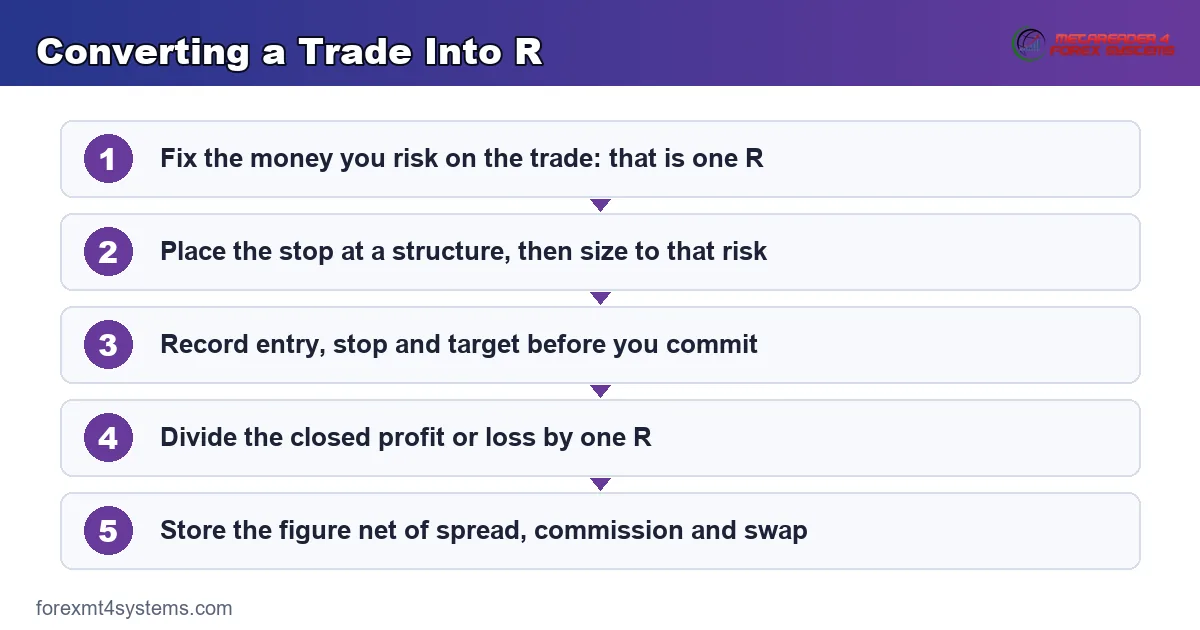
- Fix the risk. One percent of ten thousand dollars gives one hundred dollars, and that figure becomes one R for every trade below.
- Place the stop at a structure. The distance follows from the chart, not from the size you fancy trading.
- Size the position from that distance. Risk divided by stop distance gives the lots, so the money at risk lands on one hundred dollars.
- Record entry, stop and target in the journal. The target distance divided by the stop distance gives the planned R multiple before you commit.
- Convert the result after the exit. Profit or loss divided by one hundred dollars, net of costs, produces the R multiple you store.
Converting Three Trades
Trade one runs on a major pair with a twenty-five pip stop and a fifty pip target. Price reaches the target, the gross gain comes to two hundred dollars, and costs take four dollars.
Net result: one hundred and ninety-six dollars, which divides into one R to give plus one point nine six R.
Trade two runs on gold with a stop far wider in absolute terms. The position size shrinks to compensate, price hits the stop, and the loss lands at one hundred and three dollars including costs, or minus one point zero three R.
Trade three closes manually at roughly half the intended distance. The net gain of forty-eight dollars converts to plus zero point four eight R.
| Trade | Instrument type | Net result | R multiple |
|---|---|---|---|
| One | Major pair, tight stop | One hundred and ninety-six dollars gained | +1.96R |
| Two | Metal, wide stop | One hundred and three dollars lost | -1.03R |
| Three | Major pair, early exit | Forty-eight dollars gained | +0.48R |
| Total across the three trades | +1.41R | ||
Why the Account Size Drops Out
Run the same three trades on a fifty thousand dollar account and every currency figure multiplies by five. The R multiples do not move at all.
That property makes R portable. Your record from a small starter account compares directly with your record from a larger one, and a friend’s numbers compare with yours.
Our guide to R multiples covers the mechanics in more depth, including how to handle partial exits.
Reading a Distribution of R Multiples
Once you hold fifty or a hundred converted trades, plot them. The shape says far more than any single average.
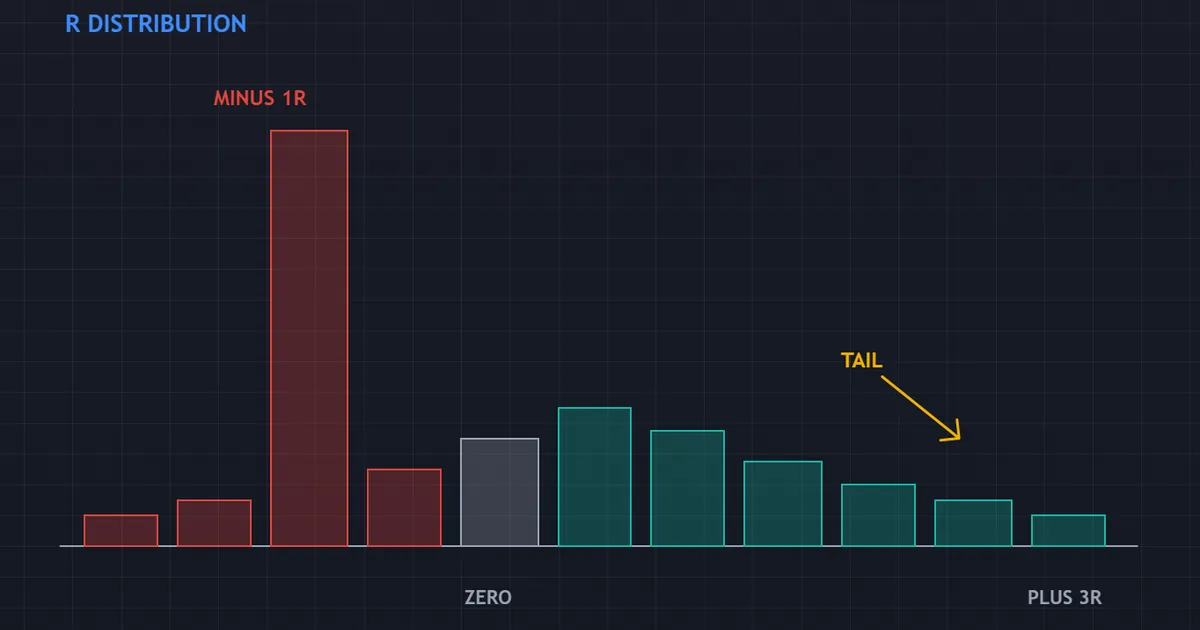
The panel above buckets closed trades by R multiple. Notice the tall bar at minus one R and the thin tail stretching to the right.
The Shape Matters More Than the Average
Most strategies produce exactly that silhouette. Losses cluster tightly at minus one R, because the stop enforces a common size, while gains scatter widely.
A cluster of losses beyond minus one R signals a problem. Either stops move during trades, or slippage and gaps run larger than you allowed for.
So the left side of the chart audits your discipline. The right side describes your strategy.
Count the bars above plus two R as well. A method with almost nothing out there depends heavily on its strike rate, which makes it fragile whenever conditions shift.
Outliers Deserve Their Own Column
One trade at plus eight R can carry a whole quarter. Strip it out and the record often looks very different, which is worth knowing before you draw conclusions.
Record the result with and without your largest outcome. When the two versions disagree sharply, your sample is telling you it remains too small.
Look at where the outlier came from as well. A single huge result produced by a runaway news move says something quite different from one produced by your normal trailing rule.
Download the complete indicator database
Put these concepts on your charts. One email unlocks the full library of 1,380+ indicators with compiled MT4 and MT5 files, plus my TradingView scripts. No paywall, no spam, unsubscribe any time.
Get free access to my indicator database
One email unlocks 1,380+ free MT4, MT5 and TradingView indicators — the complete library. No single-tool download; you get the whole database.
Expectancy in R
Expectancy answers a single question: what does the average trade return, measured in R? The formula needs three inputs from your own record.
The Formula
Multiply your strike rate by the average R of your winners. Then subtract the losing rate multiplied by the average R of your losers.
Written out: expectancy equals strike rate times average win in R, minus loss rate times average loss in R. The output arrives in R per trade.
A Worked Expectancy
Take a hundred-trade record with forty winners and sixty losers. The winners average plus two point two R, and the losers average minus zero point nine five R.
Winners contribute zero point four times two point two, which comes to zero point eight eight. Losers contribute zero point six times zero point nine five, which comes to zero point five seven.
Subtract the second from the first and expectancy lands at zero point three one R per trade. Across the hundred trades in the sample, that arithmetic accounts for thirty-one R.
Our expectancy calculator runs the same arithmetic on your figures, which saves the spreadsheet work.
What the Number Is and Is Not
That zero point three one describes a sample that already happened. It is a summary, never a forecast, and it changes as soon as new trades arrive.
Two strategies with identical expectancy can still feel entirely different. One might reach it through frequent small gains, the other through rare large ones.
Comparing Strategies Across Pairs and Sizes
Here lies the practical payoff. R turns three incompatible records into one table you can actually read.
The Comparison in Practice
Say you run a breakout method on major pairs and a pullback method on an index. Currency results tell you almost nothing, since the two carry different position sizes and different costs.
Converted to R, both produce an expectancy and an average trade. Now the question becomes simple: which one returns more per unit of risk taken?
Frequency Belongs in the Comparison
Expectancy per trade means little without a trade count. A method returning zero point four R across ten trades a year sits far behind one returning zero point one five R across two hundred.
Multiply expectancy by expected frequency to compare properly. Then check that the higher-frequency method survives its own cost burden, because costs scale with activity.
Screen time belongs in the comparison too. Two hundred trades a year demand a very different day from ten, and that difference decides which method you can actually run.
Risk Per Trade Stays Separate
R measures the result per unit risked. How much you choose to risk sits one level above, and our position size calculator handles that translation.
Keep the two decisions apart. Mixing them produces records where a good trade and a large trade become impossible to distinguish.
Using R to Set Targets Before Entry
The unit works forwards as well as backwards. Before entry, a planned R multiple tells you whether the trade deserves taking at all.
The Planned Figure
Divide the target distance by the stop distance. Fifty pips of target over twenty-five pips of stop gives a planned two R, before costs take their share.
Compare that figure against the minimum in your plan. Setups below the threshold get skipped, which removes a whole category of marginal trades without any judgement at all.
Where Traders Fudge It
The temptation runs one way. Push the target further out until the ratio clears, and you produce a tidy number on paper alongside a price nobody will ever reach.
Anchor the target on a structure instead. A prior swing, a session extreme or a measured projection each give the level a reason to exist.
Planned Versus Realised
Log both figures. The gap between planned R and realised R makes one of the most useful columns in any journal.
A wide gap usually points at early exits rather than bad targets. Traders who close at plus zero point six R on a two R plan discover the habit only once those two columns sit side by side.
Turning Your Existing Journal Into R
Most traders already hold the raw data. Converting an old record takes an evening and needs only two columns.
The Two Columns You Need
Column one holds the money you risked, taken from the stop distance and the position size. Column two holds the net result after costs.
Divide the second by the first and you have R. A spreadsheet handles the whole file in a single drag.
Handling the Awkward Rows
Trades where you moved the stop need a decision. Record them against the original risk and flag the row, or record them against the final risk and note the change.
Either convention works, provided you apply it everywhere. Mixing the two turns the left side of your distribution into noise.
Rows That Never Had a Stop
Some early trades carry no recorded stop at all. Leave those out of the R sample and mark the gap, rather than inventing a risk figure long after the fact.
Such rows still teach you something. A cluster of them at the start of your history shows exactly when your process began.
Where the Unit Came From
Trading literature spread the unit as a way of describing outcomes without reference to account size. The idea caught on because it survived translation between very different traders.
It also travels far beyond markets. Any activity with a bounded downside and a variable upside can be measured in units of that downside.
Underwriters, poker players and venture investors all reach for something similar. Each of them cares about the ratio between what a decision risks and what it might return.
Common Mistakes and Their Fixes
Five habits corrupt an R record quietly. The panel below sets out what the unit fixes and what it leaves untouched.

Moving the Stop and Keeping the Original R
Widening a stop mid-trade changes the risk, so the original R no longer applies. Either record the trade against the new risk or mark it as a rule break.
Measuring R Before Costs
Gross figures inflate every result by roughly the same amount. On small targets that inflation can flip an expectancy from negative to positive, which is exactly the case where accuracy matters.
Averaging Too Few Trades
Twenty trades produce an expectancy figure that means very little. Dispersion in most records runs wide enough that a hundred trades still leaves real uncertainty.
Treating Expectancy as a Forecast
The number summarises a past sample under past conditions. Spreads change, volatility regimes change, and your own execution changes with them.
Ignoring the Losing Streak Implied by the Numbers
A forty percent strike rate produces runs of six or seven losses regularly. Seven losses equals seven R, and our note on drawdown covers what that does to an account.
Quick Reference Table
Keep this beside your journal. It converts the common cases without any arithmetic.
| What happened | Recorded as | Note |
|---|---|---|
| Stop hit exactly | -1R | The baseline every record should show most often |
| Stop hit with slippage | Worse than -1R | Track these separately; they audit your execution |
| Target hit at twice the stop distance | +2R | Slightly less after costs, so record the net figure |
| Closed at entry price | 0R | Costs usually make this marginally negative |
| Half closed at +1R, rest at +3R | +2R | Weight each portion by the size closed |
| Stop moved wider, then hit | Below -1R | Flag as a rule break as well as a loss |
| Position closed early on a rule | Whatever the division gives | Record the rule name so you can test it later |
Where Expectancy in R Misleads You
The number carries authority it has not always earned. Three situations catch traders regularly.
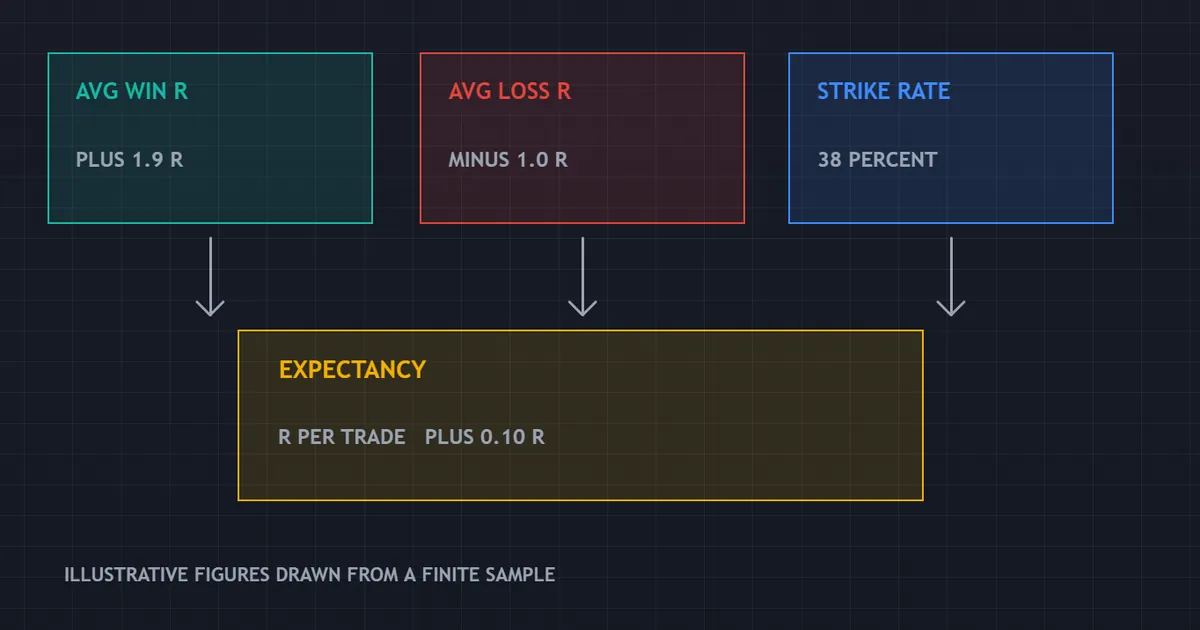
The panel above derives expectancy from a record of R multiples. Every input on it comes from a finite sample, which is the source of all three problems below.
Dispersion Swamps Small Samples
Individual R results scatter widely around their average. When the standard deviation of your R multiples runs near one and a half, a hundred-trade average still moves around considerably.
So treat any expectancy from under a hundred trades as a rough indication. Recompute it every twenty-five trades and watch how much it wanders.
The Average Hides the Sequence
Expectancy says nothing about order. The same set of trades can arrive with the losses bunched at the front, which is the version that ends accounts.
Read the R record as a sequence as well as a summary. Our guide to reviewing your trades covers how to do that without cherry-picking.
Conditions Shift Underneath the Sample
A record gathered through a quiet quarter describes a quiet quarter. Volatility, spreads and correlations all move, and each one shifts the distribution.
Date-stamp every expectancy you compute. A figure from eighteen months ago describes a market that may no longer exist.
Related Guides Worth Reading Next
R depends on a stop you actually respect, so start there. Our explainer on the risk reward ratio covers how target distance turns into planned R, and our risk reward calculator does the arithmetic before entry.
None of it works without records. Our note on what a trading journal is covers the fields you need, and R is simply one more column beside them.
Traders who want the setup side flagged automatically can browse our MetaTrader indicators library. Any such tool spots conditions, while the measurement stays your job.
FAQ
Is one R the same as one percent of my account?
Only when you happen to risk one percent per trade. One R means the money at risk on that position, so a trader risking half a percent has an R worth half as much. Keeping the percentage fixed is what makes R comparable across your own record, though the two ideas remain separate. The percentage sets the size of R, and R measures the result.
How do I record a partial exit in R?
Weight each portion by the size closed. Half the position taken at plus one R and the other half at plus three R gives a blended result of plus two R. Some traders also log the two exits separately so they can test whether scaling out helps or hurts. Both approaches work, provided you pick one and apply it consistently.
What counts as a decent expectancy?
Any positive figure that survives costs and a large sample deserves attention. Published examples across trading literature vary enormously, and comparing your number to somebody else’s rarely helps, since their sample, market and cost structure all differ. Compare your expectancy to your own earlier figure instead, and treat small changes as noise.
Should losses below minus one R be excluded?
Never exclude them. Results worse than minus one R record slippage, gaps and moved stops, and those cost you real money. Keep them in the sample and track them in a separate column, because a growing count there points at execution rather than at strategy.
Does R work for scalping?
It works, though costs dominate the arithmetic. A scalper targeting a fraction of the stop distance sees spread consume a large share of every R, so the gross and net figures diverge sharply. Measure R net of costs from the first trade, or the record will describe a strategy nobody can actually run.
Does R replace tracking profit in currency terms?
No, and the two answer different questions. Currency figures matter for tax, for withdrawals and for knowing what the account can support. R matters for judging the process, because it strips out size and lets one quarter compare with another. Keep both columns and read whichever one fits the question in front of you.
Can I use R when my stop distance changes with volatility?
Yes, and that case is exactly where R helps most. A volatility-based stop widens in fast conditions and narrows in quiet ones, so your lot size moves in the opposite direction to keep the money at risk constant. The pip result then varies enormously between trades while the R result stays directly comparable.
How many trades before I trust the numbers?
More than most traders collect. A hundred converted trades gives a usable first reading, and several hundred gives a firmer one, particularly when your R multiples scatter widely. Recompute the figure at regular intervals rather than after good weeks, and keep the sample dated so you can see when conditions changed. Treat every reading as provisional evidence about a process you are still refining. Results are not guaranteed; past performance is not indicative of future results.
External references
- For background on this concept, see Risk-Reward Ratio at BabyPips Forexpedia.
- For broader market context, see Sample Size Determination on Wikipedia.

About the author
Written by Dominic Walsh, a Forex trader and MT4/MT5 indicator, Expert Advisor and script developer. Every tool on forexmt4systems.com is tested on live charts before release and ships with ready-to-use compiled MT4 (.ex4) and MT5 (.ex5) files. Learn more about the trader and developer behind this site.
How we build, test and correct every tool: Editorial & Testing Policy. Trading carries risk; see the disclaimer.