
A Gann calculator takes one price — usually the previous close or the day’s open — and produces a ladder of support and resistance levels from it. The method comes from W.D. Gann, a trader active in the first half of the twentieth century, and the arithmetic behind it is simpler than its reputation suggests. This guide covers what the calculator does, how to run it by hand, and an honest view of why the levels sometimes work.
What the calculator computes
The common version is built on the Square of Nine, a spiral of numbers arranged so each full turn adds a predictable amount. The calculation reduces to three steps.
Take your input price and find its square root. Add or subtract fractions of one — 0.125, 0.25, 0.375 and so on up to 2 — then square the result. Each squared value is a level.
Level = (√price ± n)², where n steps in eighths
With EURUSD at 1.0850, the square root is about 1.0416. Adding 0.125 and squaring gives roughly 1.1112; subtracting gives about 0.9689. The full ladder fills in between.
The quarter and half steps are treated as the significant ones, with the eighths acting as minor levels.
Running a Gann calculator by hand

Worth doing once, because it removes the mystique and shows exactly what the tool is doing.
| Step | Operation | Example at 1.0850 |
|---|---|---|
| 1 | Square root of the price | 1.0416 |
| 2 | Add 0.25, then square | 1.6666 as resistance |
| 3 | Subtract 0.25, then square | 0.6250 as support |
| 4 | Repeat in eighths | The intermediate ladder |
Something becomes obvious immediately. On a forex pair trading near 1.00, the square root sits near 1 and the steps produce enormous gaps — a quarter step moves the level by more than fifty percent.
That is why the method transfers poorly to currencies without adjustment. Traders scale the price first, working with 10850 rather than 1.0850, which gives a square root near 104 and steps of a few pips. The scaling is arbitrary, and different scalings produce different levels.
Our Square of Nine guide covers the underlying construction in more detail.
Where the levels come from
The claim attached to the method is that markets move in geometric relationships between price and time, and that the squares of numbers mark natural turning points.
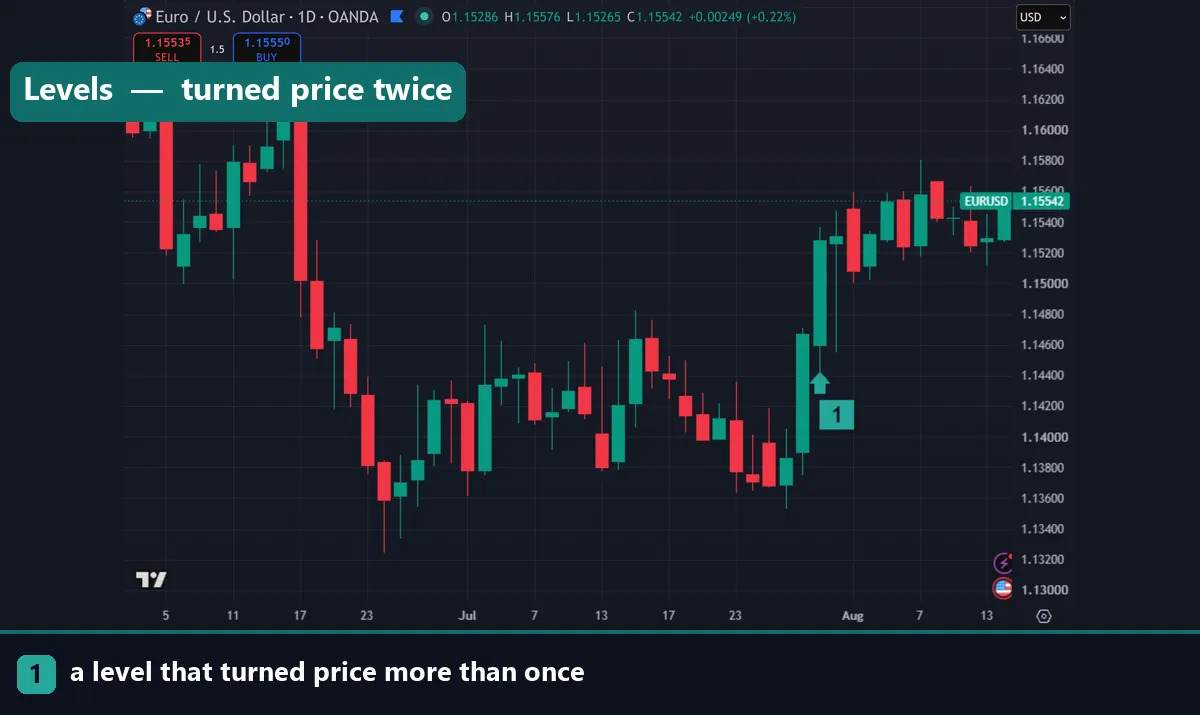
The observable part is more modest. Squaring a scaled price produces levels that land close to round numbers, and round numbers genuinely do attract orders — stops, limits and options strikes cluster there.
So a Gann level that “works” is often a round number wearing a more elaborate costume. That does not make it useless, and it does explain the mechanism without invoking geometry.
Gann’s own reputation is harder to assess than the folklore suggests. Contemporary accounts of his results conflict, his published work is deliberately obscure, and the estate he left was modest for someone credited with the returns often quoted.
Using the output sensibly

If you want to trade these levels, three rules keep the exercise honest.
Treat them as zones, not prices. A calculated level is a region where a reaction might occur. Trading a limit order at the exact figure invites a two-pip overshoot into your stop.
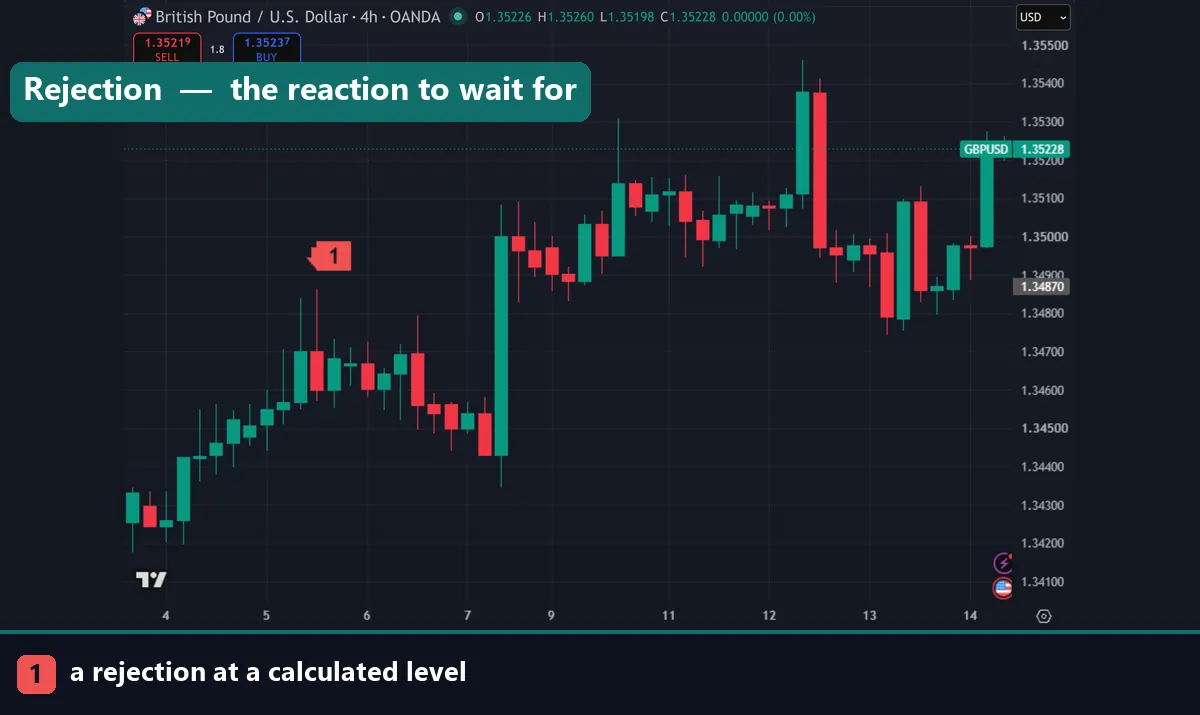
Require a reaction. Price reaching a level is not a signal. A rejection candle, a lower-timeframe structure break, or a divergence gives you something to act on.
Check what else sits there. If a Gann level coincides with a pivot point, a prior swing high and a round number, the confluence is doing the work. Our pivot calculation guide covers a method with the same character and clearer logic.
Recalculate daily from the same input price, and record which input you used. Switching between the close, the open and the prior high produces different ladders and lets you pick the flattering one afterwards.
Download the complete indicator database
Put these concepts on your charts. One email unlocks the full library of 1,380+ indicators with compiled MT4 and MT5 files, plus my TradingView scripts. No paywall, no spam, unsubscribe any time.
Get free access to my indicator database
One email unlocks 1,380+ free MT4, MT5 and TradingView indicators — the complete library. No single-tool download; you get the whole database.
Is it worth using?

Three points settle it for most traders.
The levels are arbitrary but consistent. Applied the same way every day, they give you a fixed set of reference points, and a consistent framework has value even when its theory is thin.
The method is heavily over-parameterised. Input price, scaling factor, step size and which levels count all vary between practitioners, which means almost any turning point can be matched to some level after the fact.
Simpler tools do the same job with clearer reasoning. Pivot points produce daily levels from an explicit formula. Prior swing highs and lows mark where orders actually sit. Round numbers need no calculation at all.
If the calculator gives you a disciplined routine, use it. If you are hoping the geometry contains a hidden edge, the honest answer is that no published evidence supports one.
Common mistakes
Four repeat. Applying the raw formula to an unscaled forex price tops the list, which produces levels hundreds of pips apart. Changing the input price between sessions comes second, since it lets you fit any outcome. Third, traders place limit orders at the exact figure with no allowance for overshoot. Fourth, they treat a level as a signal rather than as a place to watch for a reaction.
Where to go next
Level-based methods share more than they differ. Read our Square of Nine guide for the construction, then pivot calculation for a cleaner daily framework. For the confluence check, see the fib retracement tool, and pivot point indicators for MT4 plots levels automatically. For further reading, the W.D. Gann biography on Wikipedia covers the historical record, and Investopedia explains Gann angles at Investopedia.
FAQ
What does a Gann calculator do?
It takes one input price, usually the previous close, and produces support and resistance levels by taking the square root, stepping in fractions, and squaring the result.
What is the formula?
Level equals the square root of the price, plus or minus a fraction such as 0.25, with the result squared. Quarter and half steps are treated as the significant levels.
Why do the levels look wrong on forex pairs?
Because a price near 1.00 has a square root near 1, so each step moves the level enormously. Traders scale the price first, using 10850 rather than 1.0850.
Do Gann levels work?
The scaled output often lands near round numbers, where orders genuinely cluster. That mechanism explains most of the observed reactions without any geometry.
Which input price should I use?
Pick one — usually the previous daily close — and keep it. Switching inputs between sessions produces different ladders and lets you fit any outcome after the fact.
Is there a simpler alternative?
Pivot points give daily levels from an explicit formula, and prior swing highs mark where orders sit. Trading involves risk, results are not guaranteed, and past performance is not indicative of future results.

About the author
Written by Dominic Walsh, a Forex trader and MT4/MT5 indicator, Expert Advisor and script developer. Every tool on forexmt4systems.com is tested on live charts before release and ships with ready-to-use compiled MT4 (.ex4) and MT5 (.ex5) files. Learn more about the trader and developer behind this site.
How we build, test and correct every tool: Editorial & Testing Policy. Trading carries risk; see the disclaimer.