
A parabolic pattern is a move that speeds up as it goes. Price rises steadily, then faster, then almost vertically, and the trend line you drew at the start becomes useless because the curve has left it behind. These moves produce spectacular gains for anyone already positioned and severe losses for anyone who joins near the end. This guide covers how to recognise one forming, why they end the way they do, and how to trade around them without being the last buyer.
What makes a parabolic pattern
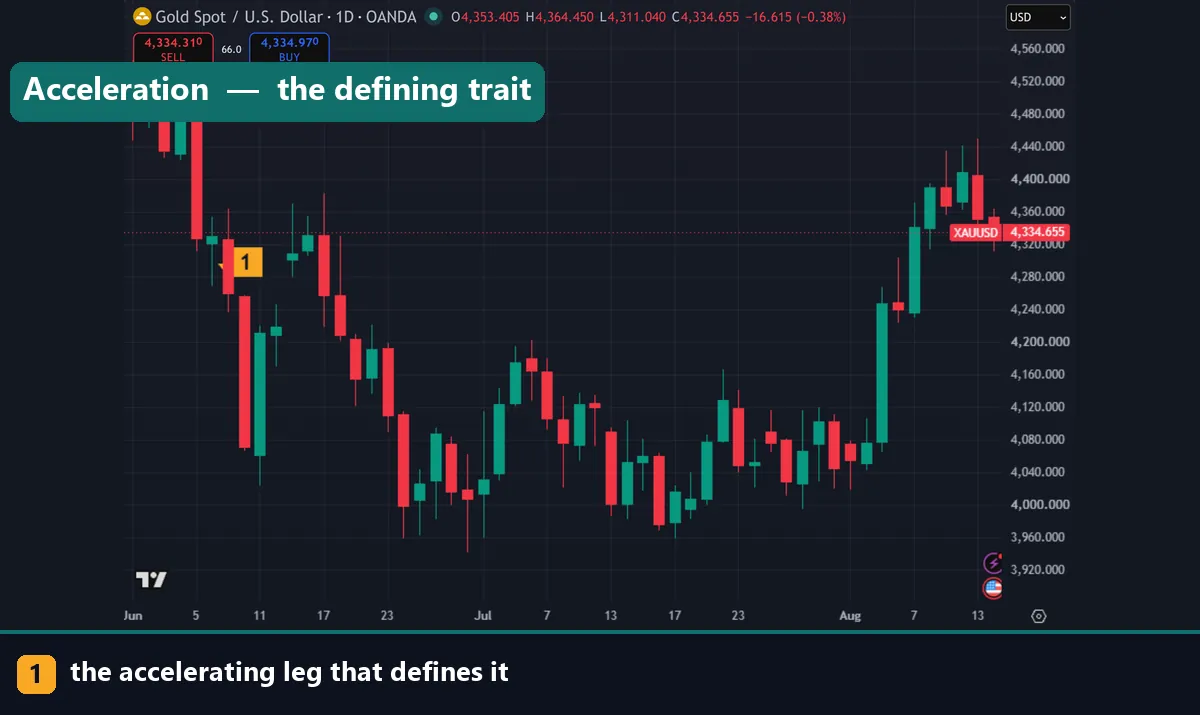
A normal trend advances at a roughly constant rate. Pullbacks interrupt it, and a straight trend line drawn under the lows contains it reasonably well.
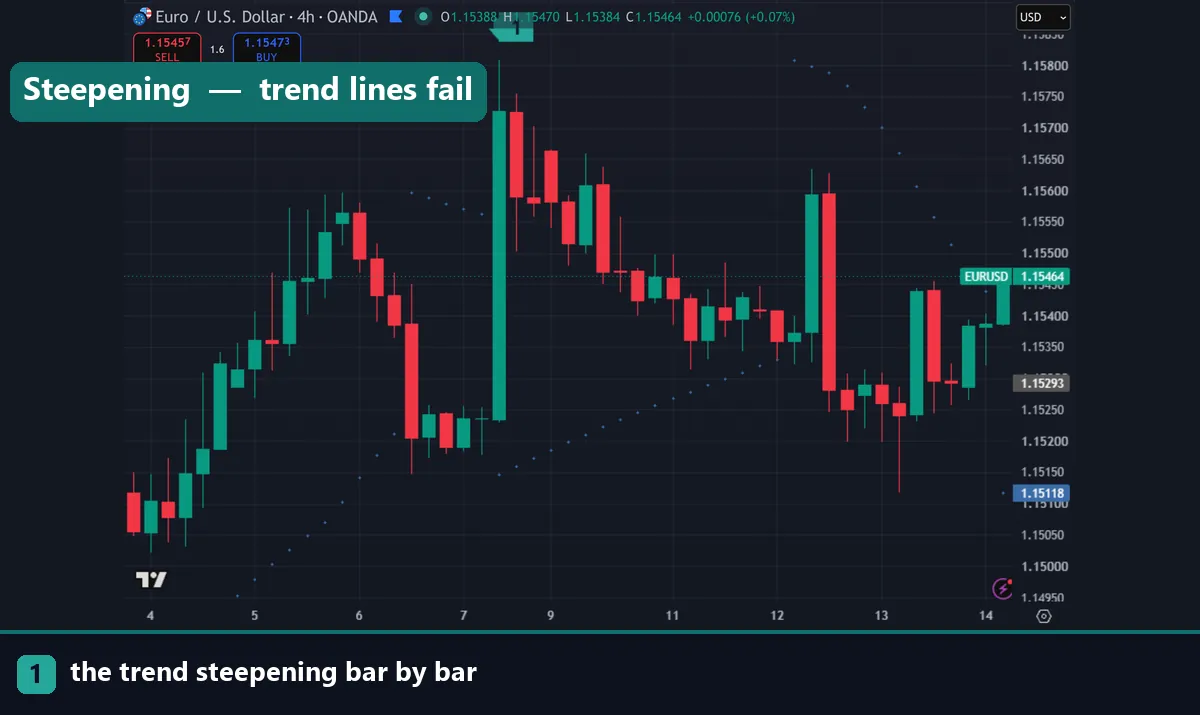
A parabolic move does something different: the rate of advance itself increases. Each leg covers more ground than the last, in less time. Draw a trend line and price pulls away from it, so you draw a steeper one, and price pulls away from that too. Needing a third or fourth steeper line is the practical signature.
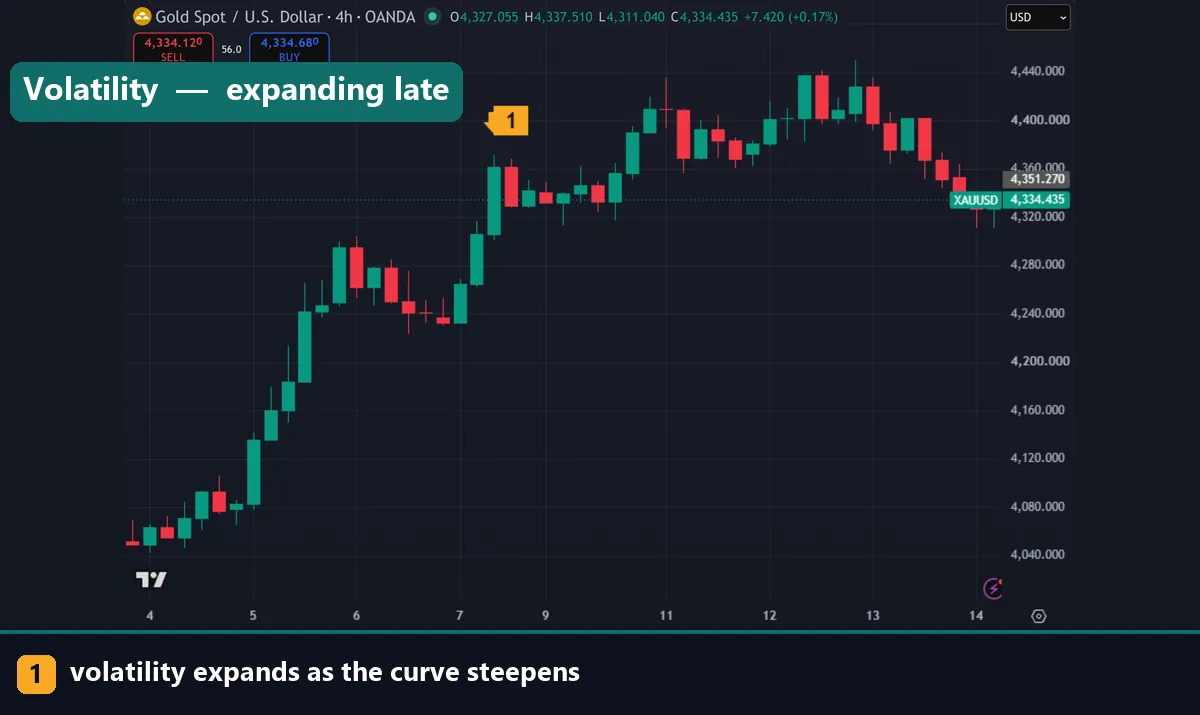
Three characteristics travel together. Pullbacks get shallower and shorter until they almost disappear. Volume and volatility expand as the move steepens. And the move detaches from any moving average, leaving the 20 or 50 period line far below.
Why they form
The mechanism is a feedback loop rather than anything mysterious.
A move begins for an ordinary reason — a rate expectation shifting, a supply shock, a technical break. As it extends, traders positioned against it are forced out, and their stop orders add fuel in the same direction. Meanwhile the move attracts attention, drawing in participants who buy because it is rising rather than for any underlying reason.
Both flows push the same way and both intensify as price moves further, which is what produces the acceleration. The buying is increasingly driven by the price move itself rather than by anything independent of it.
That is also why the ending is abrupt. A move sustained by momentum needs continuous new buying, and when it stops arriving there is nothing underneath.
Recognising the exhaustion
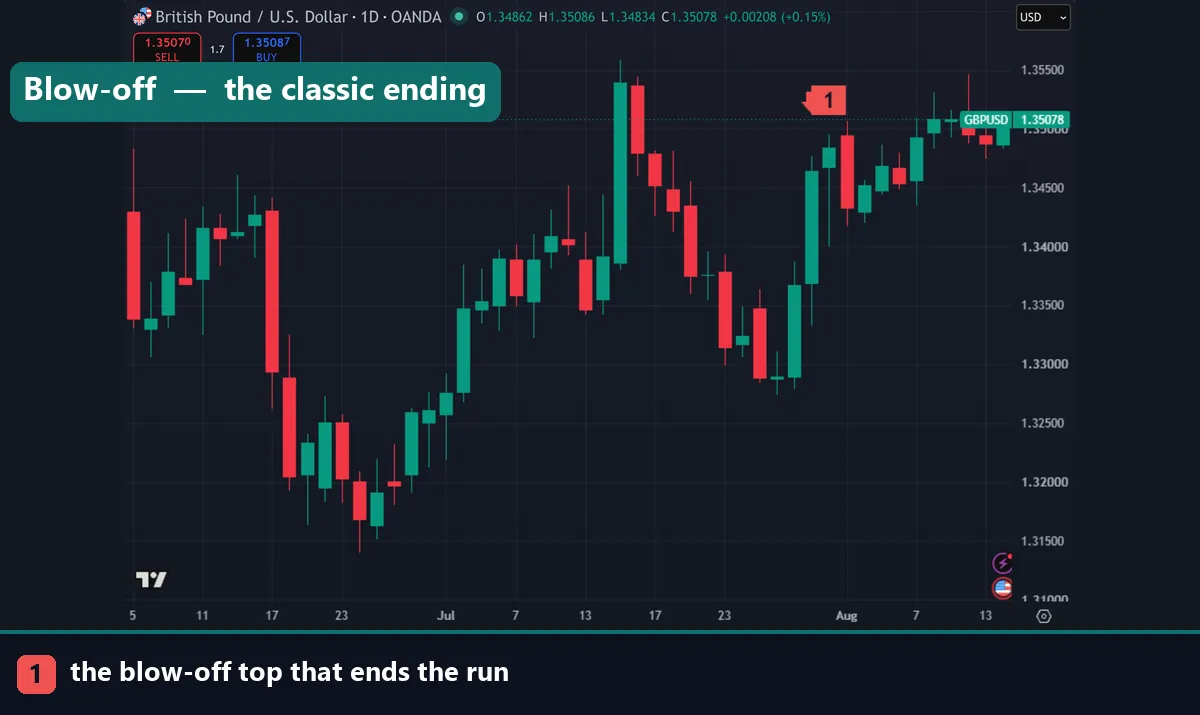
Nobody calls the exact top, and traders who try repeatedly are the ones who lose most. Some signs do cluster near the end though.
The blow-off bar is the classic: a single candle far larger than anything preceding it, often closing well off its extreme with a long wick. Volume spikes on it.
Volatility expansion shows in ATR climbing sharply. Daily ranges that were 80 pips become 200, which is unsustainable.
Momentum divergence appears as price makes new highs while RSI makes lower highs. Our RSI divergences cheat sheet covers reading it, and the warning it carries can persist for a long time before price responds.
The failed continuation is the most reliable of the four: price makes a marginal new high, cannot hold it, and closes back inside the previous bar’s range.
How they end
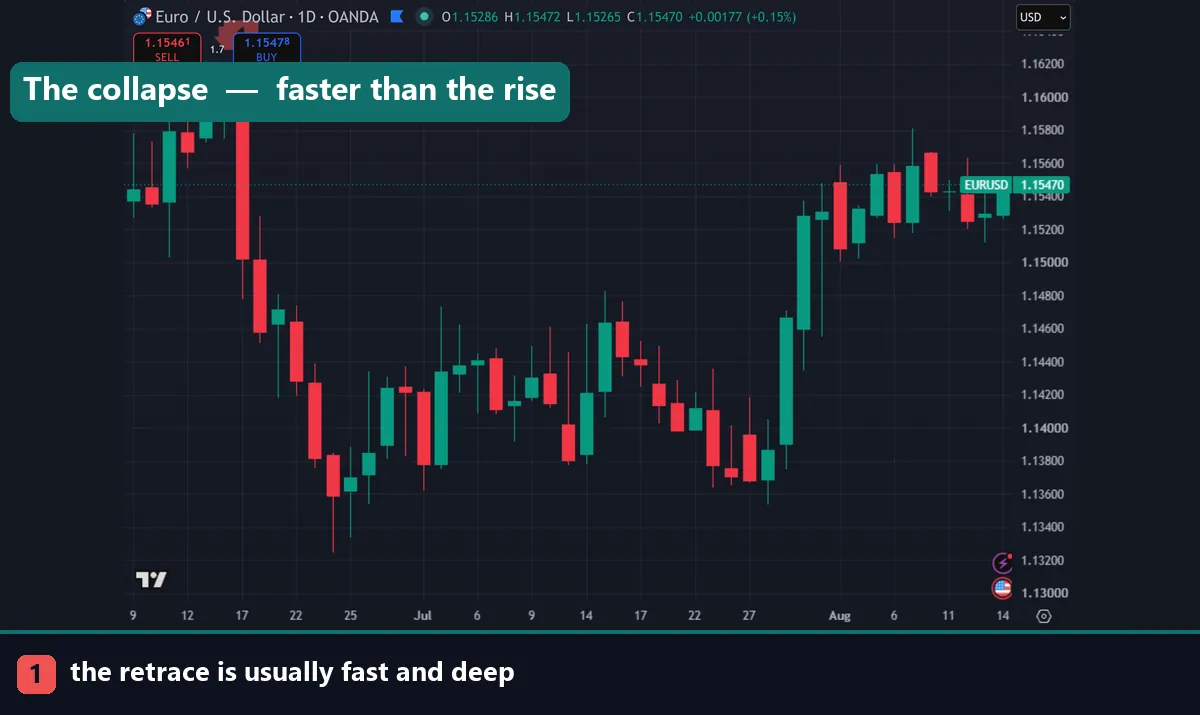
Parabolic moves rarely roll over gently. The retracement is usually fast and deep, often giving back a large part of the accelerating leg in a fraction of the time it took to build.
The reason follows from how it was built. Late buyers hold positions justified by nothing but the rise, and when it stops they exit together. Their selling triggers stops below, which triggers more selling.
A useful reference point is where the acceleration began — the price at which the move detached from its earlier steady trend. Retracements often reach back to that area. Everything above it rested on momentum rather than value.
What follows varies. Some markets pause, then pick up the old slower trend. Others reverse entirely. The parabolic move itself does not tell you which.
Download the complete indicator database
Put these concepts on your charts. One email unlocks the full library of 1,380+ indicators with compiled MT4 and MT5 files, plus my TradingView scripts. No paywall, no spam, unsubscribe any time.
Get free access to my indicator database
One email unlocks 1,380+ free MT4, MT5 and TradingView indicators — the complete library. No single-tool download; you get the whole database.
Trading around one
Three approaches, in descending order of how well they usually work.
Ride it with a trailing stop. If you were already positioned before the acceleration, a trailing method keeps you in while the move runs and exits automatically when it breaks. Parabolic SAR and ATR-based trails both suit this, and our ATR stop loss guide covers the distance. Do not widen the stop because the move “has more in it”.
Stand aside. Entering mid-parabola means buying at the worst risk-to-reward of the whole trend: the stop has to sit far below, and the remaining upside is unknowable. Most experienced traders simply skip these.
Trade the break, not the top. Waiting for the structure to fail — a close below the accelerating trend line, or a failed new high — gives an entry with a defined invalidation. It gets you in later and much safer than guessing.
The approach that reliably loses money is shorting into strength because the move “has gone too far”. It can always go further, and the squeeze on early shorts is part of what fuels the final leg.
Where they show up
These moves happen more often in markets with no natural price anchor. Gold, crypto and individual equities produce them more readily than major currency pairs.
Currencies are relative prices between two economies, and both sides are anchored by interest rates and trade flows, so a true parabola is rarer on EURUSD than on XAUUSD. When one does appear in forex, it usually accompanies a policy shock or a central bank intervention.
Timeframe matters as well. What looks parabolic on M5 is often just a normal impulse leg on H4. Judge the shape on the timeframe that matches your holding period.
Common mistakes
Four repeat. Shorting into an accelerating move tops the list, since it can always extend and the squeeze feeds the trend. Buying late without a defined stop comes second. Third, traders widen a trailing stop to stay in, which turns a winner into a large loser when the break comes. Fourth, they read a normal impulse on a fast chart as parabolic and act on a shape that is not there.
Where to go next
This pattern sits alongside the rest of your structural reading. Our parabolic chart guide covers the display side, and price action trading covers the reads that mark the break. For the volatility that accompanies these moves, see forex pair volatility, and the RSI divergences cheat sheet for the momentum warning. For further reading, see the buying climax at Investopedia. The market trend article on Wikipedia covers trend phases.
FAQ
What is a parabolic pattern?
A move where the rate of advance keeps increasing, so each leg covers more ground in less time. Straight trend lines fail to contain it and price detaches from its moving averages.
How do I know a parabolic move is ending?
Watch for a blow-off bar closing well off its extreme, sharply expanding volatility, momentum divergence, and a failed new high that closes back inside the previous range. None of them times the top exactly.
Why do parabolic moves collapse so fast?
Because the late buying was driven by the price rise itself. When new buying stops arriving there is nothing underneath, and late positions exit together, triggering stops below them.
How far do they retrace?
Frequently back towards the level where the acceleration began, since everything above that was built on momentum. What comes next ranges from a pause to a full reversal.
Should I short a parabolic move?
Not into strength. The move can extend further and squeezed shorts help fuel it. Waiting for a structural break gives a defined invalidation instead of a guess at the top.
Do parabolic patterns happen in forex?
Less often than in gold or crypto, because currencies are relative prices anchored by rates and trade flows. When they do appear it is usually around a policy shock. Trading involves risk, results are not guaranteed, and past performance is not indicative of future results.

About the author
Written by Dominic Walsh, a Forex trader and MT4/MT5 indicator, Expert Advisor and script developer. Every tool on forexmt4systems.com is tested on live charts before release and ships with ready-to-use compiled MT4 (.ex4) and MT5 (.ex5) files. Learn more about the trader and developer behind this site.
How we build, test and correct every tool: Editorial & Testing Policy. Trading carries risk; see the disclaimer.