
Overconfidence in trading rarely feels like a problem while it happens. It feels like competence, and that disguise makes it the most expensive bias in the book.
This guide works through overconfidence in trading one mistake at a time. Each section names the habit, shows the damage it does to your numbers, and gives the written fix that holds it back.
What the Bias Actually Describes
Psychologists define the overconfidence effect as confidence that runs ahead of real accuracy. People rate their own judgement higher than the results support.
The classic demonstration asks drivers to rank themselves. Far more than half place themselves above the median, which cannot hold arithmetically.
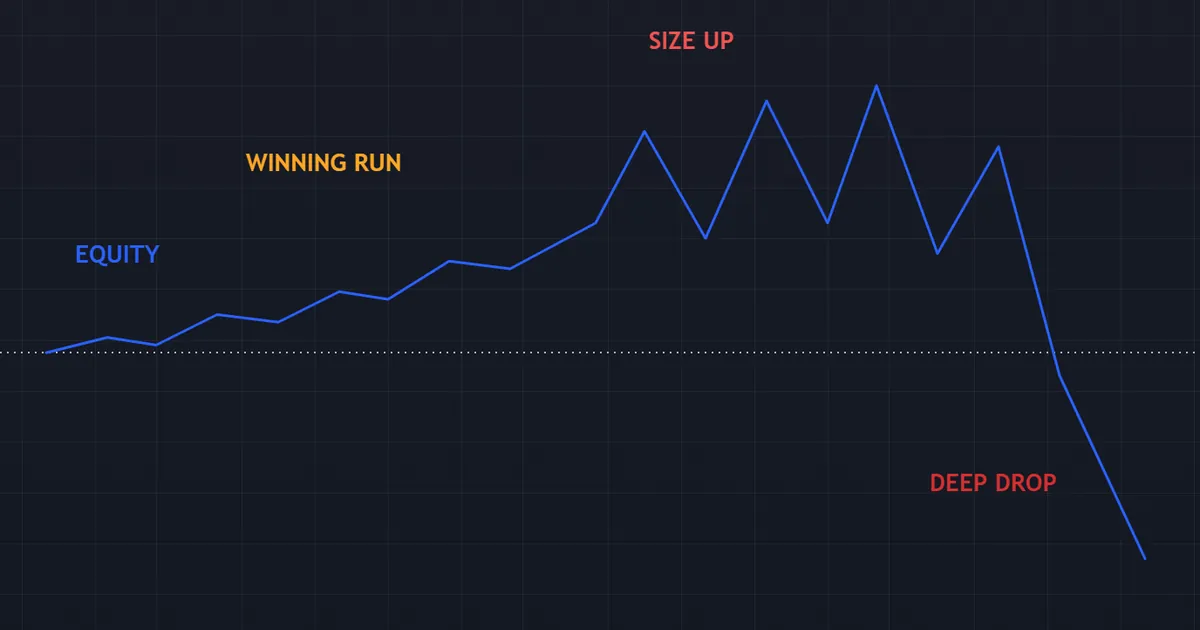
The equity curve above shows the trading version. A calm rising stretch, then a sudden change of scale, then a drop that erases several weeks.
Notice that the method never changed. Only the size and the care changed, and those two moved together.
Three Flavours of the Same Error
Researchers split overconfidence into three parts. You can overrate your results, overrate the precision of your view, or overrate yourself against other traders.
All three reach the platform through the same door. Because each one makes a wider stop or a bigger lot feel justified, the effect on your account looks identical.
The Dunning-Kruger Pattern
The Dunning-Kruger effect describes a familiar shape. Beginners often rate their competence far above their measured skill, while experienced people rate themselves a little below.
Researchers still argue about how much of that pattern reflects measurement. Even so, the trading version rings true, because a first profitable month teaches nothing about a bad one.
Confidence Is Not the Problem
You cannot trade at all without some belief in your method. Doubt makes entries late, exits early and reviews useless.
The problem starts when belief outruns the evidence behind it. So the test lies in your record rather than in how sure you feel.
Why Markets Reward It Briefly
A rising market makes almost any long trade work. So a beginner in a trend collects evidence of skill that the trend actually supplied.
Then conditions change and the same approach fails. Because the lesson arrived with the wrong label attached, the trader blames the market rather than the method.
How Overconfidence Builds
The bias does not appear from nowhere. It grows through a short and very repeatable sequence.
- A run of winning trades arrives, often helped by calm conditions.
- The mind credits skill rather than the market or the sample size.
- Checks get shorter, because the checks now feel unnecessary.
- Position size drifts upward without any written decision.
- The first normal losing cluster costs several times its usual amount.
Each step follows sensibly from the one before. So the whole build happens without a single moment of recklessness.
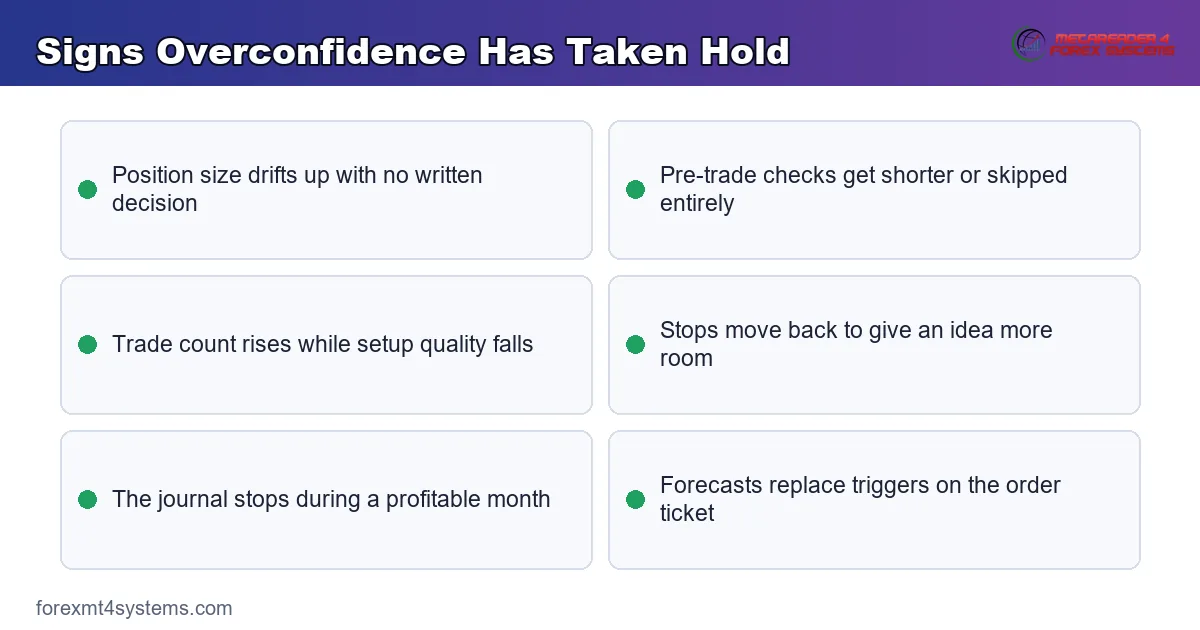
The key points panel above lists the warning signs in one place. Read it after a good week rather than after a bad one.
Timing matters here more than content. Because the bias peaks while everything looks fine, a review scheduled for good weeks catches far more than a post-mortem.
Where the Drift Shows Up in Your Numbers
Feelings make a poor test. Your log, though, records the drift in plain figures.
| What to measure | A steady month | A month with drift |
|---|---|---|
| Average risk per trade | Flat, matching the plan | Rising week by week |
| Trades per week | Close to your normal count | Well above it |
| Stops moved after entry | None | Several, each with a story |
| Checklist ticks | One per trade | Missing on the busy days |
| Journal entries | One per trade | Gaps during the good weeks |
| Largest single loss | Close to the planned figure | Two or three times larger |
None of those rows need judgement. So the check takes a minute and gives you a straight answer.
Pick the row that moved most. That row names the habit worth fixing first.
Overconfidence in Trading, Mistake by Mistake
Seven habits carry almost all of the damage. They usually arrive in this order, and they reinforce one another.
Work through them slowly. For each, ask whether your last two weeks contained anything similar.
Size Creep After a Winning Run
This mistake ends more accounts than any other on the list. Risk drifts from half a percent to two, with no decision recorded anywhere.
The damage arrives on the next ordinary losing cluster. Four losses that used to cost two percent now cost eight, which turns a routine week into a serious drawdown.
So write your risk per trade into the plan and hold it through streaks. Our guide to position sizing covers how to set that figure properly.
Set a hard ceiling as well as a target figure. Then any lot above that ceiling needs a written note before the order goes in.
Skipping the Pre-Trade Checks
Confidence shortens routines first. The higher-timeframe check goes, then the news check, then the reason you wrote for entry.
Nothing bad happens for a while, which appears to prove the checks were pointless. Then a scheduled release arrives during a trade you never checked.
So keep the checklist physically in view and tick it every time. A routine that survives good weeks stays available during bad ones.
Keep the list short enough to finish. Five items you always tick beat twenty you tick once.
Trading Far Too Often
Confidence turns marginal setups into acceptable ones. Trade count rises, and the average quality falls.
Academic studies of retail brokerage records found the same pattern repeatedly. The most active accounts kept less of their gross return once costs came out.
So cap trades per week and count them honestly. Our guide to overtrading explains how the costs accumulate.
The spread and the commission never take a week off. So each extra trade needs to earn its keep before it helps you at all.
Widening Stops to Avoid Being Wrong
An overconfident trader trusts the idea more than the level. So the stop moves back to give the trade room it never earned.
Your recorded risk and your real risk now differ. The log says half a percent while the account says two.
So place the stop with the broker at entry and leave it alone. If the level genuinely needs more room, reduce the size instead of moving the line.
A moved stop also poisons your data. Because the log now shows a risk you did not take, every later review starts from a false number.
Adding Leverage Because It Worked Before
Leverage flatters a good stretch and punishes a bad one. Traders raise it after wins, which puts the largest exposure right before the first setback.
The maths gets brutal quickly. Deeper drawdowns need much larger gains to recover, so a doubled size does not simply double the pain.
So read our note on leverage in forex, then check your exposure with our risk of ruin calculator.
Leverage also shortens your thinking time. When a normal move swings the balance sharply, calm decisions become much harder to make.
Abandoning the Journal
Records feel like admin when results look good. So the log stops exactly when the behaviour starts drifting.
Two months later nobody can say when the size changed. The trader remembers a bad market rather than a gradual decision.
So keep a trade journal running through good months especially. Because memory reconstructs a flattering story, the written note gives you the only honest version.
One line per trade does the job. Note the risk, the reason and the level that would end the idea.
Predicting Instead of Reacting
Overprecision shows up as certainty about direction. Traders start calling tops and bottoms rather than trading a setup.
A forecast carries no invalidation level with it. So the position stays open while the reasoning quietly changes to fit the price.
So trade the trigger, and write the level that ends the idea. Forecasts belong in a notebook, never on an order ticket.
Strong views also make you slow to exit. Because the view outlives the setup, the position stays open long after the reason for it went.
Dropping the Risk Rule for One Special Trade
Every trader meets a setup that looks better than the rest. The rule then bends once, for good reasons, on that trade alone.
That single exception does more damage than a bad month. Because you cannot tell in advance which trade fails, the best-looking one carries the same odds as the others.
So allow no exceptions to the size rule at all. If a setup genuinely deserves more, change the rule at a review and apply it to every trade.
Ignoring Costs Because Results Look Good
Spreads, swaps and commissions barely register during a strong run. They keep working all the same.
An overconfident trader raises both size and frequency together, so the cost line grows twice. That total often surprises people at the end of a quarter.
So add a cost column to your log and read it monthly. Because the figure sits beside your gross result, the trade-off becomes obvious.
A Worked Example of Size Creep
Take a trader with a solid method and half a percent risk per trade. Six winners arrive over two weeks, helped by a clean trend.
Confidence rises, and the plan starts to look conservative. So risk moves to one percent, then to two after another good session.

Nothing about the strategy changed at all. The signals, the pairs and the sessions stayed exactly the same.
Then five losses arrive, which any honest method produces regularly. At half a percent those five cost two and a half percent, and at two percent they cost ten.
What the Numbers Do Next
A two and a half percent dip needs a small recovery. A ten percent hole needs eleven percent to get back, and the trader now feels shaken.
So the second problem arrives on top of the first. Because a rattled trader sizes badly in both directions, the drawdown lasts far longer than the losses justify.
Run your own numbers rather than trusting the feeling. Our expectancy calculator shows what a realistic sequence does to your account.
One detail deserves a second look. The six winners that started this story were entirely normal, so nothing in them called for a bigger position.
So the drift began with a reading of the past, not with any new information. That is the whole bias in a single sentence.
Download the complete indicator database
Put these concepts on your charts. One email unlocks the full library of 1,380+ indicators with compiled MT4 and MT5 files, plus my TradingView scripts. No paywall, no spam, unsubscribe any time.
Get free access to my indicator database
One email unlocks 1,380+ free MT4, MT5 and TradingView indicators — the complete library. No single-tool download; you get the whole database.
Mistakes Traders Make While Correcting It
The correction goes wrong almost as often as the bias itself. These five errors waste the effort.

The comparison graphic above sets each overconfident habit beside the written fix that holds it. Keep it where you can see it during a good run.
Swinging Into Timidity
A shaken trader cuts size to a tenth and skips valid setups. That reaction feels responsible and costs just as much.
So return to your written figure rather than to a mood. One fixed number removes both extremes at once.
Treating Every Win as a Warning
Winning runs happen naturally with any positive edge. Suspecting yourself after every good week creates a different problem.
So judge the behaviour rather than the result. If the size, the checks and the trade count stayed put, the run needs no correction.
Adding Rules Instead of Following One
Traders answer a size problem with ten new rules. The list collapses within a fortnight.
So fix the size rule alone and prove it for a month. Because one habit generates most of the damage, one habit deserves the whole month.
Confusing Confidence With Overconfidence
You need confidence to place a trade at all. Hesitation carries its own costs, and doubt makes execution worse.
So test the feeling against the record. Confidence backed by a hundred logged trades differs completely from confidence backed by six.
Reviewing Only After Losses
Most traders review a bad month closely and skim a good one. The drift, though, starts inside the good month.
So schedule the same review after strong stretches. Read our note on a losing streak in trading for the matching problem at the other end.
Announcing the Fix in Public
Some traders post a promise to trade smaller and treat that as the work. Public words feel like progress and change nothing.
So write the rule where you trade, not where people read. A number taped beside the screen beats a promise made to strangers.
A Four-Week Reset for Size Drift
A drifting size rule needs proof, not a fresh promise. Four weeks gives you both a reset and a record.
- Week one: trade at half your written risk and log every trade.
- Week two: hold that size and tick the checklist on every entry.
- Week three: return to your full written risk, with the size fixed for the week.
- Week four: repeat week three, then compare all four weeks side by side.
- Change the risk figure only after that review, and write the reason down.
The point lies in the record rather than the smaller size. So by week four you can see whether the drift came back on its own.
Most traders find one week where the count crept up. That week usually followed the best day of the month.
Overconfidence Self-Check
Run this list at the end of every profitable week. It takes a minute and catches drift early.
- Compare this week’s average position size with last month’s average.
- Count the trades taken and compare that with your normal weekly count.
- Check whether any stop moved after entry, and note why.
- Confirm the pre-trade checklist got ticked on every trade.
- Look for setups taken outside your written criteria.
- Count the journal entries against the number of trades placed.
- Ask what conditions helped, and write one sentence about them.
Any gap between those answers and your plan marks the drift. So correct the gap while the account still looks healthy.
Pitfalls and Edge Cases
A few wrinkles bend the tidy picture, so keep them in view. The equity curve below shows a quiet month erased in one oversized session.

Notice how small the earlier gains look beside that single drop. Several weeks of careful work vanished inside a few hours.
A Calm Market Feels Like Skill
Low volatility flatters almost every method. Stops rarely get hit, and targets fill politely.
So a trader concludes that the approach improved. Because the conditions did the work, the conclusion breaks as soon as ranges widen.
A New Tool Can Restart the Cycle
A fresh indicator or a new template brings its own optimism. Traders raise size to match the excitement rather than the evidence.
So treat every change of tool as a change of method. Start at reduced risk, gather a proper sample, and only then return to your normal figure.
Small Samples Prove Nothing
Ten trades tell you almost nothing about a strategy. Random sequences produce long runs in both directions.
So wait for a meaningful sample before changing anything. A hundred trades gives you a rough picture, and several hundred gives you a better one.
Sample size also explains the strange timing of this bias. Because your confidence peaks early and your evidence arrives late, the two rarely line up when you need them to.
Underconfidence Costs Money Too
The opposite problem also damages accounts. Traders who doubt everything hesitate, enter late and cut winners at the first wobble.
So the aim involves calibration rather than modesty. Because both extremes come from ignoring the record, the same journal fixes both.
Other People Feed the Bias
A good month attracts praise, questions and requests for calls. Attention makes a trader defend the view rather than test it.
So keep your process private while a run continues. Because an audience raises the cost of changing your mind, silence protects the next decision.
When the Pressure Grows Beyond Trading
Escalating size, hidden losses and borrowed money point past a trading habit. Those signs deserve a serious response.
If trading affects your sleep, your finances or your relationships, step away and seek qualified professional support. That decision protects far more than an account.
Related Concepts to Study Next
Overconfidence sits inside a wider family of thinking errors, so read across the set rather than in isolation. Start with our overview of what trading psychology covers, then work through the full list of cognitive biases in trading to see how this one connects to the rest.
Risk control finishes the job that awareness starts, because a fixed sizing rule removes the room this bias needs. So pair the reading above with a written plan you can check at the end of every week.
FAQ
How do I know whether I am overconfident right now?
Compare numbers rather than feelings. Check your average position size, your trade count and your checklist compliance against the same figures from a month ago. Any upward drift without a written decision answers the question for you. The log settles in a minute what argument never settles at all.
Does overconfidence only affect beginners?
No, and experienced traders often hide it better. A long record creates authority, so the size increase arrives with a more convincing story attached. The measurable signs stay the same at every level. Years of records help only when somebody still reads them each month.
What is the single most effective fix?
A fixed risk per trade, written down and held through streaks. That one rule blocks size creep, limits the damage from skipped checks, and keeps a losing cluster survivable. Everything else on the list matters less. Write the number on paper, and place it where you enter orders.
Should I reduce size after a big winning run?
Not automatically, because that swings you into the opposite error. Return to your written figure instead, and change it only through a planned review with a reason recorded. Deliberate changes belong in the plan, never in the moment. A monthly review gives you a natural slot for that kind of decision.
How is overconfidence different from having an edge?
An edge shows up as a measured result across a decent sample of trades. Overconfidence shows up as certainty without that sample behind it. One survives a bad month, and the other does not. So the honest question asks how many trades sit behind your belief.
How long does it take to fix?
Expect a few months of consistent records rather than a quick correction. The rules take effect straight away, and the confidence question only settles once you have watched yourself through a losing stretch. Track the behaviour first, and let the account follow. Most traders see the size column settle well before the equity curve reflects the change. Results are not guaranteed; past performance is not indicative of future results.
External references
- For background on this concept, see Overconfidence Bias at Corporate Finance Institute.
- For broader market context, see Dunning-Kruger Effect on Wikipedia.

About the author
Written by Dominic Walsh, a Forex trader and MT4/MT5 indicator, Expert Advisor and script developer. Every tool on forexmt4systems.com is tested on live charts before release and ships with ready-to-use compiled MT4 (.ex4) and MT5 (.ex5) files. Learn more about the trader and developer behind this site.
How we build, test and correct every tool: Editorial & Testing Policy. Trading carries risk; see the disclaimer.