
The best EMA for intraday trading is the question this guide answers with data rather than opinion. We measured five common lengths (9, 20, 50, 100 and 200) on 15-minute charts of nine symbols over fourteen months. The short answer: no length stood out. Pullback tests held between 22.8% and 25.6% of the time for every EMA we tried. What length changes is how often price crosses the line, and this guide settles that trade-off.
What an exponential moving average is
An exponential moving average (EMA) is an average of closing prices that gives more weight to recent bars. A simple moving average treats every bar in its window the same. The EMA does not. So it turns faster when price turns, and it lags less than a simple average of the same length.
The length is the one setting that matters most. A 9 EMA follows price closely and reacts to every small swing. A 200 EMA moves slowly and shows the broad drift of the last few days on a 15-minute chart. Our moving averages explained page covers the family in general. If you are unsure which type to use, our SMA vs EMA comparison walks through the difference in lag.
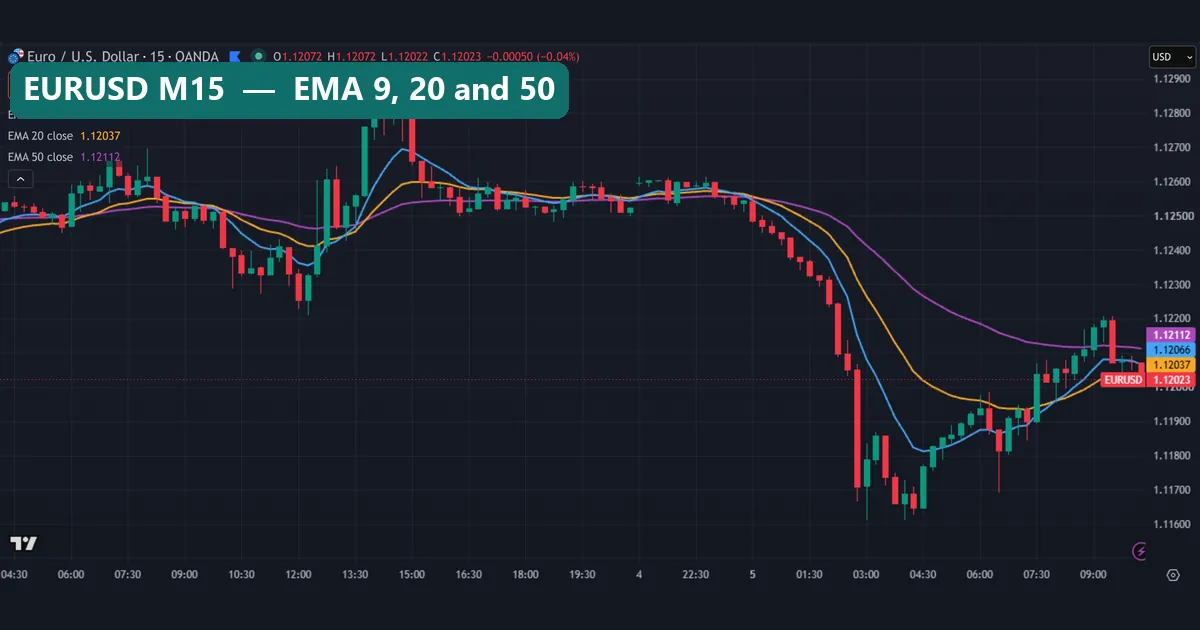
The image above shows this on EURUSD M15. The blue 9 EMA hugs the candles, the orange 20 sits further back, and the purple 50 trails well behind the overnight drop.
How the EMA formula works
Each new EMA value blends the latest close with the previous EMA value. The formula is short:
EMA(today) = alpha x Close(today) + (1 - alpha) x EMA(yesterday), where alpha = 2 / (N + 1) and N is the length.
For a 20 EMA, alpha is 2/21, so the newest close carries a bit under a tenth of the weight. The rest comes from the old EMA value, which holds every earlier close in shrinking amounts. A longer length means a smaller alpha, so each new bar moves the line less.
The first value needs a starting point. Most platforms seed the EMA with a simple average of the first N closes, then run the formula from there. TradingView describes its own calculation in its exponential moving average help page at TradingView. For the general maths behind weighted and exponential averages, the moving average article on Wikipedia is a clear reference.
So an EMA is a smoothed copy of price, nothing more. Any edge has to come from how you use it.
How we tested EMA lengths on M15
We read 15-minute history from a MetaTrader 4 terminal (Capital Point Trading, MetaTrader 4, build 1471). The window ran from 2 June 2025 to 26 August 2026. It covered nine symbols: AUDCAD, AUDUSD, EURUSD, GBPUSD, NZDCAD, USDCAD, USDCHF, USDJPY and XAUUSD. We then calculated EMAs of 9, 20, 50, 100 and 200 bars on M15 closes.
We measured two things. First, crosses: how many times per day the close changed side of the EMA. Second, pullback tests. A test needed the previous 10 closes all on one side of the EMA, and then a bar whose wick touched the line. A test “held” if that bar’s close and the next 4 closes stayed on the original side. That matches what most traders mean by “the EMA held”.
The chart images come from the TradingView web chart with OANDA data, captured on 5 October 2026. The bar charts are our measurement from the MT4 history. None of these results include spread or commission. Our method notes sit in the editorial testing policy.
EMA settings in MT4 and TradingView
Both platforms ship a built-in EMA. The input names differ a little, as the table shows.
| Input | MetaTrader 4 name | TradingView name | Value in our test |
|---|---|---|---|
| Length | Period | Length | 9, 20, 50, 100, 200 |
| Average type | MA method: Exponential | Built-in EMA study | Exponential |
| Price used | Apply to: Close | Source: close | Close |
| Shift | Shift | Offset | 0 |
| Chart timeframe | M15 | 15 minutes | M15 (H1 in one image) |
Keep the shift at 0. A shifted line makes old touches look cleaner than they were. In MT4 the same average is available to coders through the iMA function, which the iMA reference in the MQL4 documentation describes. Also note that the timeframe is part of the setting. A 20 EMA on M15 covers five hours of bars, while the same 20 on H1 covers twenty hours.
Best EMA for intraday trading: what our numbers show
Here is the full result. Read the held column first.
| EMA length | Crosses per day | Pullback tests | Held next 5 bars |
|---|---|---|---|
| 9 | 19.4 | 15,368 | 22.8% |
| 20 | 13.4 | 14,926 | 22.9% |
| 50 | 8.5 | 11,310 | 25.6% |
| 100 | 5.8 | 8,371 | 25.3% |
| 200 | 4.0 | 5,931 | 25.6% |
The spread between the best and worst held figure is under three percentage points. Most tests failed for every length: roughly three in four first touches did not hold for five bars. So there is no “best” EMA in this data. Longer lengths held slightly more often, but the gap is small and says nothing about profit.
The cross column is where length matters. A 9 EMA got crossed 19.4 times per day on average. A 200 EMA got crossed 4.0 times per day. That is the real choice: a fast line that flips often, or a slow line that flips rarely but late.
Reading EMAs on an intraday chart
The GBPUSD one-hour chart below marks two tests of the 20 EMA from above. Both failed within five bars.
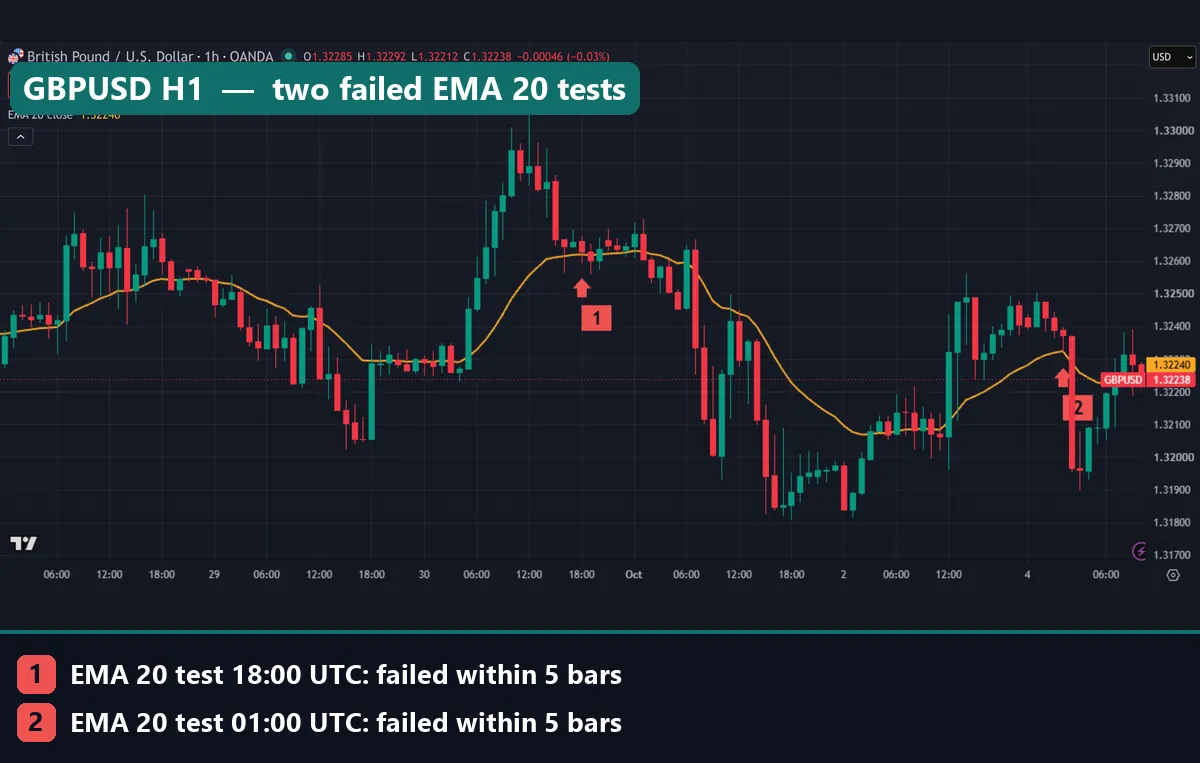
Marker 1 sits at 18:00 UTC on 30 September 2026. The bar’s low dipped to 1.32594, under the EMA at 1.32620, and the close at 1.32628 sat just above it. Still, price closed below the line within the next four bars. Marker 2 at 01:00 UTC on 5 October 2026 looked even better: the low touched 1.32320 against an EMA of 1.32324, and the bar closed higher at 1.32372. However, the very next hour fell to a close of 1.31966.
The gold chart shows a different habit. On XAUUSD M15 the 20 and 50 EMAs track a spike above $4,220 and the drop after it. Then both lines flatten, and price chops through the 20 EMA for hours.
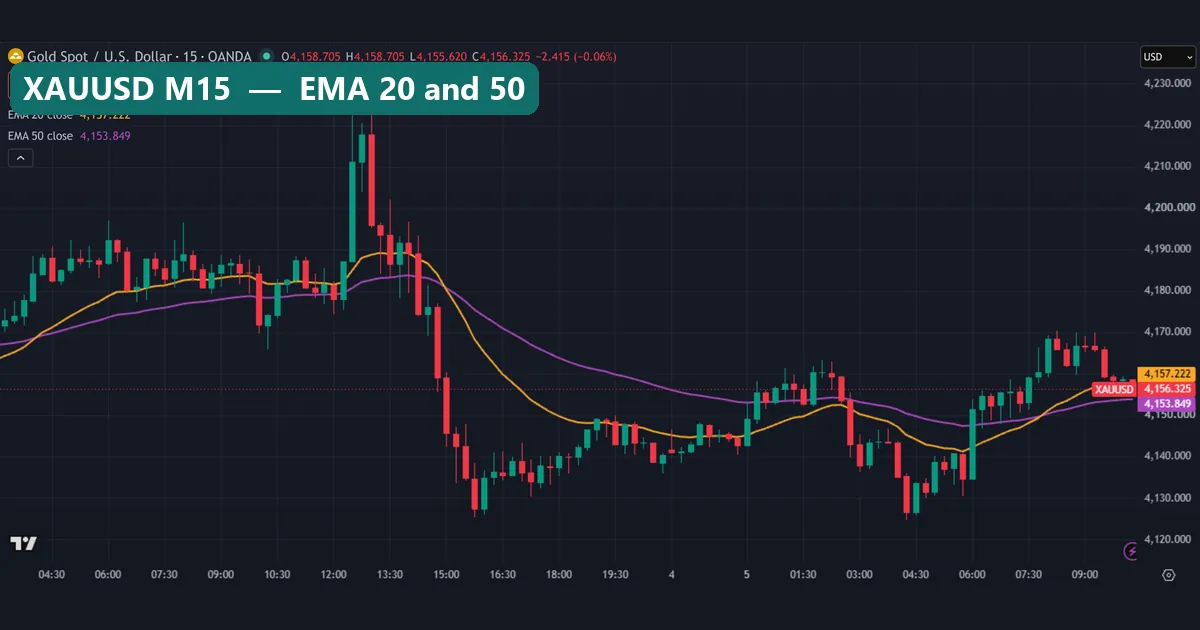
So the slope tells you more than the touch. When the EMA points steeply in one direction, a touch has a trend behind it. When the line runs flat, a touch is just price crossing an average. Our 20 EMA guide looks at that one length in more depth.
Worked example: EURUSD M15 on 5 October 2026
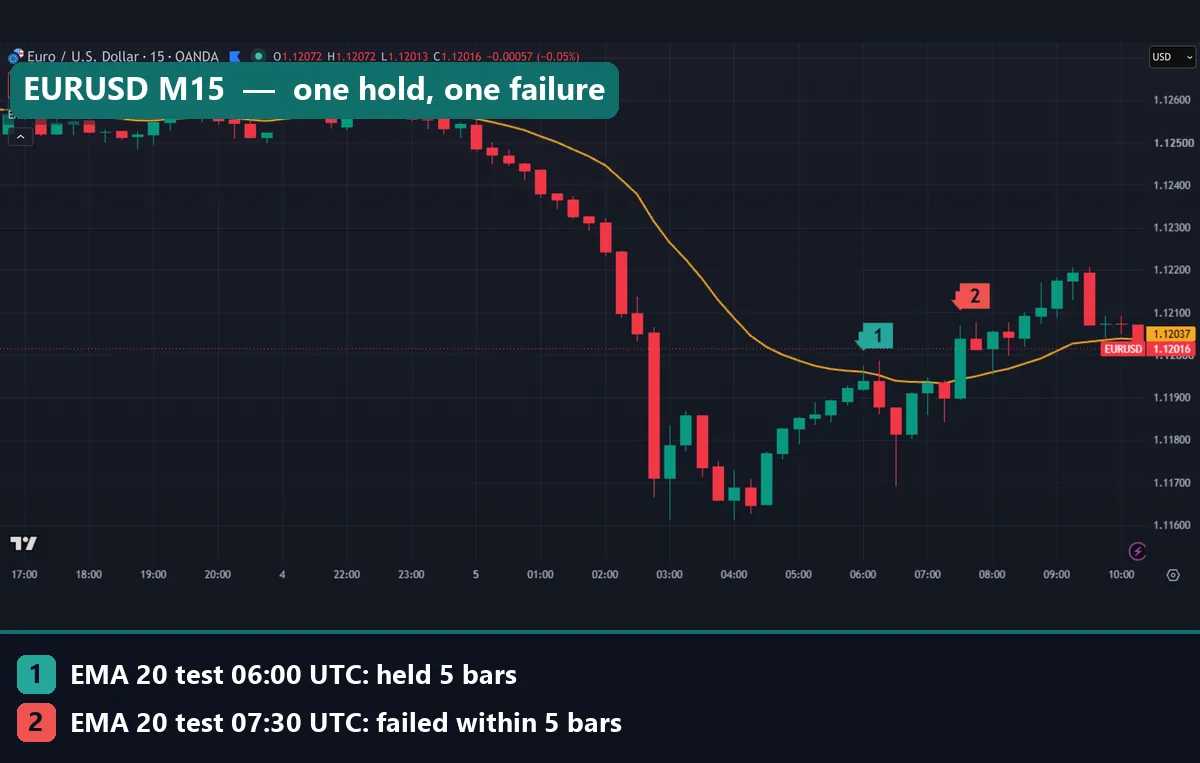
This example uses EURUSD M15 on 5 October 2026, pictured in the failures section. Price fell from above 1.12500 to below 1.11700 overnight. Then it climbed back to the 20 EMA from below.
First test, 06:00 UTC. The bar opened at 1.11920 and reached a high of 1.11975. The 20 EMA stood at 1.11960, so the wick poked just through it. The bar closed at 1.11938, back under the line. Then the next four closes also stayed below. By our rule, this test held for five bars.
Second test, 07:30 UTC. The bar opened at 1.11900 and ran to 1.12069. It closed at 1.12038, well above the EMA at 1.11943. That close alone broke the test, so it failed on the same bar. Price then kept climbing toward 1.12200 over the next hours.
Two lessons follow. One “held” test does not make the next one safer. Also, the held rule looks only five bars ahead. A hold is not a profitable trade, because it says nothing about distance. To size such moves, our guide on using ATR for day trading scales targets and stops to volatility.
Crosses versus holds: the real trade-off
The first bar chart counts crosses per day. The 9 EMA flips almost five times as often as the 200 EMA.
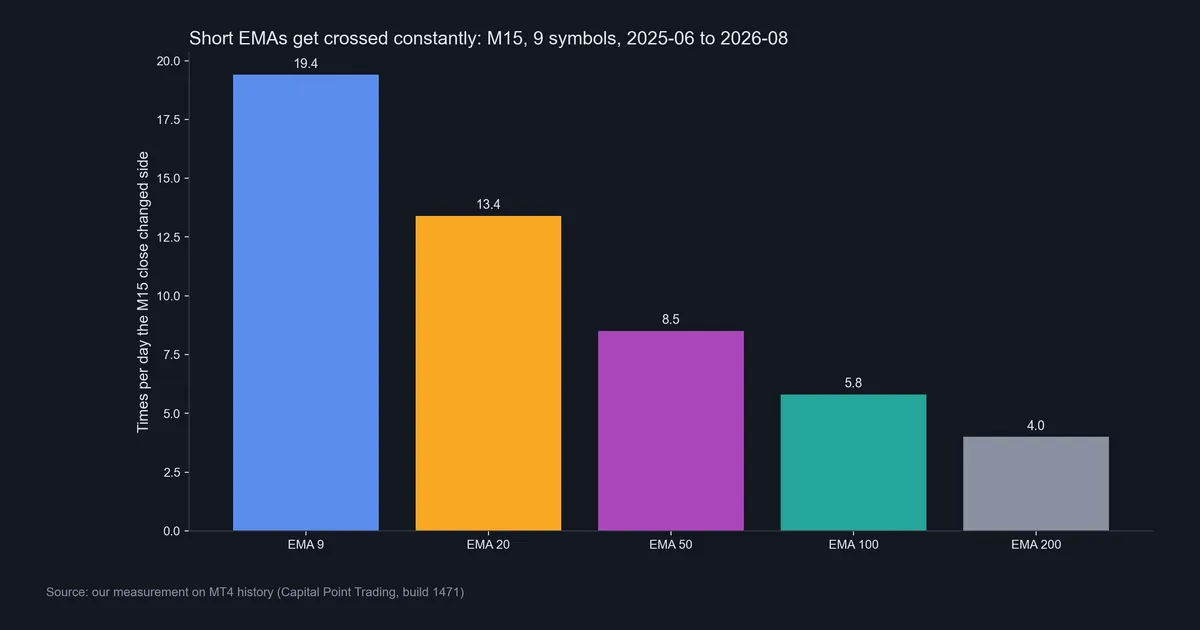
For a cross trader, every flip is a potential entry, and few of them come with a reason. Each of those trades pays the spread. Our page on backtesting transaction costs explains why a high trade count can turn a flat result into a losing one.
The second chart shows the held share for pullback tests, with the sample size under each bar. The samples are large, from 5,931 tests for the 200 EMA up to 15,368 for the 9. So the flat result is not a small-sample accident.
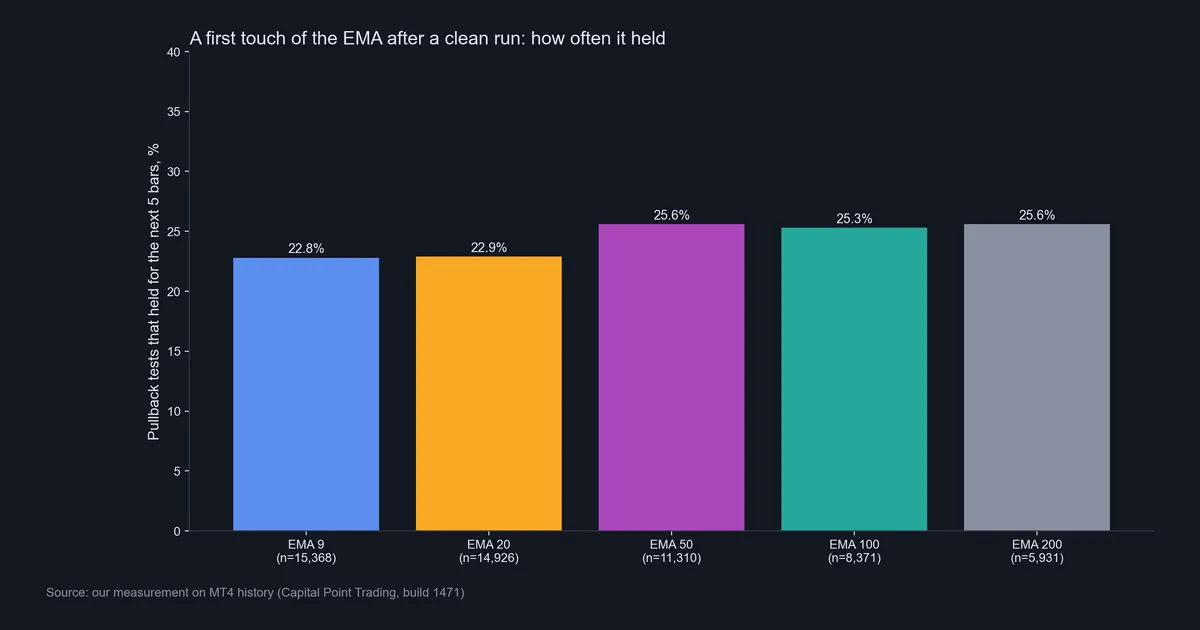
In short, a longer EMA gives fewer, slower signals and a slightly higher held share. A shorter EMA gives more, faster signals and a slightly lower held share. Neither one turns a touch into a reliable entry by itself. So treat the EMA as context and find the entry reason elsewhere.
Download the complete indicator database
Put these concepts on your charts. One email unlocks the full library of 1,380+ indicators with compiled MT4 and MT5 files, plus my TradingView scripts. No paywall, no spam, unsubscribe any time.
Get free access to my indicator database
One email unlocks 1,380+ free MT4, MT5 and TradingView indicators — the complete library. No single-tool download; you get the whole database.
Where it fails
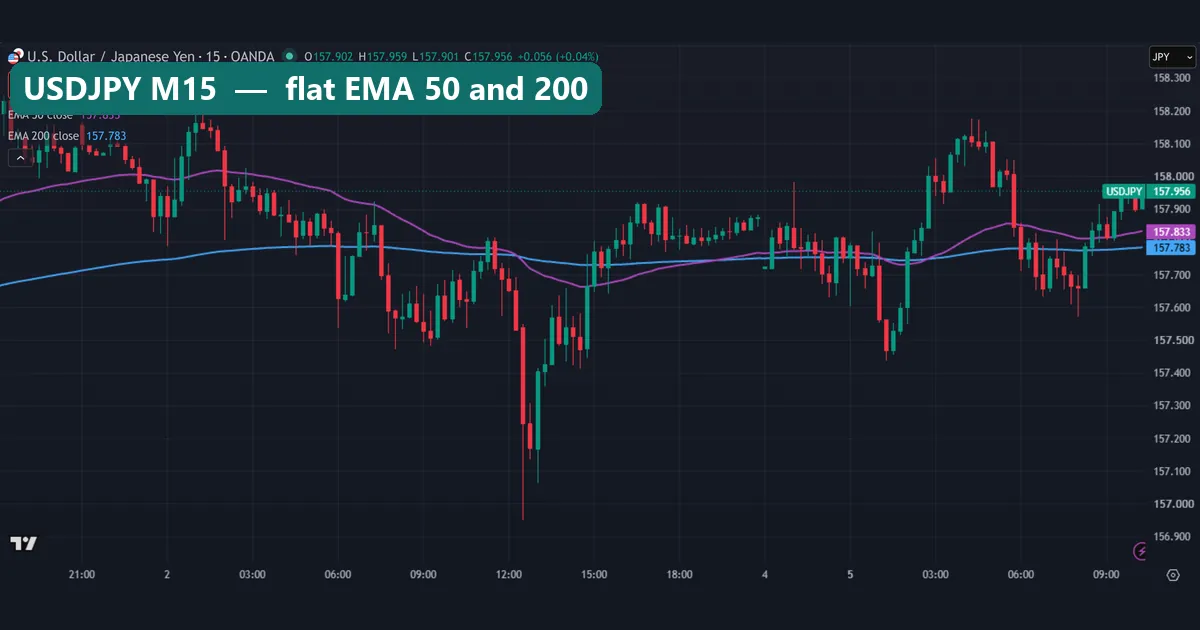
EMAs fail in flat markets. When price moves sideways, the EMA flattens and runs through the middle of the candles. Touches and crosses then come constantly and mean little. The USDJPY M15 chart below shows this. The 50 and 200 EMAs sit almost on top of each other, near 157.833 and 157.783 at the right edge, and price crosses both of them again and again.
They also fail on fast reversals. An EMA only learns about a turn after the closes arrive. On the EURUSD chart below, price ripped from the 06:00 test to a close above the 20 EMA at 07:30. The line was still sloping down, so a rule that waits for the EMA to turn acts late.
News and session opens cause a third failure. One large bar can jump straight through any EMA, so a stop placed just behind the line offers little cover. Our London trading session page explains how activity changes when a major session opens.
Finally, our test has limits of its own. It covers nine symbols on one broker’s feed for fourteen months. It ignores costs. It checks only five bars of holding, not whether a trade paid.
Common mistakes with intraday EMAs
1. Hunting for a magic length. Many traders keep swapping lengths, looking for the one that “works”. Our data shows the held share barely moves across lengths. Pick one and stop tuning it.
2. Trading every cross. A 9 EMA crosses 19.4 times per day on M15 in our sample. Most flips carry little meaning on their own. Without a filter, a cross system takes all of them and pays the spread each time.
3. Ignoring the slope. A touch of a flat EMA is not a pullback. Check that the line points clearly one way first. Our multi-timeframe analysis guide shows how a higher timeframe helps.
4. Judging a rule on a handful of trades. Two good holds on a screenshot prove nothing. Our counts used thousands of tests per length. Before you trust any EMA rule, read our notes on backtest sample size and test it across several symbols.
How to pick a length for your own trading
Start with your holding time, not with the EMA. If you scalp and hold trades for minutes, a 9 or 20 EMA on M15 gives you a reference that keeps up with price. That said, expect many crosses. Our scalping in forex guide explains how that style handles noise.
If you hold trades for several hours, a 50 EMA is a calmer filter. It crossed 8.5 times per day in our data. Also, a 200 EMA on M15 works as a broad bias line for the session. Trade only in the direction of its slope, and wait for a separate entry reason.
Then test your choice on your own pairs and session. Our intraday trading page covers routines, and the MT4 tester lets you check rules against history before you risk money.
Where to go next
If you want a wider toolkit around the EMA, our list of day trading technical indicators shows what pairs well with a trend line. Our page on leading vs lagging indicators explains why every moving average reacts late. For several EMAs in one study, see the multi moving average indicator.
For outside reading, StockCharts covers SMA and EMA side by side in its moving averages lesson at StockCharts ChartSchool.
FAQ
What is the best EMA for intraday trading?
Our data does not show one. On M15 charts of nine symbols, pullback tests held between 22.8% and 25.6% of the time for the 9, 20, 50, 100 and 200 EMA. Choose a length by how often you want signals, not by a hoped-for edge.
Is the 9 EMA or the 20 EMA better for day trading?
They held almost equally often in our test, at 22.8% and 22.9%. The difference is speed. The 9 EMA crossed 19.4 times per day on average, and the 20 EMA crossed 13.4 times.
Does the 200 EMA work on a 15-minute chart?
It works as a slow bias line. It crossed only 4.0 times per day in our sample, and its pullback tests held 25.6% of the time. That is close to the 50 EMA and not much better than the short lengths.
Should I use an EMA or an SMA for intraday charts?
An EMA reacts faster for the same length because it weights recent closes more. Still, the choice matters less than the length and the way you use the line.
What does “the EMA held” mean in this guide?
Price had closed on one side of the EMA for 10 bars, then a wick touched the line. The test held if that bar and the next 4 bars all closed on the original side.
Which timeframe did you test?
We tested M15 closes from 2 June 2025 to 26 August 2026 in MetaTrader 4, build 1471. One chart in this guide uses GBPUSD on H1 to show two marked tests.
Can I combine two EMAs for entries?
Yes, many traders use a fast and a slow EMA together. However, crosses between two EMAs share the same whipsaw problem in flat markets. Add a filter, such as slope or session, and test the rule with costs included.
Will an EMA strategy make money if I follow these settings?
No setting here showed an edge on its own, and our figures exclude spread and commission. Treat the EMA as context, test any rule on your own data, and size risk with care; results are not guaranteed; past performance is not indicative of future results.
Last updated: 5 October 2026.

About the author
Written by Dominic Walsh, a Forex trader and MT4/MT5 indicator, Expert Advisor and script developer. Every tool on forexmt4systems.com is tested on live charts before release and ships with ready-to-use compiled MT4 (.ex4) and MT5 (.ex5) files. Learn more about the trader and developer behind this site.
How we build, test and correct every tool: Editorial & Testing Policy. Trading carries risk; see the disclaimer.