
How to use MetaTrader 4 comes down to four panels, one menu and a handful of shortcuts. This walkthrough settles which window does what, how to add an indicator, and where the platform lets beginners down. Every screen below comes from our own MT4 terminal, not from a vendor brochure.
What MetaTrader 4 actually is
MetaTrader 4, or MT4, is a desktop trading terminal made by MetaQuotes. Brokers license it and hand it to their clients. So you never buy MT4 itself. Instead, you download the copy your broker supplies and log in with the account it gives you.
The terminal does three jobs. First, it shows live prices and charts. Second, it sends your orders to the broker’s server. Third, it runs small programs: custom indicators, scripts and Expert Advisors (automated strategies). They are written in MQL4, the platform’s own language.
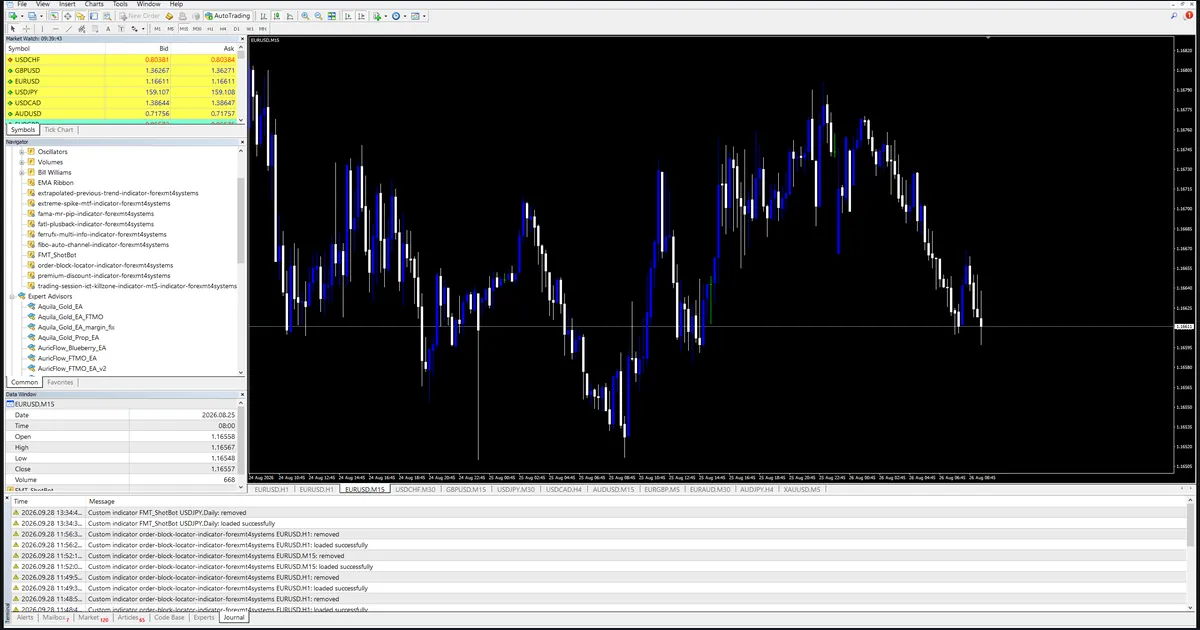
The picture above shows the full window from our test machine. The menu bar and two toolbars sit at the top. Market Watch, Navigator and the Data Window stack down the left side. A EURUSD M15 chart fills the middle, and the Terminal panel along the bottom is open on its Journal tab. The tabs under the chart, from EURUSD,H1 to XAUUSD,M5, are separate chart windows.
Many brokers now offer MT5 next to it. Our guide to the difference between MetaTrader 4 and 5 covers that choice in detail.
How MT4 works behind the screen
MT4 is a client. It holds no prices of its own. Instead, it connects to a trade server run by your broker, and that server streams quotes, stores your account and fills your orders. When the link drops, the terminal keeps showing whatever history it saved last. Then the prices stop moving.
Price history lives on your computer as bar files, one per symbol and timeframe. The timeframe buttons on the second toolbar read M1, M5, M15, M30, H1, H4, D1, W1 and MN. So an H1 chart draws one candle per hour, and a D1 chart draws one per day.
Programs follow the same split. An indicator only reads prices and draws on the chart. A script runs once and stops. An Expert Advisor can also place and close trades, but only while the AutoTrading button on the toolbar is on. It sits next to New Order on the top toolbar.
In short, the terminal is a window onto the broker’s server plus a small program host. For example, a price gap is a data question, while a missing arrow is a program question.
How we tested this walkthrough
We did this walkthrough on MetaTrader 4, build 1471, on Windows, on 28 September 2026. The terminal is our Capital Point Trading MT4 test install. We cropped the title bar and status bar from every capture, because they show account details.
One limit shapes everything below. The terminal was not connected to a live trade server during the session, so every chart shows stored history. That history ends on 26 August 2026. The symbols we used were EURUSD on the M15 and H1 timeframes and USDJPY on the daily timeframe.
Because of that, we did not place any order for this article. The New Order section explains how the window works in general terms only. Every number we quote is visible in one of the seven screenshots. Our editorial testing policy explains how we capture and check platform screens.
The MT4 panels and shortcuts at a glance
Every panel sits in the View menu, but the default shortcuts are faster. Also, each one is a toggle: press once to show, again to hide.
| Panel or window | Shortcut | What it does |
|---|---|---|
| Market Watch | Ctrl+M | Symbol list with Bid and Ask prices |
| Navigator | Ctrl+N | Accounts, indicators, Expert Advisors and scripts |
| Data Window | Ctrl+D | Open, high, low, close and volume under the cursor |
| Terminal | Ctrl+T | Trades, history, alerts, Experts log and Journal |
| Strategy Tester | Ctrl+R | Runs Expert Advisors on past data |
| New Order | F9 | Opens the order ticket for the active symbol |
| Chart properties | F8 | Colors, grid, candle style and scale |
For testing robots, see the MT4 Strategy Tester explained. If the black background or blue and white candles bother you, F8 opens the color settings. Our MetaTrader 4 color scheme guide walks through a readable setup.
How to use MetaTrader 4 panels: Market Watch and Navigator
Market Watch is where every chart starts. It lists the symbols your broker offers, with the Bid price in one column and the Ask price in the next. You sell at the Bid and buy at the Ask. The gap between them is the spread.
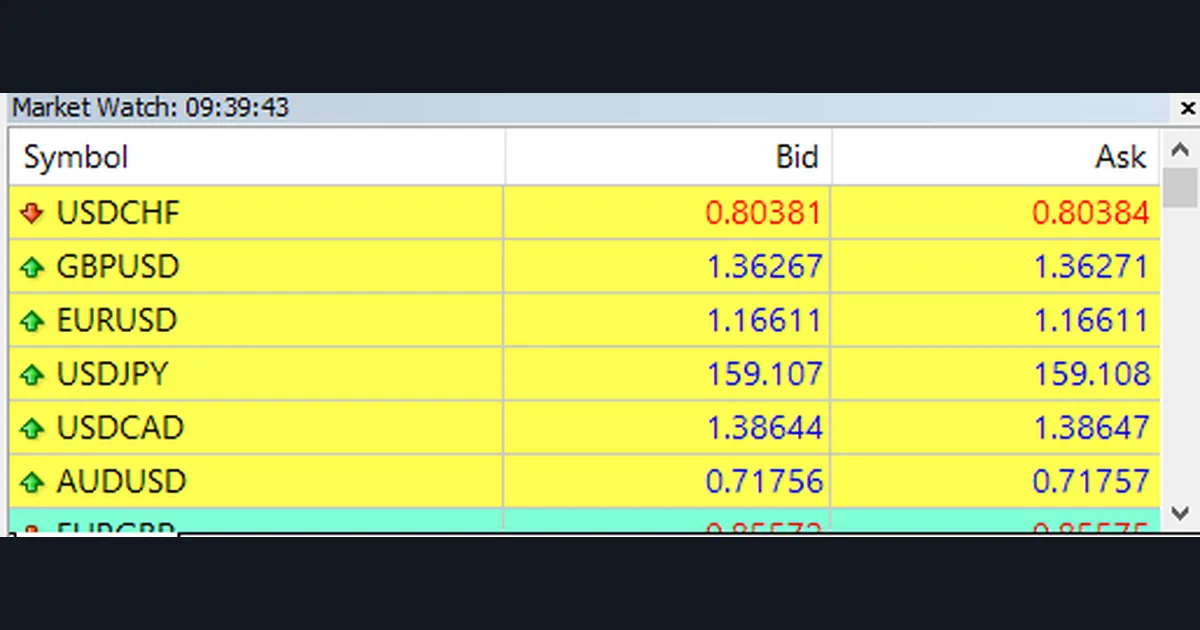
Our Market Watch header reads 09:39:43, the time of the last stored quote. The list shows USDCHF, GBPUSD, EURUSD, USDJPY, USDCAD and AUDUSD. Right-click any row and pick Chart Window to open that symbol. Also, right-click and choose Show All if a symbol you expect is missing, because brokers often hide part of the list.
The Navigator is the program library. It holds your accounts, the built-in indicators, your custom indicators, Expert Advisors and scripts. To use an item, drag it onto a chart or double-click it.
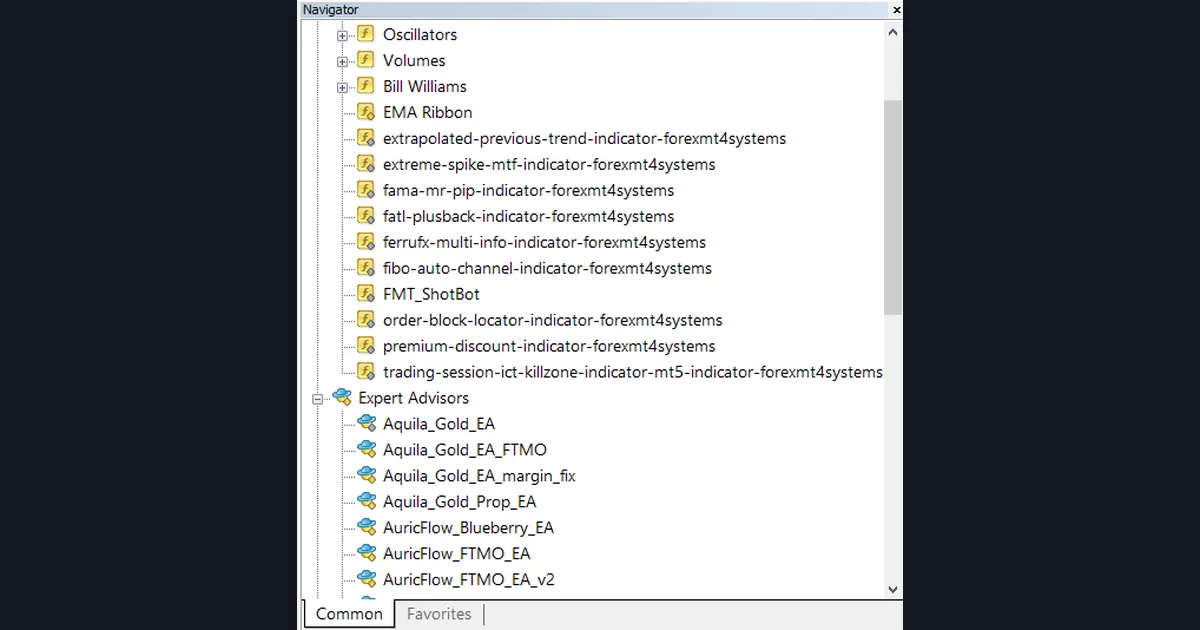
In our Navigator, the built-in indicators sit in folders called Oscillators, Volumes and Bill Williams. Below them come custom indicators, such as EMA Ribbon and order-block-locator-indicator-forexmt4systems. Then the Expert Advisors branch opens, starting with Aquila_Gold_EA. A custom file only appears here once it sits in the right data folder. Our guide on how to install MT4 and MT5 indicators shows exactly where it goes.
Worked example: reading prices and one candle
Now use the panels to read real numbers. First, look at the spread in Market Watch. USDCHF shows a Bid of 0.80381 and an Ask of 0.80384. So the spread is 0.00003, or 3 points on a five-digit quote. GBPUSD shows 1.36267 and 1.36271, a 4-point spread.
EURUSD is the odd one. Both columns read 1.16611, which looks like a zero spread. However, that is a stale quote on a disconnected terminal, not a free market. Lesson one: check that prices move before you trust them. For the maths of points and pips, see pips vs points and our note on the spread in forex.
Next, read one candle with the Data Window. In our first screenshot the cursor sits on the EURUSD M15 bar dated 2026.08.25 at 08:00. The Data Window lists Open 1.16558, High 1.16567, Low 1.16548 and Close 1.16557, with a Volume of 668. Because the close sits just under the open, that bar is a small bearish candle. Its full range is 1.16567 minus 1.16548, which is 19 points.
Volume in MT4 counts price updates, not traded lots. If candle anatomy is new to you, our guide on how to read candlestick charts covers bodies and wicks.
Opening a clean chart and finding the indicators
To open a chart, right-click a symbol in Market Watch and choose Chart Window. Then click a timeframe button on the toolbar. We opened USDJPY and clicked D1, which gave the clean daily chart below.
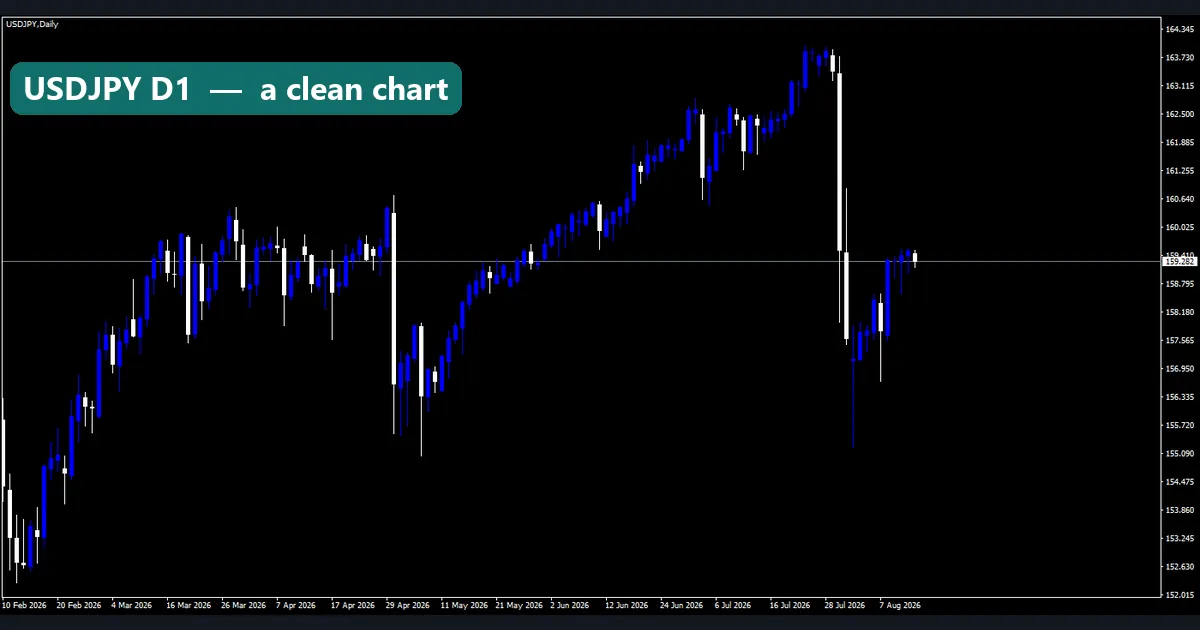
This chart runs from 10 Feb 2026 to the last stored bar in August. USDJPY climbs from the low 152s in February to above 163.7 in late July. Then a run of large bearish candles drops it toward 157.5 within a few days. The horizontal line and grey box on the right edge show the last price, 159.282. No indicator is attached yet: start plain, then add tools one at a time.
Now open the Insert menu and hover over Indicators. The submenu lists six common studies first: Accelerator Oscillator, Accumulation/Distribution, Alligator, Average Directional Movement Index, Average True Range and Awesome Oscillator. Below them sit the groups Trend, Oscillators, Volumes, Bill Williams and Custom.
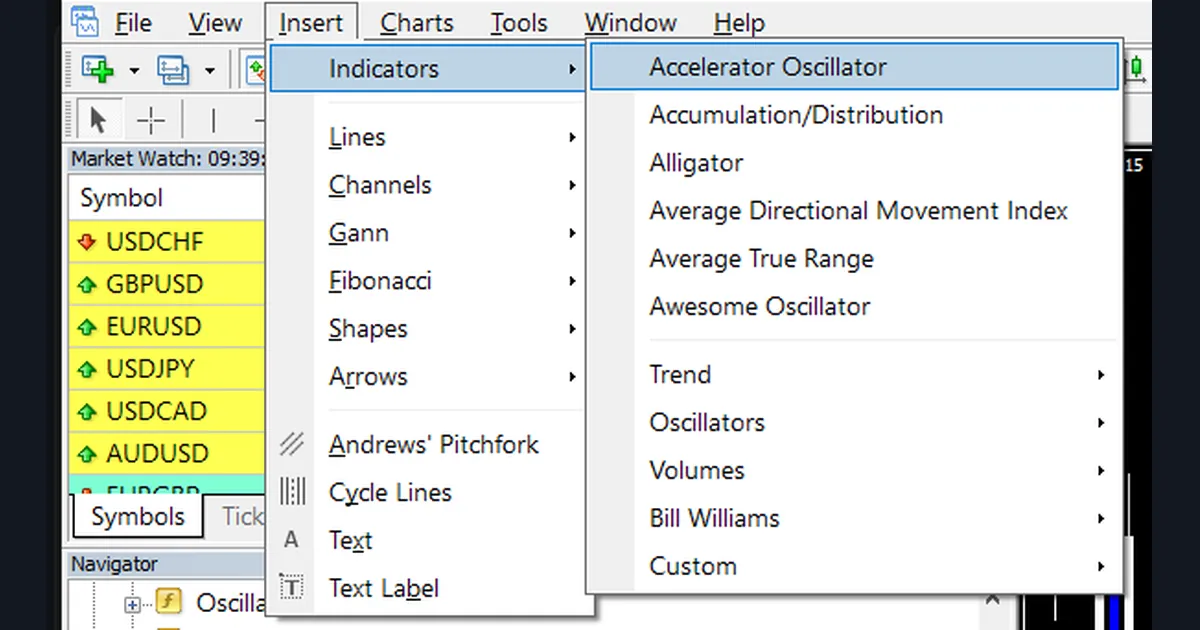
The Moving Average lives in the Trend group. Custom holds anything you installed yourself. So you have two routes to the same result: this menu, or a drag from the Navigator.
Download the complete indicator database
Put these concepts on your charts. One email unlocks the full library of 1,380+ indicators with compiled MT4 and MT5 files, plus my TradingView scripts. No paywall, no spam, unsubscribe any time.
Get free access to my indicator database
One email unlocks 1,380+ free MT4, MT5 and TradingView indicators — the complete library. No single-tool download; you get the whole database.
Where it fails: the limits of MT4
MT4 is dependable for charting, but it has clear weak spots.
- Disconnected looks normal. As our EURUSD quote showed, a stale terminal still draws charts and prices. Nothing flashes red on the chart itself. So you must check the connection indicator in the status bar, which we cropped for privacy.
- History is only as good as the download. Your bar files come from the broker. So two MT4 installs can show different daily candles for the same pair.
- Volume is tick volume. There is no central exchange volume in spot forex. The Volume figure counts price changes, so volume-based indicators measure activity, not size.
- Nine fixed timeframes. MT4 ships with M1 through MN only. An H2 or H12 chart needs a custom tool.
- Old program model. MQL4 files do not run on MT5, and the tester runs one symbol at a time.
- Mobile is limited. The phone apps cannot load custom indicators. Our note on custom indicators on MT4 mobile explains the workarounds and their limits.
None of this makes MT4 unusable. However, it does mean the platform needs a careful user, not a trusting one.
Setting up a moving average, step by step
Pick Insert, Indicators, Trend, Moving Average. The properties dialog opens on its Parameters tab.
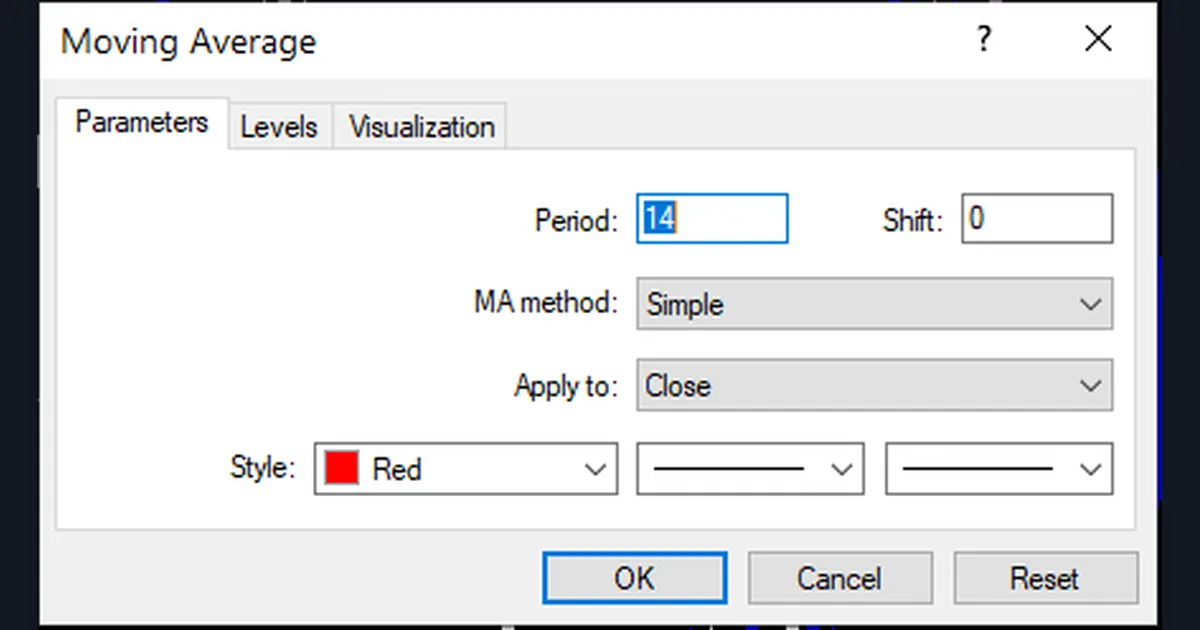
The defaults in our dialog were Period 14, Shift 0, MA method Simple, Apply to Close and Style Red. Period is the number of bars in the average. Shift moves the line sideways by whole bars. MA method picks the formula: Simple, Exponential, Smoothed or Linear Weighted. Apply to chooses the price input, such as Close or the median price. The Levels tab adds fixed lines, and Visualization picks the timeframes that show it.
A simple average is plain arithmetic: SMA = (C1 + C2 + ... + CN) / N, where C is each close and N is the period. An exponential average weights recent bars more: EMA = Close x k + previous EMA x (1 - k), with k = 2 / (N + 1). For a 50-period EMA, k is 2 divided by 51, or about 0.039. MetaQuotes documents each method on its Moving Average help page at metatrader4.com.
What a 50 EMA looks like on EURUSD H1
We then changed Period to 50 and MA method to Exponential, picked yellow, and clicked OK on a EURUSD H1 chart.
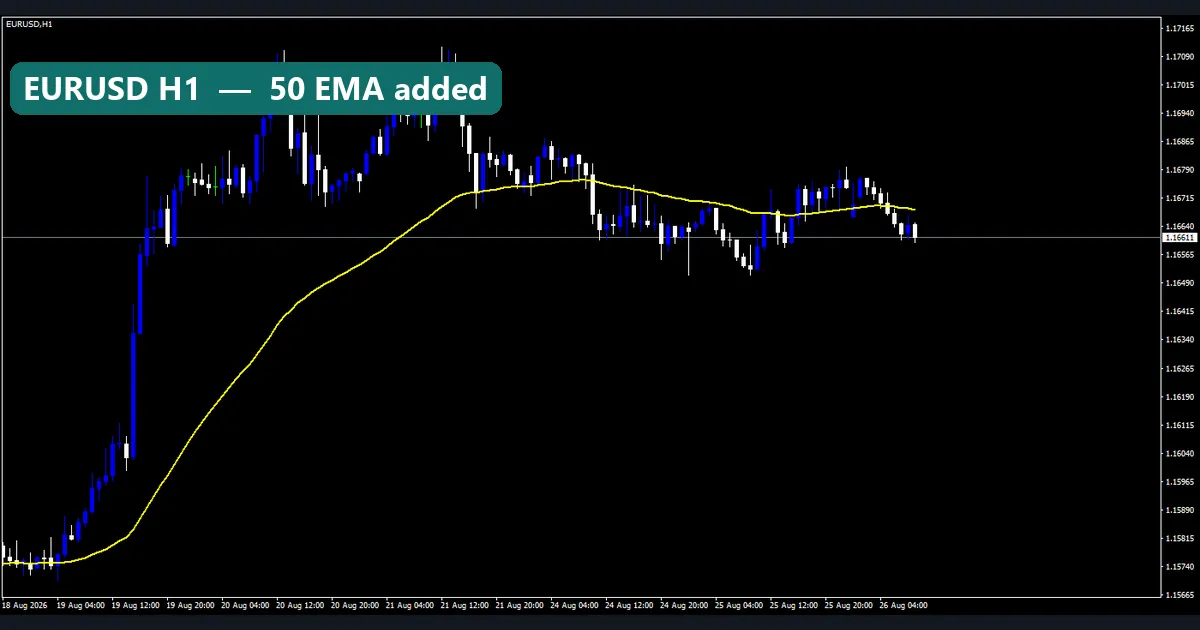
The yellow line lags the fast rise from about 1.1574 on 19 August to near 1.1709 on 20 and 21 August. After that, price chops sideways and the line flattens around 1.1670 to 1.1680. On the last bars, price sits at 1.16611, just under the line. That is how an average behaves: it trails trends and goes flat in ranges. For more on the choice of formula, read SMA vs EMA.
How the New Order window works
We did not place an order for this article, because the terminal had no server link. Still, the order ticket is simple to describe. Press F9, or click New Order on the toolbar, and the ticket opens for the active symbol.
First, you set the Volume in lots. Next, you can fill in Stop Loss and Take Profit prices. Then you pick a Type. Market Execution sends a buy or sell at the current price. Pending Order lets you set Buy Limit, Sell Limit, Buy Stop or Sell Stop at a price you choose. Our guide to the pending order in forex explains each one.
Open trades appear on the Terminal’s Trade tab. If the ticket refuses a trade with a margin message, see MetaTrader 4 not enough money. Also, practise on a demo account first. Our page on demo vs live trading covers what changes when real money is on the line.
Common mistakes new MT4 users make
- Trusting a frozen chart. A disconnected terminal still shows prices. So check the status bar and watch Market Watch tick before you act.
- Stacking indicators on one chart. Five overlays hide the candles. Instead, learn one tool before adding a second.
- Copying files to the wrong folder. Custom tools belong in the data folder, which File, Open Data Folder reveals. Program Files is the wrong place, and the Navigator will not list the file.
- Turning on AutoTrading without reading the Expert Advisor. The button lets every attached EA trade. First read our guide on how to install MT4 and MT5 Expert Advisors, then test on demo.
Where to go next
Once the panels feel familiar, pick one skill at a time. Scripts are a good next step, and our guide on how to install MT4 and MT5 scripts covers the file paths. For averages in more depth, read moving averages explained, or try our exponential moving average indicator. Also, multi-timeframe analysis shows how to use the timeframe buttons together.
For primary sources, start with the official MT4 user guide at metatrader4.com. Programmers can read the iMA function reference in the MQL4 documentation. The MetaTrader 4 article on Wikipedia covers its history. Finally, before you fund any account, read the CFTC forex fraud advisory at cftc.gov.
FAQ: how to use MetaTrader 4
Is MetaTrader 4 free to use?
The software costs nothing to download from a broker, and demo accounts are free. However, live trading carries spreads, commissions and swaps set by your broker.
How do I open the Navigator in MT4?
Press Ctrl+N, or open the View menu and click Navigator. Press Ctrl+N again to hide it.
Why does my MT4 chart not move?
Usually the terminal has lost its server link, or the market is closed. So check the connection status in the bottom-right corner and whether Market Watch prices change.
How do I add an indicator to a chart?
Use Insert, Indicators and pick a group, or drag the indicator from the Navigator onto the chart. Then set the inputs in the dialog and click OK.
How do I remove an indicator?
Right-click the chart, choose Indicators List, select the indicator and click Delete. Alternatively, right-click the line itself and pick Delete Indicator.
What do the M15, H1 and D1 buttons mean?
They set the timeframe: one candle per 15 minutes, per hour or per day. So the same pair can look calm on D1 and busy on M15.
Can I use MT4 indicators in MetaTrader 5?
No. MT4 loads .ex4 files and MT5 loads .ex5 files, so each platform needs its own build of the tool.
Will learning MT4 make me a profitable trader?
No. MT4 is only a tool for charts and orders, and your results depend on your method, costs and risk control. As always, results are not guaranteed; past performance is not indicative of future results.
Last updated: 28 September 2026.

About the author
Written by Dominic Walsh, a Forex trader and MT4/MT5 indicator, Expert Advisor and script developer. Every tool on forexmt4systems.com is tested on live charts before release and ships with ready-to-use compiled MT4 (.ex4) and MT5 (.ex5) files. Learn more about the trader and developer behind this site.
How we build, test and correct every tool: Editorial & Testing Policy. Trading carries risk; see the disclaimer.