
Below is a complete trading plan example, written out in full for one hypothetical trader. Nothing gets summarised, and no line waits as an exercise for the reader.
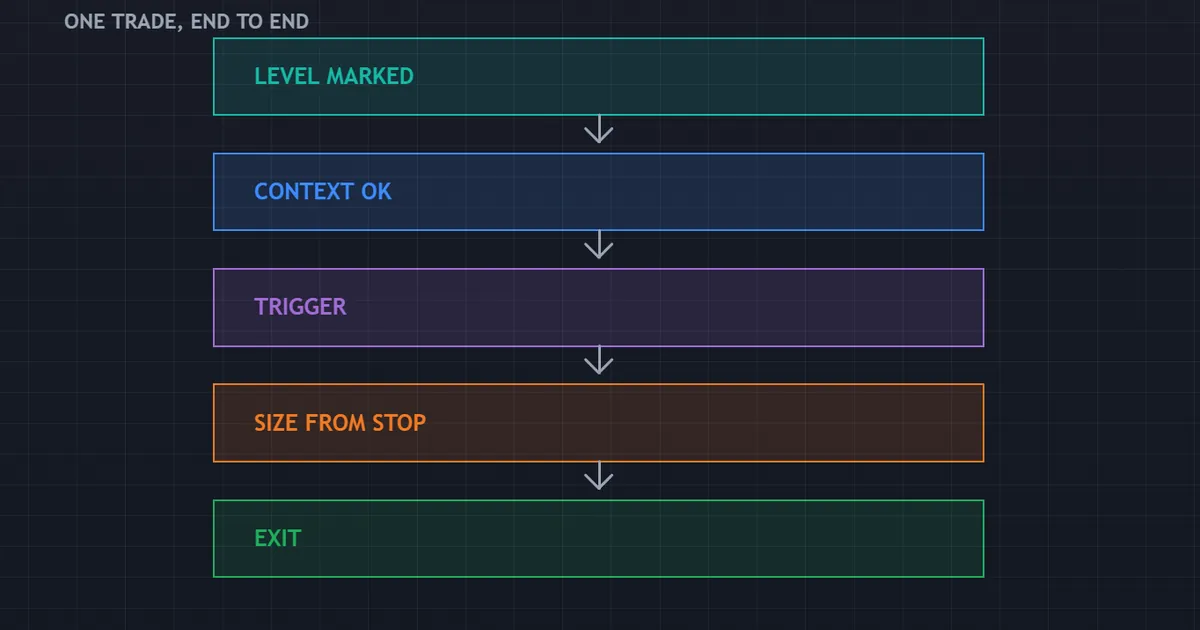
After the document itself, the same plan runs end to end on a single trade. You see the level marked, the context check, the trigger, the size, the management and the exit.
Trading Plan Example: The Trader Behind It
A plan only makes sense next to the life it fits. So meet Sam, whose constraints shaped every line that follows.
Sam works full time and lives in the United Kingdom. Two free hours arrive before work, four mornings a week, and evenings belong to family.
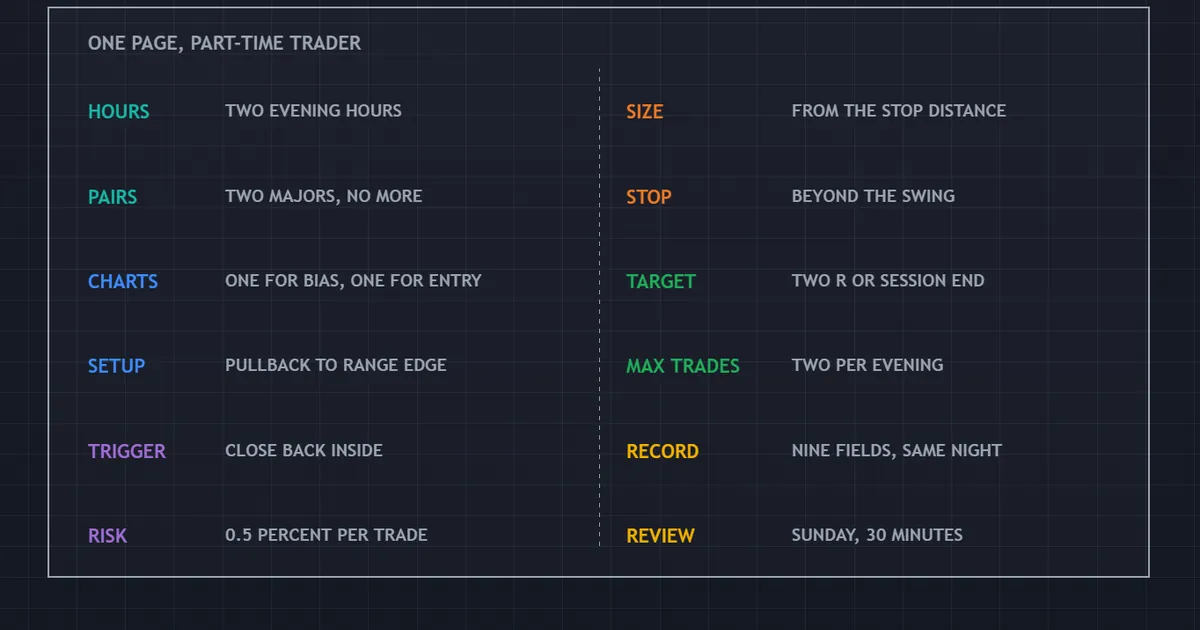
The panel above shows the finished document. A dozen short lines, one page, no paragraph anywhere.
The Constraints That Shaped It
Sam has a five thousand dollar account and no intention of adding to it soon. Losses therefore have to stay small enough that a rough fortnight changes nothing structural.
Screen time is the tighter constraint. Two hours in the morning rules out anything needing supervision through the afternoon.
Experience sits at about eight months. Enough to recognise a level, not enough to trust an improvised decision at speed.
One more detail shapes everything. Sam’s broker charges a spread rather than commission, so tight targets lose a meaningful slice before anything else happens.
What Sam Is Not Trying to Do
The plan carries no monthly percentage goal. Sam tried one for a quarter, and every quiet week ended with a trade taken to hit the number.
It also avoids anything needing constant attention. News scalping, correlation baskets and hedged grids all assume a screen Sam does not have.
Finally, it makes no attempt to catch every move. Two pairs and two hours a day will miss most of what happens, and missing things costs nothing.
The One Page Plan, Line by Line
Here is the document exactly as Sam keeps it. Every line answers one question and stops.
- Hours. Seven to nine in the morning, Monday to Thursday, United Kingdom time.
- Instruments. EURUSD and GBPUSD only.
- Context chart. Four hour.
- Execution chart. Fifteen minute.
- Levels. Marked on Sunday evening from the four hour chart, never added midweek.
- Setup. Price returns to a Sunday level while the four hour close sits on the same side of its fifty period average.
- Trigger. A fifteen minute close back through the level, in the direction of that four hour bias.
- Invalidation. Beyond the fifteen minute swing that formed at the level.
- Risk. Half a percent per trade. Stop for the day after two losses or one clean winner.
- Exits. Target at the previous four hour swing. Close everything at nine in the morning regardless.
- News. No new position within fifteen minutes of a scheduled high impact release.
- Review. Friday evening, twenty minutes, three columns.
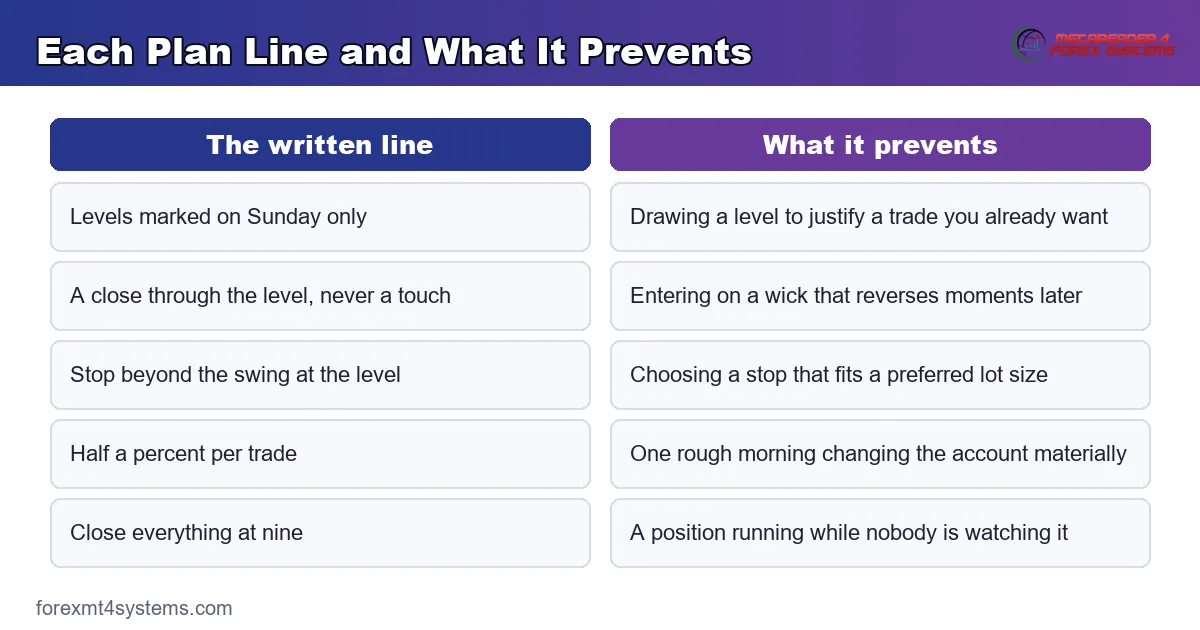
The time stop does a lot of quiet work. It removes any decision about holding into the afternoon, which Sam cannot supervise anyway.
Read the twelve lines as a filter rather than a recipe. Each one narrows the field, and by line eight almost nothing survives on an ordinary morning.
Note also what the document leaves out. No profit goal, no maximum number of trades per week, and no mention of any indicator beyond the single average.
Why Each Line Reads That Way
None of these choices is universal. Each one follows from something specific about Sam, and that is the part worth copying.
Two Pairs, Not Eight
Two hours a morning across two instruments produces perhaps four setups a week. Eight instruments would produce more, and Sam would see each one far less often.
Repetition matters more than opportunity at eight months in. Familiar behaviour on two pairs beats shallow acquaintance with eight.
Cost enters the choice as well. Both pairs carry tight spreads during the London morning, whereas thinner instruments would eat a larger slice of every target.
Levels Marked on Sunday
Sunday levels never move to suit a trade. That single restriction removes the most common form of self-deception in level trading.
Sam draws them from four hour swing points and prior session extremes. Our support and resistance indicators archive covers tools that mark similar zones automatically.
Four Hour for Context, Fifteen Minute for Entry
The two charts sit sixteen steps apart in bar length. That gap is wide enough for the higher chart to mean something, and narrow enough that a stop stays affordable.
A daily context chart would push stops far wider. At half a percent of a five thousand dollar account, those stops would shrink the position to almost nothing.
Sam also never drops below the fifteen minute chart. Dropping lower after a missed entry felt like precision, and the records showed it simply produced worse fills.
A Close, Never a Touch
The trigger asks for a fifteen minute close through the level. A wick does not count, however convincing it looks at the time.
Waiting for the close costs some entries. It also removes the entire category of trades where price poked a level and reversed immediately.
Half a Percent, and a Daily Stop
Half a percent of five thousand dollars is twenty five dollars of risk. Two losses in a morning cost fifty dollars, which is annoying rather than damaging.
The daily stop also fires after one clean winner. Sam added that line after noticing every giveback came from a second trade taken on confidence.
Our guide to the daily loss limit covers how traders choose that threshold.
Why There Is No Trailing Stop
Trailing rules look sensible on paper. In practice they turn one decision into a stream of them, and Sam has ninety minutes of attention to spend.
The records made the case. Across the first six months, trailed exits finished below the fixed target often enough to remove the appeal.
So the line stays absent until evidence changes. Sam will revisit it after another hundred trades, at review time, with a written reason attached.
A Hard Time Stop
Nine in the morning ends everything. No exceptions, no trailing, no checking the phone at lunchtime.
Sam gives up some large moves that way. In exchange, no trade ever runs unsupervised while Sam sits in a meeting.
The Review Line
Friday evening, twenty minutes, three columns. Rules followed, size in R, and one sentence about what felt hard that week.
Sam reads for repeats rather than results. A single early exit means nothing, while three in a fortnight names a rule that needs rewriting.
The slot stays fixed even after a blank week. Skipping reviews when nothing happened removes exactly the weeks that would show why nothing happened.
The Same Plan Applied to One Trade
Rules on a page mean little until you watch them run. So here comes one complete trade, from Sunday evening through to Tuesday morning.
Sunday: Marking the Levels
Sam opens the four hour charts and marks three levels on each pair. Each one sits at a swing point where price previously turned.
Sam then closes the file. No further levels get added before the following Sunday, whatever happens midweek.
Six levels across two pairs sounds thin, and thin is deliberate. A chart carrying twenty lines will always have price near one of them, which makes the setup meaningless.
Monday: Nothing Happens
Monday morning arrives and neither pair goes near a marked level. Sam watches for two hours, places nothing, and closes the laptop.
That session counts as a success in the record. The plan asked for a specific sequence, the sequence never appeared, and no trade followed.
Most mornings look like this one. Any honest example has to include them, because a plan producing four trades a week also produces sixteen quiet hours.
Tuesday, Seven in the Morning: The Context Check
EURUSD sits about thirty pips above the highest Sunday level. The most recent four hour close sits above its fifty period average, so the bias points upward.
GBPUSD sits nowhere near a marked level. Sam closes that chart and stops looking at it.
Seven Forty: The Trigger
Price drifts down into the level over the next half hour. One fifteen minute candle dips below it, then closes back above.
That close is the trigger. The bias agreed, the level came from Sunday’s list, and the close arrived inside the trading window.
Sizing From the Stop
The fifteen minute swing low sits eighteen pips below the entry. Sam adds two pips of buffer, so the stop distance comes to twenty pips.
Twenty five dollars of risk across twenty pips gives the lot size. Our position size calculator returns that figure in a couple of seconds.
Notice the order. The chart set the stop, and the stop set the size, so confidence never entered the arithmetic.
Spread comes off that figure too. Sam subtracts the typical spread from the target distance before accepting the trade, which occasionally rules one out.
Management: Doing Nothing
The plan contains no trailing rule and no partial exit. Sam therefore watches, and touches nothing.
Price stalls twice on the way up. Both stalls feel uncomfortable, and no line in the document covers either of them.
Discomfort is not a signal, though. Sam noted both moments in the journal and left the position exactly where the plan put it.
The Exit
The previous four hour swing sits forty two pips above entry. Price reaches it at eight fifty in the morning, ten minutes before the time stop.
The target fills and the trade closes at roughly two R. Sam logs it in the trade journal with a note reading “all lines held”.
What Sam Deliberately Did Not Do
No second position joined the first. The daily stop had already fired on the clean winner, so the morning ended there.
No stop got moved to breakeven either. The document says nothing about breakeven stops, and adding one mid-trade would have made the record incomparable.
Nor did Sam extend the target when momentum looked strong. Every one of those omissions is a decision the plan made in advance, on a calm Sunday, for exactly this moment.
Download the complete indicator database
Put these concepts on your charts. One email unlocks the full library of 1,380+ indicators with compiled MT4 and MT5 files, plus my TradingView scripts. No paywall, no spam, unsubscribe any time.
Get free access to my indicator database
One email unlocks 1,380+ free MT4, MT5 and TradingView indicators — the complete library. No single-tool download; you get the whole database.
Adapting This Example Without Breaking It
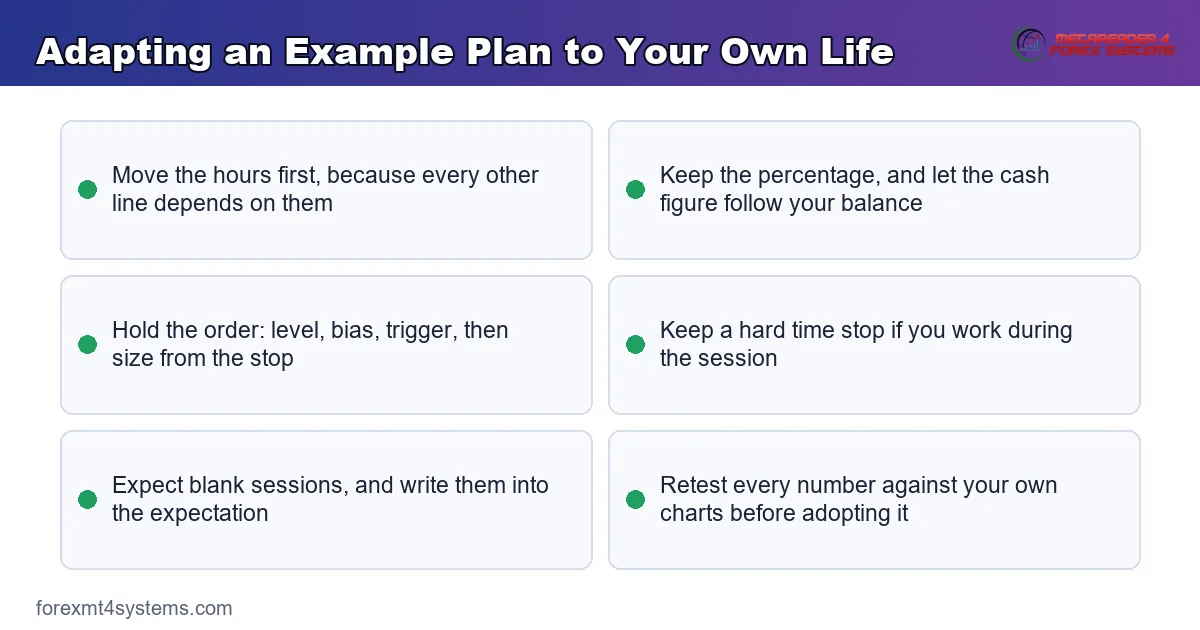
Copying Sam’s document wholesale would be a mistake for almost everybody. The panel below lists what to change and what to keep.
Change the Hours First
Every other line depends on when you sit down. Move the hours to the evening and the instruments, levels and time stop all shift with them.
Somebody trading after work in the Americas faces a different market entirely. The pairs that move at that hour differ, and so do the levels worth marking.
Change the Account Size, Keep the Percentage
Half a percent scales to any balance, whereas twenty five dollars does not. Keep the percentage, and let the dollar figure follow from it.
Keep the Order of Operations
Level first, bias second, trigger third, size last. That sequence is the transferable part, and it works regardless of which method fills the slots.
Reversing any two steps causes trouble. Choosing a size before the stop, or a trigger before a level, quietly turns the document back into improvisation.
Keep the Time Stop If You Work
Anybody with a job needs a hard close. An open position during a meeting is a decision you have delegated to chance.
Keep the Blank Sessions
Sam’s Monday produced nothing, and the plan still worked as intended. Any adaptation that cannot tolerate quiet mornings will drift toward taking trades to stay busy.
Write the blank days into the expectation. A rule appearing four times a week means most sessions end with the laptop closed.
Do Not Keep the Numbers
Fifty period averages and twenty pip stops suited Sam’s pairs and hours. Yours will differ, so test the numbers against your own charts before adopting them.
Quick Reference: The Plan on One Screen
This table restates the same document in a form you can copy into a file. Replace the right column with your own answers.
| Line | Sam’s answer |
|---|---|
| Hours | Seven to nine, Monday to Thursday |
| Instruments | EURUSD and GBPUSD |
| Context chart | Four hour |
| Execution chart | Fifteen minute |
| Levels | Marked Sunday, never added midweek |
| Setup | Return to a Sunday level, four hour bias agreeing |
| Trigger | Fifteen minute close back through the level |
| Invalidation | Beyond the fifteen minute swing at the level |
| Risk | Half a percent per trade; stop after two losses |
| Exits | Previous four hour swing, or nine in the morning |
| News | No entry within fifteen minutes of a scheduled release |
| Review | Friday evening, twenty minutes |
When the Same Plan Produces a Loss
The trade above worked, which makes it a poor teacher on its own. Two mornings later the identical sequence ended differently.
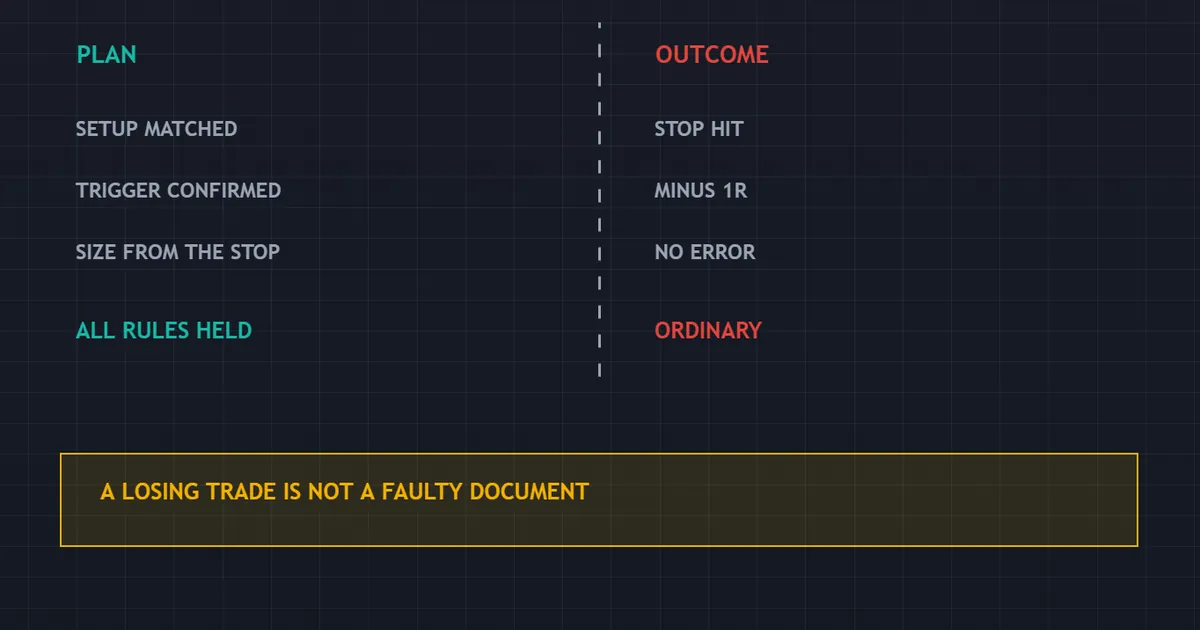
Every Line Held, and It Still Lost
The panel above sets the followed plan beside its outcome. Level marked on Sunday, bias agreeing, close through the level, stop twenty pips away.
Price moved up eleven pips, turned, and took the stop. One R gone, with no rule broken anywhere in the sequence.
That result contains no error. A plan describes what you do, and it says nothing about what price does next.
Traders new to written rules often edit after a morning like this one. Doing so replaces evidence with reflex, and the next version usually needs the same rule back.
What the Journal Records
Sam logs the loss with the same note as the winner. All lines held, minus one R, no action needed.
The neutral wording is intentional. A note calling the trade unlucky or stupid colours the record, and coloured records get read selectively later.
Reading those notes together is the point. Our guide on how to review your trades covers what to look for once a few dozen accumulate.
Why Single Trades Prove Nothing
Two examples tell you nothing about the method. Forty tell you something, and a hundred tell you more.
The plan exists to make those hundred trades comparable. Without it, you have a hundred slightly different experiments and no conclusion.
So resist judging the document after a fortnight. Early stretches swing wildly on sample size alone, and the honest answer at trade twelve is that you cannot tell yet.
Reading the Outcomes in R
Both trades above use R rather than money. That habit makes the record readable at any account size.
One R Is Your Risk
The winner returned about two R, and the loser cost one R. Twenty five dollars per R turns those into fifty dollars and minus twenty five.
Our note on the R multiple in trading explains the arithmetic in full.
Why the Ratio Alone Misleads
A two-to-one target sounds attractive, and it only pays if enough trades reach it. Our guide to the risk reward ratio covers how the two numbers interact.
Sam tracks both columns. Average R and the proportion of trades reaching target sit side by side in the review.
Logging in R Keeps Weeks Comparable
Account balances change, and R does not. A week logged as plus three R reads the same whether the account holds five thousand dollars or fifty thousand.
That consistency matters at review time. Sam can compare March with August directly, because both months use the same unit.
It also removes an emotional edge from the numbers. Minus one R lands more calmly than a dollar figure, and the calmer reading tends to be the more accurate one.
Related Guides Worth Reading Next
Two neighbouring articles complete the picture. Read whichever matches where you are.
If you have no document yet, work through how to create a trading plan, which walks the same nine decisions Sam made. If you want the concept first, what a trading plan is covers the components and their limits.
Then write your own version this week. A rough one-page answer sheet beats an admired example every single time.
Give the first draft a month before judging it. Sam’s document went through four revisions in its first quarter, and only the hours survived untouched.
FAQ
Can I use this trading plan example as it is?
Only if your hours, account and instruments match Sam’s, which is unlikely. The transferable parts are the structure and the order of operations: level first, bias second, trigger third, size last. Replace every number and every time with your own, then test the wording against a month of past charts.
Why is the plan only one page?
Because a longer document does not get read at seven in the morning. A dozen short lines take under a minute to scan, which keeps the rules present during the session rather than filed away. Any supporting reasoning belongs in a second file that you open at review time.
Why does the plan stop after one winner?
That line came from Sam’s own records, not from a general principle. Reviewing several months showed most givebacks arriving on a second trade taken straight after a good one. Your records may show something different, which is exactly why the review slot exists.
Should the plan include news events?
A line about scheduled releases helps most traders. Sam simply avoids opening a position within fifteen minutes of a major release, since spreads widen and fills drift. That single rule removes a category of trades that behave nothing like the rest of the sample.
How many trades does this plan produce?
Roughly three or four a week across two pairs, though quiet stretches produce none at all. Frequency depends far more on how many levels get marked than on anything else in the document. Traders who feel starved usually widen the instrument list rather than loosening the trigger, which keeps the rule intact.
What does Sam do about the pairs moving together?
The plan allows one open position at a time, which handles it. EURUSD and GBPUSD often move in the same direction, so two simultaneous longs would double the real risk while looking like two separate ideas. One position at a time keeps the stated half a percent honest.
Does following an example plan improve results?
Following any plan closely makes your results readable, which is a different benefit. The two trades above show why: one reached target, one hit the stop, and Sam ran both correctly. Consistency lets you judge the method over dozens of trades rather than guessing from a handful, and it removes the variation you would otherwise add yourself. Results are not guaranteed; past performance is not indicative of future results.
External references
- For background on this concept, see Checklist on Wikipedia.
- For broader market context, see Mechanical Investing at Investopedia.

About the author
Written by Dominic Walsh, a Forex trader and MT4/MT5 indicator, Expert Advisor and script developer. Every tool on forexmt4systems.com is tested on live charts before release and ships with ready-to-use compiled MT4 (.ex4) and MT5 (.ex5) files. Learn more about the trader and developer behind this site.
How we build, test and correct every tool: Editorial & Testing Policy. Trading carries risk; see the disclaimer.