
The best volume indicator day trading choice depends on the question you ask the chart, because each tool answers a different one. In spot forex there is no central tape, so every volume tool on MT4 or TradingView is built on tick volume. This guide settles what tick volume can and cannot tell a day trader. We measured it on 20,000 fifteen-minute bars per symbol, then read three tools on live charts: plain Volume, On-Balance Volume and VWAP.
What a volume indicator measures in spot forex
On a stock or futures chart, volume counts shares or contracts that changed hands on one exchange. Spot forex has no single exchange. Banks, brokers and platforms quote prices to each other, and nobody publishes one total. The BIS Triennial FX Survey estimates turnover, but only once every three years and only in aggregate.
So what does the volume pane on your chart show? It shows tick volume. That is the number of price updates your data feed sent during the bar. The pane in our TradingView shots says so in its title: “Vol · Ticks”. MT4 does the same, and the iVolume reference in the MQL4 docs returns this tick count for each bar.
Tick volume is not traded lots. Still, when more traders act, quotes change more often, so tick counts rise. That makes it a proxy for activity. For the wider picture of how FX activity varies by hour and day, read our guide to daily trading volume in forex.
How Volume, OBV and VWAP calculate
All three tools start from the same tick count. However, each one does something different with it.
- Volume plots the raw count per bar. TradingView colours the bar green when the candle closed up and red when it closed down. Nothing else is computed.
- On-Balance Volume (OBV) keeps a running total. If the close is above the prior close, it adds the bar’s volume. If the close is lower, it subtracts it. In short:
OBV = OBV[1] + volume if close > close[1]; OBV[1] - volume if close < close[1]. The On-balance volume article on Wikipedia covers its origin with Joe Granville. - VWAP is an average price weighted by volume, reset at each session start. The formula is
VWAP = sum(typical price x volume) / sum(volume), with typical price = (high + low + close) / 3. The VWAP page in TradingView’s help center lists its anchor and band options.
So OBV and VWAP inherit every quirk of tick volume. A feed that sends more quotes produces a different OBV level, so only its slope and its agreement with price carry information. Our OBV indicator explainer goes further into the divergence readings.
How we tested tick volume
We wanted one plain answer first: does tick volume track anything real? So we used MetaTrader 4, build 1471, on Capital Point Trading’s history. Then we took the last 20,000 M15 bars for EURUSD, GBPUSD and XAUUSD, and 9,638 bars for USDJPY, which was all the history held. The M15 data runs from June 2025 to August 2026.
First, we ranked every bar by tick volume and by range (high minus low). Next, we measured the Spearman rank correlation between the two. After that, we flagged a “spike” when a bar’s tick volume was at least twice the average of the 20 bars before it. For each spike, we measured two things over the next four bars, which is one hour on M15:
- the high-low range of those four bars, in ATR units;
- whether the close four bars later sat beyond the spike bar’s close, in the spike bar’s direction.
We ran the same two checks on every bar to get a base rate. Every figure is before spread, swap and commission, since the MT4 history has no usable spread. The chart shots come from the TradingView web chart on OANDA data, taken on 7 October 2026. Our general method is set out in the editorial testing policy.
Settings we used on each tool
None of these tools needs much tuning. Here is what our charts and test used.
| Tool | Input | Value we used | What it changes |
|---|---|---|---|
| Volume (TradingView) | Data type | Ticks (the only option on OANDA FX) | Nothing to change: the feed decides |
| On-Balance Volume | Source | Close vs prior close | Sign of each bar’s addition |
| VWAP | Anchor period | Session | Where the average resets |
| VWAP | Source | hlc3 (typical price) | Which price gets weighted |
| Our spike rule | Lookback | 20 bars | Baseline for “normal” activity |
| Our spike rule | Multiple | 2x the 20-bar average | How rare a spike is |
| Our follow-up window | Bars | 4 bars of M15 (one hour) | How far ahead we judged the result |
The 2x multiple flagged 1,526 of 20,000 EURUSD bars, roughly one bar in thirteen. A higher multiple gives fewer, larger events, while a lower one floods the chart.
Reading On-Balance Volume on a GBPUSD chart
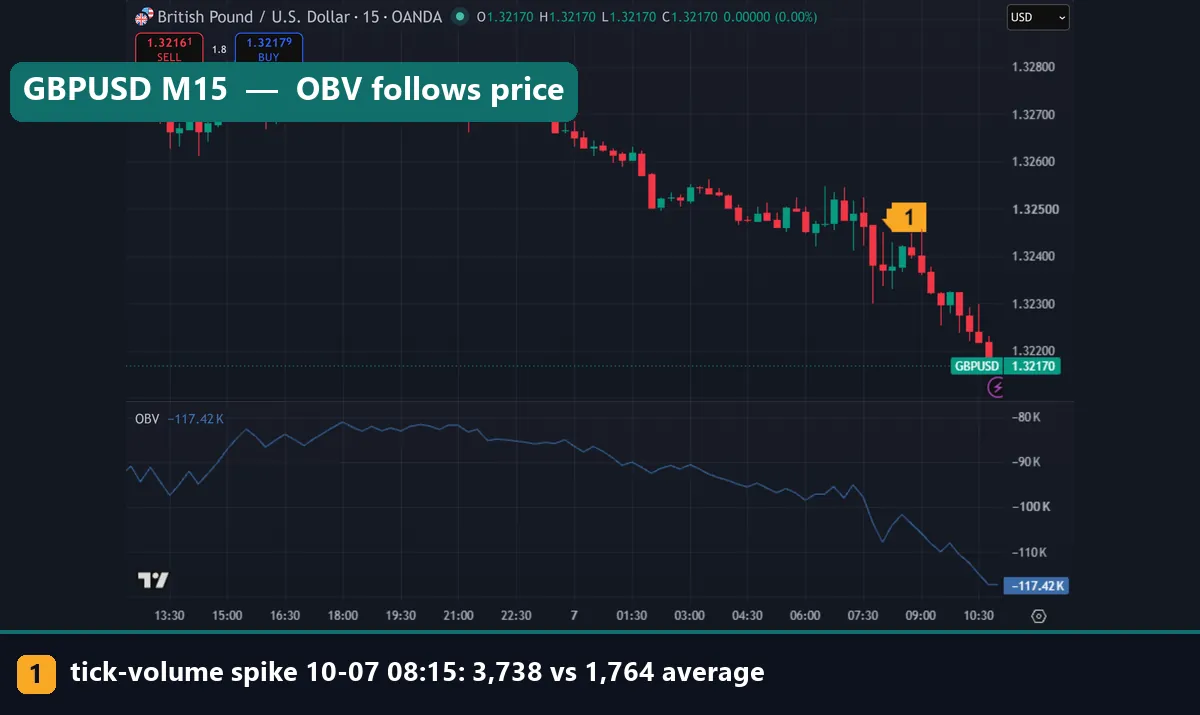
This is GBPUSD on M15 with OBV in the lower pane. Marker 1 sits on the 08:15 UTC bar of 7 October 2026. That bar printed 3,738 ticks against a 20-bar average of 1,764. It opened at 1.32372 and closed at 1.32378, so it was almost flat despite the busy tape.
Now look at the OBV line. It drifted down from roughly the 18:00 bar of 6 October and fell faster after 07:30 UTC. By the last bar, it read -117.42K. Price did the same thing: it slid from the 1.328 area to 1.32170.
So what did OBV add? Here, not much. It agreed with price, which you could already see. OBV earns a place only when it disagrees with price, and even then, on tick volume, a divergence is a question, not an answer. Our London session guide covers the session open that this busy stretch fell into.
Reading VWAP and Volume on gold
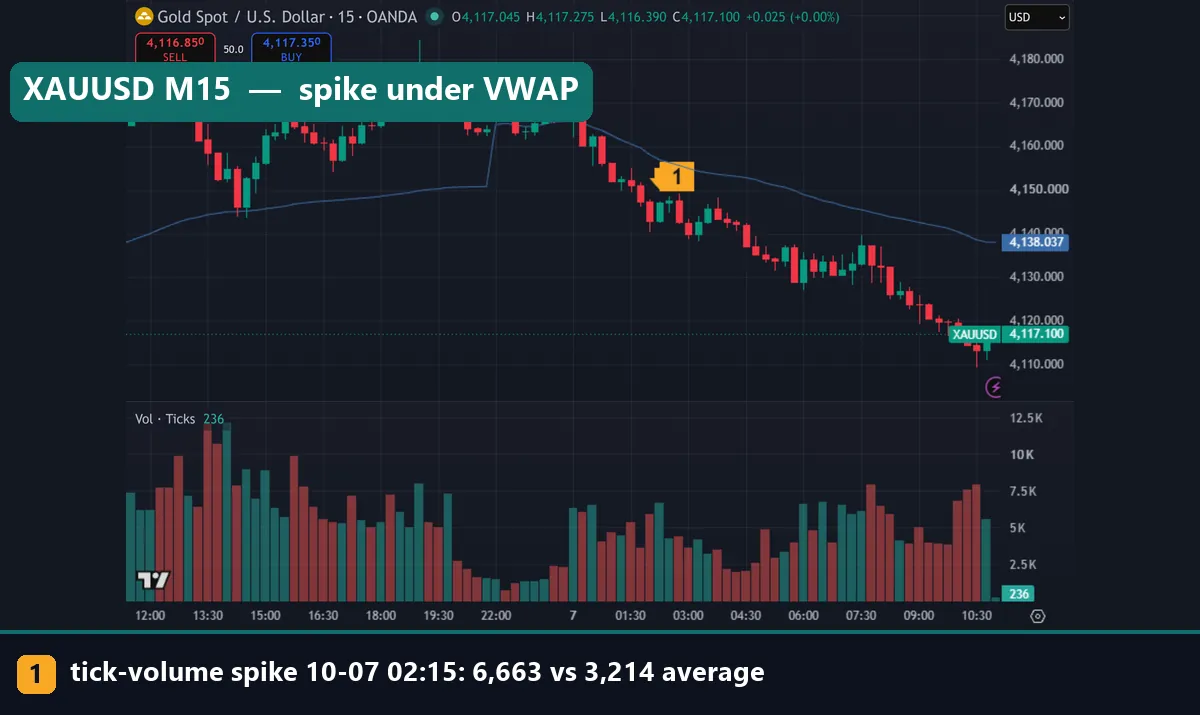
This is XAUUSD on M15 with session VWAP on price and Volume underneath. Marker 1 is the 02:15 UTC bar of 7 October 2026. It printed 6,663 ticks against an average of 3,214. The bar was green: it opened at $4,142.98 and closed at $4,147.10, a range of about $5.
But look where it happened. The bar sat well under the VWAP line. In other words, the busy up-bar was a bounce inside a session that was trading below its volume-weighted average. Price later fell to $4,117.10 by the right edge, while VWAP read $4,138.04.
Also note the step in the VWAP line just before the 22:00 label. That is the session reset. VWAP starts again from the first bar of the new session, so early readings swing hard and mean little. For the difference between this and a VWAP you pin to your own start bar, see anchored VWAP vs VWAP. And if you want the arithmetic by hand, our VWAP calculator runs it bar by bar.
Worked example: EURUSD on the morning of 7 October 2026
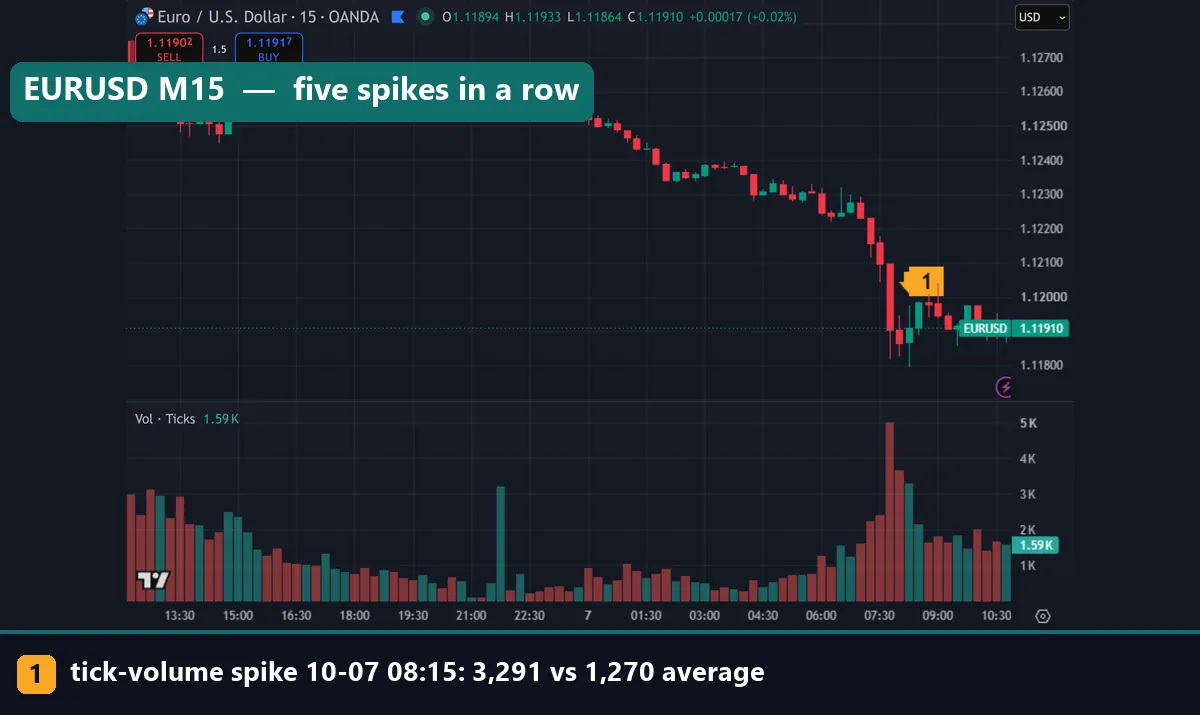
Go back to the first image. It shows EURUSD on M15 with the Volume pane. Our spike rule fired on five bars in a row, from 07:15 to 08:15 UTC. Here is what each one did, straight from the bar data:
| Bar (UTC) | Open | Close | Ticks | 20-bar average | Direction |
|---|---|---|---|---|---|
| 07:15 | 1.12230 | 1.12156 | 2,222 | 717 | Down |
| 07:30 | 1.12158 | 1.12098 | 2,401 | 801 | Down |
| 07:45 | 1.12098 | 1.11902 | 5,014 | 886 | Down |
| 08:00 | 1.11903 | 1.11866 | 3,650 | 1,112 | Down |
| 08:15 | 1.11868 | 1.11909 | 3,291 | 1,270 | Up |
The 07:45 bar was the big one. It carried 5,014 ticks, about 5.7 times its average, and ran from 1.12098 down to 1.11816. That is a 28.2-pip range on a pair that had drifted quietly overnight. Across the five bars, price fell from 1.12230 to 1.11909, about 32 pips.
Then came marker 1, the 08:15 bar. It was still a spike by our rule, but it closed up. So the volume stayed high while the direction flipped. After that, price chopped sideways near 1.119 for the rest of the visible window.
So the volume told you the market was awake and moving far. It did not tell you which way the next hour would go.
What 20,000 bars said about volume and range
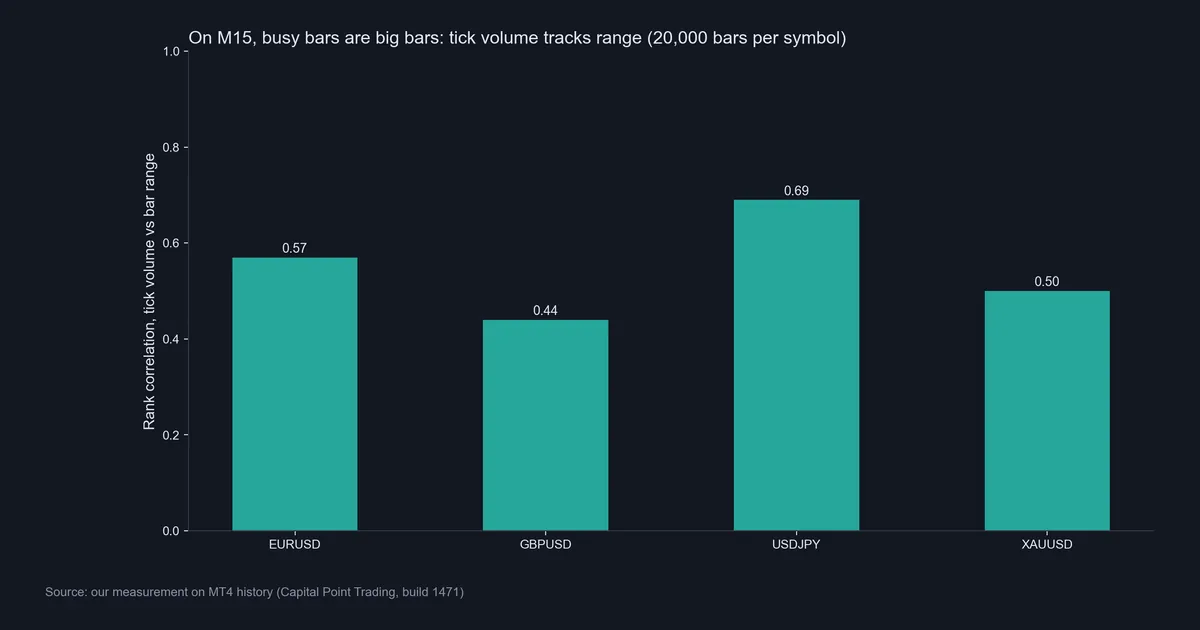
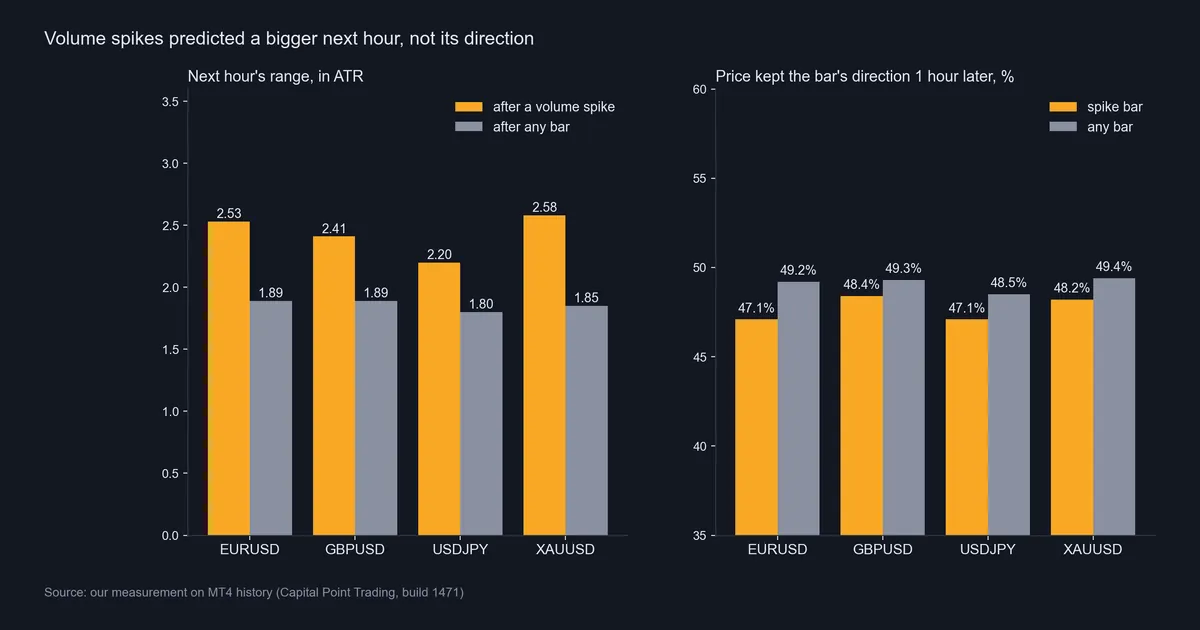
This chart is our measurement, drawn from the MT4 history. It plots the rank correlation between a bar’s tick volume and its range. EURUSD scored 0.57, GBPUSD 0.44, USDJPY 0.69 and XAUUSD 0.50.
Those are solid, positive links. A busy bar is usually a big bar, so tick volume is not random noise in forex.
The spike test pushed the point further. After a volume spike, the next hour’s range averaged 2.53 ATR on EURUSD, against 1.89 after any bar. GBPUSD showed 2.41 against 1.89. USDJPY showed 2.20 against 1.80, and gold 2.58 against 1.85. So a spike told you the next hour was likely to be wider than usual on all four symbols.
That is useful for day trading in a narrow way. For example, it can tell you to widen a stop, cut size, or stand aside. Our guide on using ATR for day trading shows how to turn a range estimate into a stop distance.
USDJPY: a spike that reversed within the hour
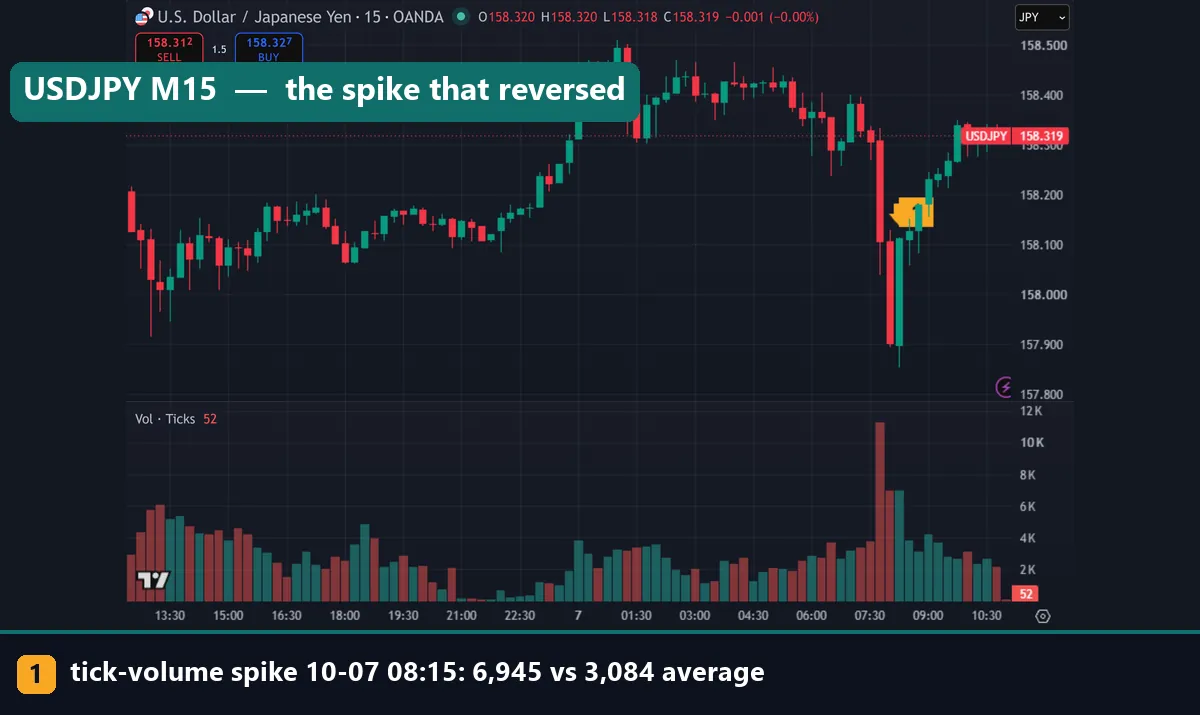
Here is USDJPY on M15 for the same morning. The 07:45 UTC bar printed 11,307 ticks against an average of 2,351, nearly five times normal. It fell from 158.334 to a low of 158.039. The 08:00 bar followed with 6,937 ticks and closed at 157.902.
Marker 1 is the 08:15 bar. It printed 6,945 ticks against an average of 3,084, and it went the other way. It opened at 157.899 and closed at 158.114, a green bar that took back most of the 08:00 drop. By the right edge, price was back at 158.319.
Two heavy down-bars, then a heavy up-bar, inside forty-five minutes. If you had read the 07:45 spike as “sellers in control”, the next hour would have hurt. Volume measured the size of the fight, not the winner.
Download the complete indicator database
Put these concepts on your charts. One email unlocks the full library of 1,380+ indicators with compiled MT4 and MT5 files, plus my TradingView scripts. No paywall, no spam, unsubscribe any time.
Get free access to my indicator database
One email unlocks 1,380+ free MT4, MT5 and TradingView indicators — the complete library. No single-tool download; you get the whole database.
Where it fails: direction, feeds and news
Tick volume has three hard limits. First, it does not predict direction. In our test, the close one hour after a spike sat further along in the spike bar’s direction only 47.1% of the time on EURUSD. Any bar did slightly better at 49.2%. GBPUSD showed 48.4% against 49.3%, USDJPY 47.1% against 48.5%, and gold 48.2% against 49.4%. Spikes were a touch worse than a coin flip at calling the next hour.
Second, tick counts depend on the feed. OANDA on TradingView and Capital Point on MT4 will not print the same numbers for the same bar. That is why we never compare tick counts across brokers, only within one feed.
Third, big spikes cluster around news and session opens. A spike at a data release adds little you did not already know from the calendar. See our page on the forex news spike for how those bars behave.
In addition, the test has its own limits. It covers four symbols on one timeframe, from one broker’s history, with one spike rule. We did not test M1 or M5, and we did not test any out-of-sample period. All results are before spread, swap and commission.
Best volume indicator day trading pick: choose by question
There is no single winner, and our data gives no reason to crown one. Instead, pick by question.
- “Is the market awake right now?” Use plain Volume, ideally with a relative rule like ours (2x the 20-bar average). It answers the one question tick volume handles well.
- “Is this move backed by activity, or drifting?” Use OBV, and only read it when it disagrees with price.
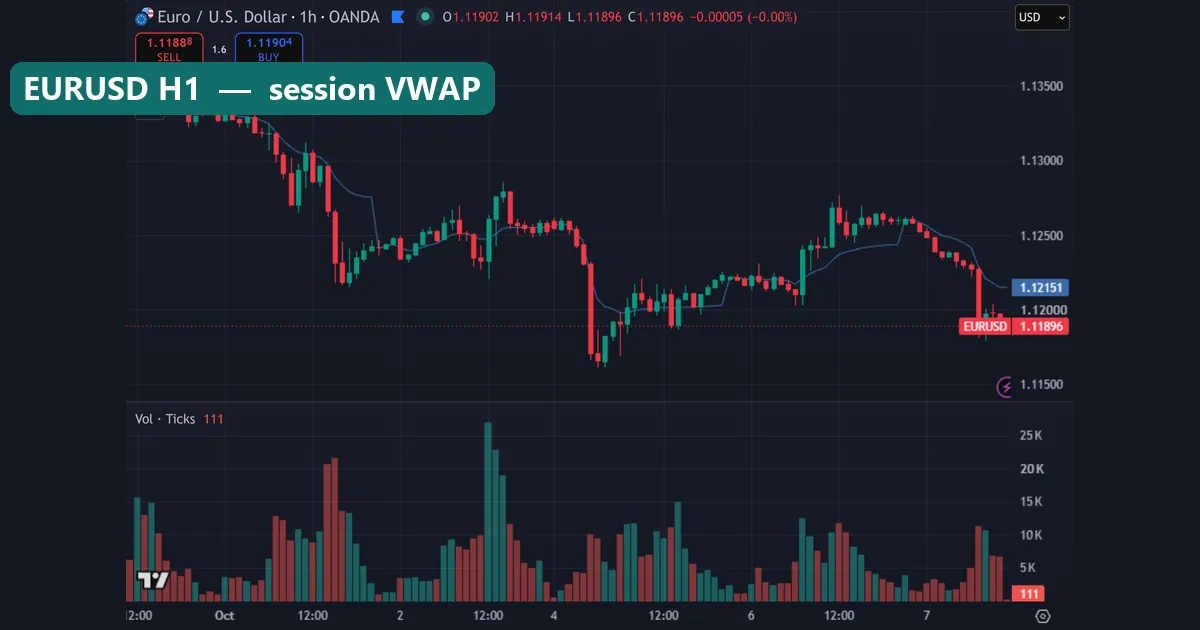
- “Where is the session’s average price?” Use VWAP. It gives a reference level, not a signal.
The second image above shows the last case on EURUSD H1. Session VWAP steps at each daily reset. On 7 October, price spent the session below the line, and at the right edge VWAP read 1.12151 against a price of 1.11896. Meanwhile the Volume pane shows bursts that did not line up with any single direction.
The first image above puts our range and direction results side by side. Range rose after spikes on all four symbols. Direction did not. For a wider shortlist that mixes volume with trend and momentum tools, see our best day trading technical indicators guide.
Common mistakes with volume tools in forex
- Reading tick volume as lots. A 5,000-tick bar is not 5,000 lots. It is 5,000 quote updates on one feed.
- Treating a spike as a direction signal. Our data showed spikes lagged the base rate on direction on every symbol tested. A spike says “big move”, not “this way”.
- Comparing OBV levels across brokers. Since OBV sums tick volume, its level depends on the feed. Only its slope and divergences travel between platforms.
- Trusting VWAP early in the session. After the reset, VWAP rests on a handful of bars. Give it time before you treat it as a level.
Also avoid stacking all three tools at once and calling agreement “confirmation”. They share one input, so they agree for the same reason. For related reading on volume-based chart methods, try our volume spread analysis guide.
Where to go next
If you want ready-made tools for MetaTrader, our list of the best volume indicators for MT4 covers free builds. The Money Flow Index indicator adds price weighting to volume in an oscillator.
For background, read open interest vs volume, which explains why futures data differs from spot ticks. Then see day trading in forex for the wider routine.
FAQ
Is there real volume in forex?
Not on a retail chart. Spot FX has no central exchange, so MT4 and TradingView show tick volume, the count of price updates per bar from your data feed.
Does tick volume mean anything?
Yes, for activity. In our test, tick volume and bar range had rank correlations from 0.44 on GBPUSD to 0.69 on USDJPY across thousands of M15 bars.
Does a volume spike show which way price will go?
Not in our data. One hour after a spike, price kept the spike bar’s direction 47.1% to 48.4% of the time, slightly below the rate for any bar.
What does a volume spike tell me, then?
It flags a wider next hour. On EURUSD, the next hour’s range averaged 2.53 ATR after a spike against 1.89 after any bar, before costs.
Is OBV useful for forex day trading?
Mainly when it disagrees with price. Most of the time, as on our GBPUSD chart, OBV simply follows the trend you can already see.
Which VWAP anchor should a day trader use?
The session anchor fits day trading, because it resets each day. Just treat the first part of each session with caution, since few bars feed the average.
Why do my volume numbers differ from another platform?
Each broker or data vendor sends its own stream of quotes. Different feeds produce different tick counts, so compare volume only within one feed.
Can volume indicators alone make a day trading system?
Our tests do not support that. Volume helped size expectations for range, not direction; results are not guaranteed; past performance is not indicative of future results.
Last updated: 7 October 2026.

About the author
Written by Dominic Walsh, a Forex trader and MT4/MT5 indicator, Expert Advisor and script developer. Every tool on forexmt4systems.com is tested on live charts before release and ships with ready-to-use compiled MT4 (.ex4) and MT5 (.ex5) files. Learn more about the trader and developer behind this site.
How we build, test and correct every tool: Editorial & Testing Policy. Trading carries risk; see the disclaimer.