
Is Semafor left or right when it repaints? The answer is right. A Semafor dot can move, vanish or reappear only on the newest bars at the right edge of the chart. Once enough bars close after a swing, the dot stops changing, so settled history on the left stays put. This guide shows the rule behind that, our counts from MT4 history, and what it means for how you read the dots.
Is Semafor left or right? The short answer
Semafor repaints on the right, where new candles print. A dot on the newest swing is only a draft. If price goes on to make a higher high or a lower low, the indicator removes the draft and draws a new dot further right. So the right edge is where you see changes happen.
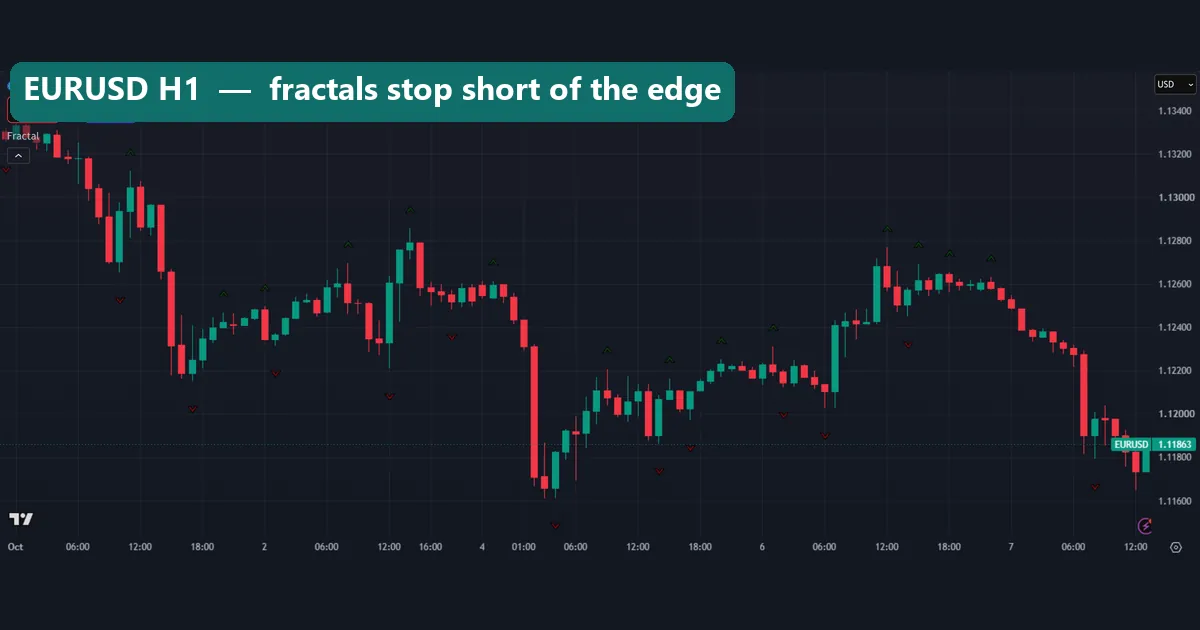
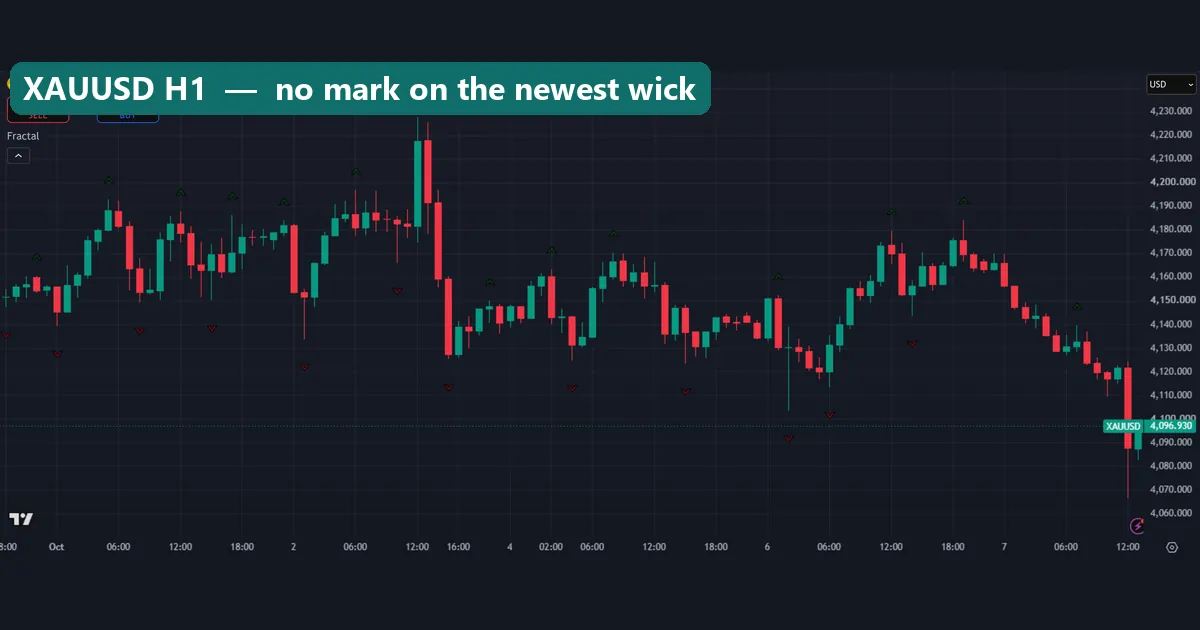
The left side is different. A swing high that is older than the indicator’s lookback can no longer lose its place, because no new bar can reach back and beat it inside that window. In short, old dots are final and new dots are provisional. Also, the same holds for the Williams Fractal on TradingView in the chart above. It needs two closed bars after a swing before it marks it, so the last two candles never carry a mark.
What a Semafor indicator actually is
Semafor is a swing-point marker for MetaTrader. The common version, 3 Level ZZ Semafor, places coloured dots above swing highs and below swing lows. It runs three ZigZag calculations at once, each with a different depth, so bigger dots mark bigger swings.
Traders read a level-3 dot as a major turn and a level-1 dot as a minor one. You can read the logic behind our own builds on the 3 Level ZZ Semafor indicator page, and a four-level variant with alerts sits on the 4 Level ZZ Semafor alert page.
Semafor is close kin to the fractal. Bill Williams defined a fractal as a bar with two lower highs on each side, which is a 5-bar pattern. Our Williams fractals lesson covers that pattern, and the fractal entry in the BabyPips Forexpedia gives a short outside definition. A level-1 Semafor dot does a similar job over a similar span. The difference is that Semafor stacks bigger windows on top.
How the dots are calculated
We used one plain rule for every count in this article. It mirrors the 5, 13 and 34 bar levels of common 3-level layouts:
- Live dot: a bar gets a dot at level N when it makes the highest high (or lowest low) of the last N bars.
- Final dot: that dot stays only if no higher high (or lower low) prints in the next N bars.
In formula form, a live high dot at level N needs high[0] = highest(high, N). It turns final only after N more bars close with every high below it. Lows work the same way in reverse.
This explains the right-edge effect. A rising market makes a new N-bar high on many bars in a row, and each one gets a live dot. Then each new high wipes out the one before it. So during any live move, the newest dot is almost always a draft.
Note that the real 3 Level ZZ Semafor uses ZigZag code with depth, deviation and backstep inputs. Still, the timing logic is the same: a dot cannot be final until the bars that could beat it have closed. TradingView explains the general problem in its Pine Script documentation on repainting.
How we tested
We applied the rule above to MetaTrader 4 history from the Capital Point Trading terminal, MetaTrader 4, build 1471, read straight from the .hst files. On H1 we used the last 6,000 bars of EURUSD, GBPUSD, USDJPY and XAUUSD. On M15 we used 20,000 bars each of EURUSD and GBPUSD, covering June 2025 to August 2026.
For every bar, we asked whether a live dot appeared at level 5, 13 or 34, and then whether it survived the next N bars.
The chart images come from the TradingView web chart with OANDA data, captured on 7 and 8 October 2026. The two live-versus-final charts cover EURUSD and GBPUSD H1 from 28 September to 7 October 2026. We drew those dots ourselves with the same rule. The TradingView captures use the built-in Williams Fractal and ZigZag, not a Semafor script. Our method follows the site’s editorial testing policy. All counts are about how the indicator draws, not about trade results.
Semafor settings and what they change
Each level has a depth setting. A longer depth catches bigger swings, but it also needs more bars to confirm them. Our counts show the trade-off clearly.
| Input | What it does | Common layout | Right-edge effect (EURUSD H1, our count) |
|---|---|---|---|
| Level 1 depth | Window for the small dot | 5 bars | 74.5% of live dots vanished; final after 5 bars |
| Level 2 depth | Window for the middle dot | 13 bars | 83.0% vanished; final after 13 bars |
| Level 3 depth | Window for the large dot | 34 bars | 87.8% vanished; final after 34 bars |
| Deviation | Minimum move before ZigZag accepts a new leg | Set per level | Fewer dots, same right-edge rule |
| Backstep | Bars ZigZag looks back to tidy nearby swings | Set per level | Can shift a dot a few bars |
| Dot size and colour | Display only | Bigger for higher levels | None |
So a larger depth does not stop the repaint. It only moves it further back: a level-3 dot needs 34 hourly bars to settle, which is well over a trading day.
Reading the right edge on a live chart
The two charts below show the same nine trading days in two ways. Hollow grey circles are dots that appeared live and later vanished. Solid orange dots are the ones that stayed. The shaded strip on the right covers the last 13 bars, where no dot can be final yet.
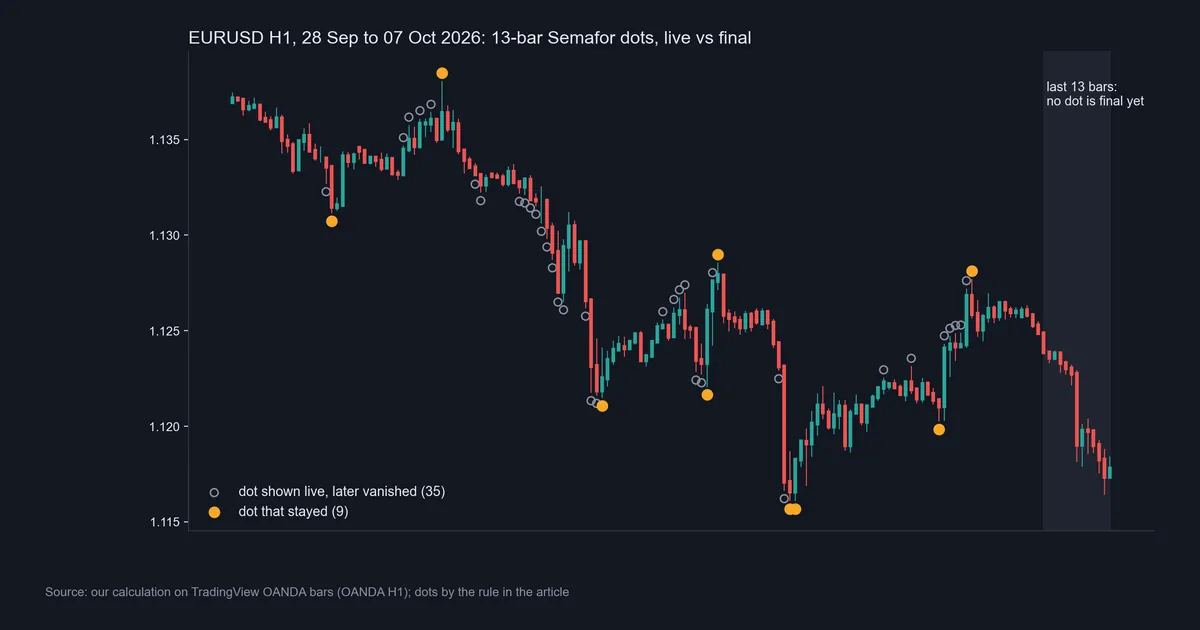
On EURUSD, 35 dots showed up live and later vanished, while 9 stayed. Look at the slide from 1.135 down toward 1.121. Almost every hourly low on the way down got a live dot. Each one then lost its place to the next lower low. Only the low near 1.121 on 1 October survived, because the 13 bars after it never broke below it.
Next, look at the twin orange dots near 1.1156. Two bars, 03:00 and 04:00 UTC on 5 October, printed the same low of 1.11612. Our rule keeps both, since neither beat the other. A ZigZag-based Semafor would keep only one.
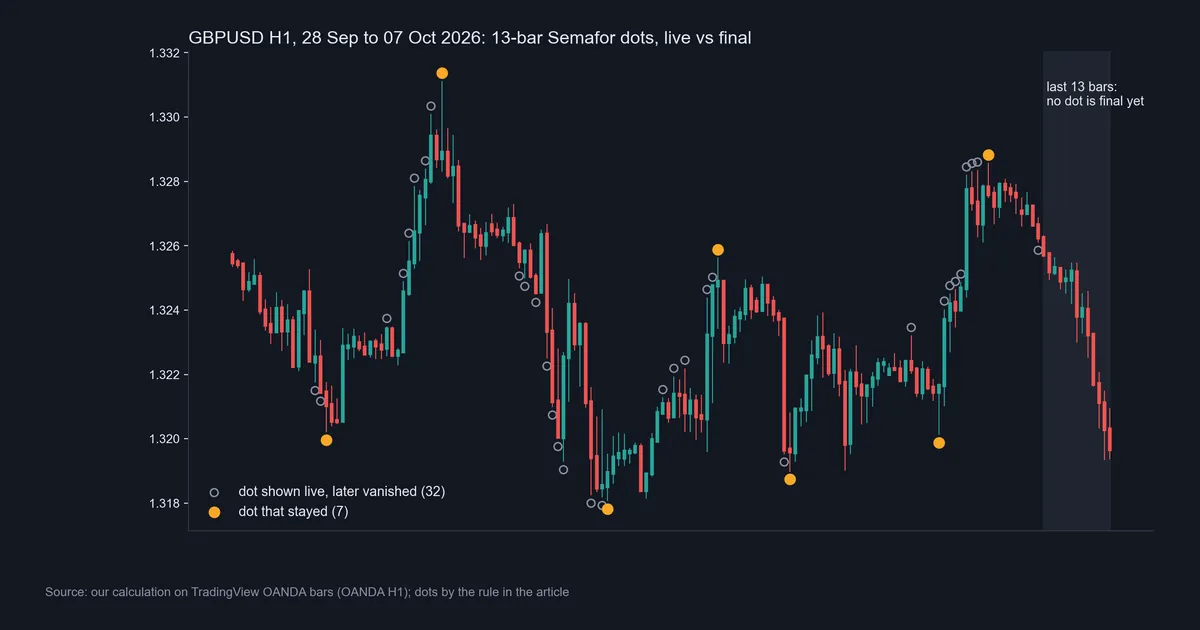
GBPUSD tells the same story. Here, 32 dots vanished and 7 stayed. The climb to the 1.331 top on 30 September shows a column of hollow circles under the final orange dot. In short, read the shaded strip as a draft zone and the area left of it as the record.
Worked example: one gold dot that moved
Our TradingView data for XAUUSD H1 shows the right-edge effect on a single dot. At 16:00 UTC on 6 October 2026, three level-13 dots were still live:
- a high dot at $4,170.44 from 08:00 UTC on 5 October;
- a low dot at $4,103.515 from 02:00 UTC on 6 October;
- a high dot at $4,179.685 from 12:00 UTC on 6 October.
The first two stayed on the final chart. The third did not. At 19:00 UTC, gold printed a high of $4,184.385, which is $4.70 above the live dot. So the indicator removed the 12:00 dot and drew a new one seven bars to the right.
Now compare EURUSD on the same afternoon. At 17:00 UTC, our rule showed a live high dot at 1.12768 from 12:00 UTC. No higher hourly high followed inside 13 bars, so it stayed. Both dots looked the same while live.
Then scale that up. Across the last 6,000 EURUSD H1 bars, 1,273 level-13 dots appeared live and only 217 survived. That is 17 in every 100. At level 5 the figures were 2,257 live and 576 final, so about one in four stayed.
What the numbers say across four symbols
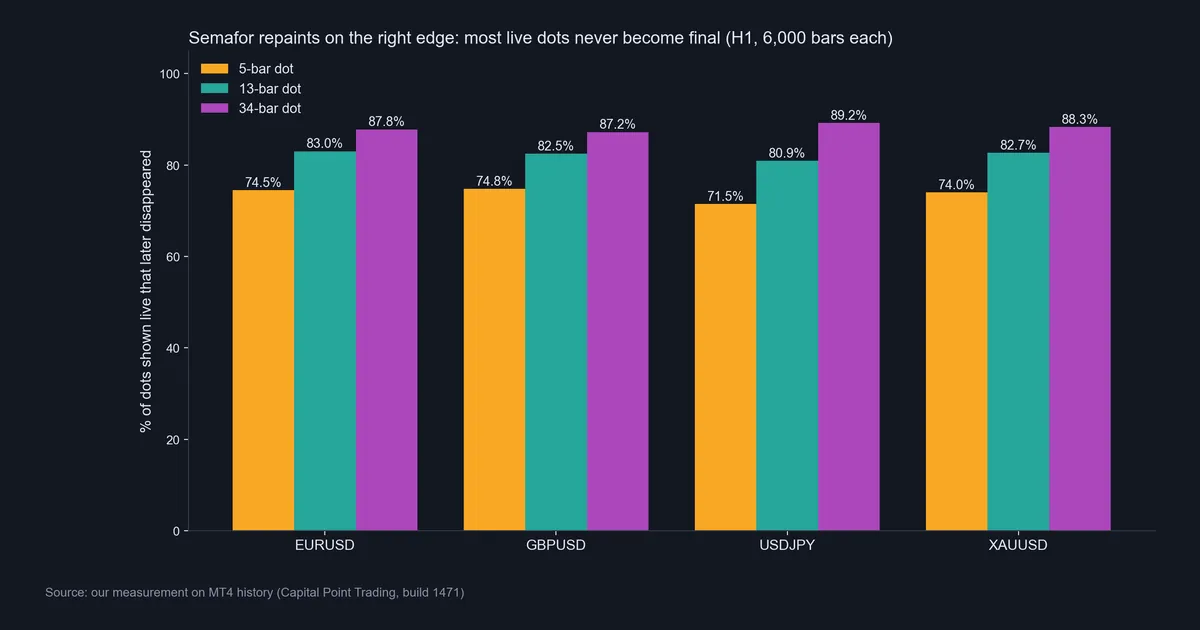
The share of vanished dots barely changes from one market to the next. On H1, the 5-bar level lost between 71.5% (USDJPY) and 74.8% (GBPUSD) of its live dots. The 13-bar level lost between 80.9% and 83.0%. The 34-bar level lost between 87.2% and 89.2%. Gold sat right in the pack, with 74.0%, 82.7% and 88.3%.
So the pattern is about the math, not the market. A longer window gives a new bar more chances to beat the old extreme, so bigger dots vanish more often, not less.
The fractal capture on gold makes the same point. Near the end of the capture, a long lower wick dips under $4,070 and carries no mark yet, because its two confirming bars had not closed. If you want to replay this yourself, our guide to TradingView Bar Replay lets you step through bars and watch marks appear late.
Download the complete indicator database
Put these concepts on your charts. One email unlocks the full library of 1,380+ indicators with compiled MT4 and MT5 files, plus my TradingView scripts. No paywall, no spam, unsubscribe any time.
Get free access to my indicator database
One email unlocks 1,380+ free MT4, MT5 and TradingView indicators — the complete library. No single-tool download; you get the whole database.
Where it fails
Semafor fails in a specific way: it looks best exactly where you cannot trade it. On settled history every dot sits on a true swing. At the live edge, roughly three in four small dots and almost nine in ten large dots vanish in our counts. A backtest that reads the final dots will look far better than live use, because it uses information from bars that had not printed yet.
Next, confirmation costs time. A dot becomes final N bars after the swing, so a final dot tells you where a swing was, not where to act now.
Also, trends hurt it most. In a steady move the indicator keeps redrawing the leading dot, as the run of hollow circles on our EURUSD chart showed.
Finally, “non-repaint” versions change the trade-off rather than remove it. They wait N bars and then plot the dot back on the swing bar, or they plot it late on the confirming bar. You can compare both styles on our non-repaint Semafor indicator page. Either way, the delay is still there. Our guide to what repaint means covers the three main kinds.
The ZigZag cousin and the M15 check
Semafor borrows its swing logic from ZigZag, and ZigZag shows the right-edge problem even more plainly. In the GBPUSD H1 capture below, TradingView’s built-in ZigZag runs at 0.3% deviation and depth 10, with its last leg extended to the current bar. That final line moves with every tick. It will swing to a new point if price turns far enough.
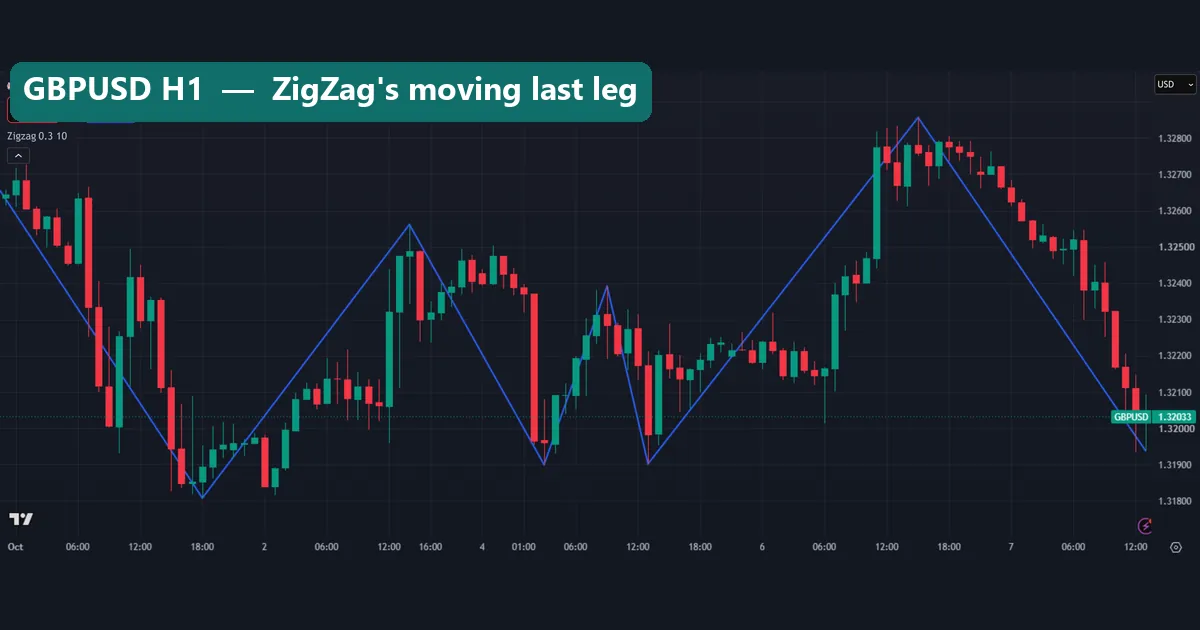
The legs to the left are fixed. However, the line from the top near 1.328 on 6 October down to the latest bar is not a finished leg. It is a running guess. Our ZigZag indicator for MT4 and MT5 behaves the same way, while the non-repaint ZigZag arrow indicator only prints an arrow after confirmation.
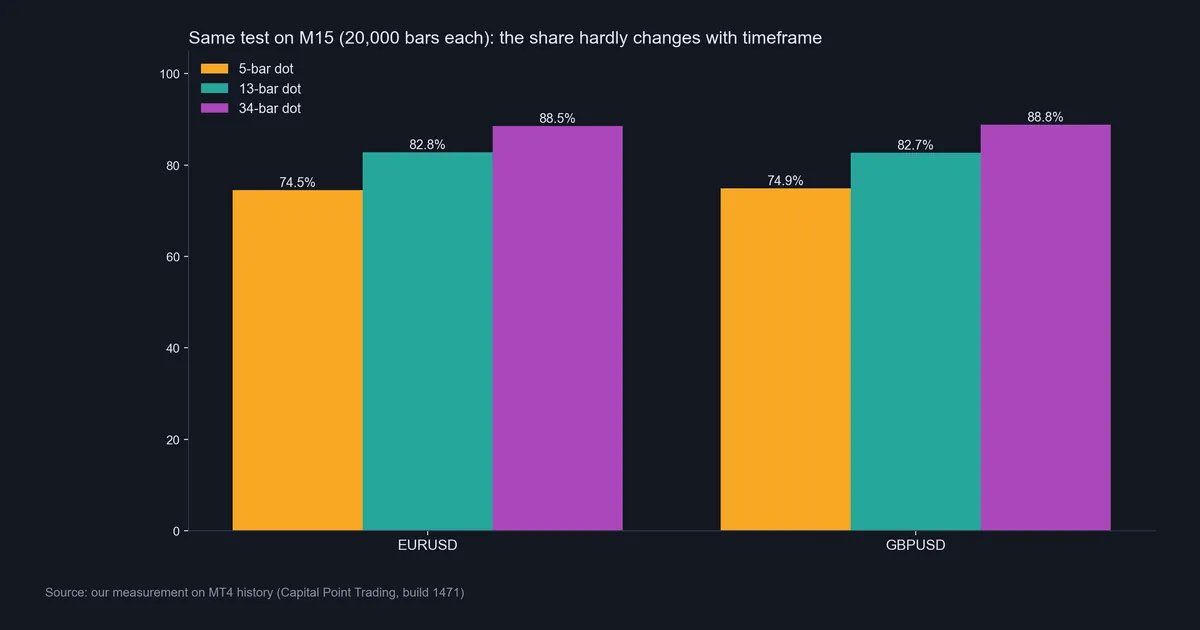
We also checked whether a faster chart changes the answer. It does not. On 20,000 M15 bars, EURUSD lost 74.5%, 82.8% and 88.5% of live dots at the three levels. GBPUSD lost 74.9%, 82.7% and 88.8%. Those are almost the same as the H1 figures.
Common mistakes with Semafor dots
- Judging it on history. Every dot left of the confirmation window is final, so history always looks clean. Instead, watch it live for a week, or step through it in replay.
- Acting on a level-3 dot at the edge. The big dot is the least stable while live. In our H1 counts, at least 87.2% of live 34-bar dots vanished on every symbol.
- Reading a string of dots as many signals. In a trend, the indicator redraws one leading dot many times. It is one swing that has not finished, not a run of setups.
- Backtesting on final dots. A test that enters on a dot uses the future bars that confirmed it. Instead, only count a dot once N bars have closed after it, and price the entry at that later bar.
That said, Semafor still has uses. Final dots make a quick map of past swings for support and resistance, which our support and resistance lesson builds on. They also help label highs and lows when you study market structure in forex.
Where to go next
If you want the indicator itself, start with the 3 Level ZZ Semafor download or the Chaos Semafor indicator. Our downloads are compiled files for MT4 and MT5. Then follow the steps in how to install MT4 and MT5 indicators.
For a simpler swing marker, our fractal indicator uses the same 5-bar idea as Bill Williams. If repainting is your main worry, the list of non-repaint MT4 indicators groups tools that wait for closed bars.
For outside reading, MetaQuotes documents the built-in fractal function in its MQL5 reference for iFractals. The pattern itself has a plain overview in the fractal definition at Investopedia.
FAQ: Semafor repainting
Is Semafor left or right when it repaints?
It repaints on the right, on the newest bars, and settled dots on the left do not change.
How many bars before a Semafor dot is final?
By our rule, a dot is final after as many closed bars as its level: 5, 13 or 34 bars in the common layout.
Do the bigger Semafor dots repaint less?
No, in our counts they vanished more often, with 87.2% to 89.2% of live 34-bar dots gone on H1 across four symbols.
Does a lower timeframe change the repaint share?
Barely, since EURUSD lost 74.5% of live 5-bar dots on both H1 and M15 in our test.
Is a Williams Fractal the same as a Semafor dot?
Not quite, but a fractal is a 5-bar swing mark, so it behaves much like a level-1 Semafor dot and also waits two bars to confirm.
Can I backtest a Semafor strategy on history?
Yes, but only if each dot enters your test N bars after its swing, because using final dots at the swing bar borrows future data.
Does a non-repaint Semafor remove the delay?
No, it hides the moving dot by waiting for confirmation, so the delay of N bars stays in place.
Should I trade every new Semafor dot?
We do not give trade calls, and our counts show most live dots vanish, so treat any dot as one input among several; results are not guaranteed; past performance is not indicative of future results.
Last updated: 8 October 2026.

About the author
Written by Dominic Walsh, a Forex trader and MT4/MT5 indicator, Expert Advisor and script developer. Every tool on forexmt4systems.com is tested on live charts before release and ships with ready-to-use compiled MT4 (.ex4) and MT5 (.ex5) files. Learn more about the trader and developer behind this site.
How we build, test and correct every tool: Editorial & Testing Policy. Trading carries risk; see the disclaimer.