
TradingView market replay is the Bar Replay tool: it hides every bar after a date you pick, then plays the chart forward one update at a time. This guide shows how to start it, what each control does, and how to read a replay without fooling yourself. It also settles one question with data. On our MT4 history, about one EMA cross in four that showed up inside an hour was gone by the time that hour closed.
What TradingView market replay actually is
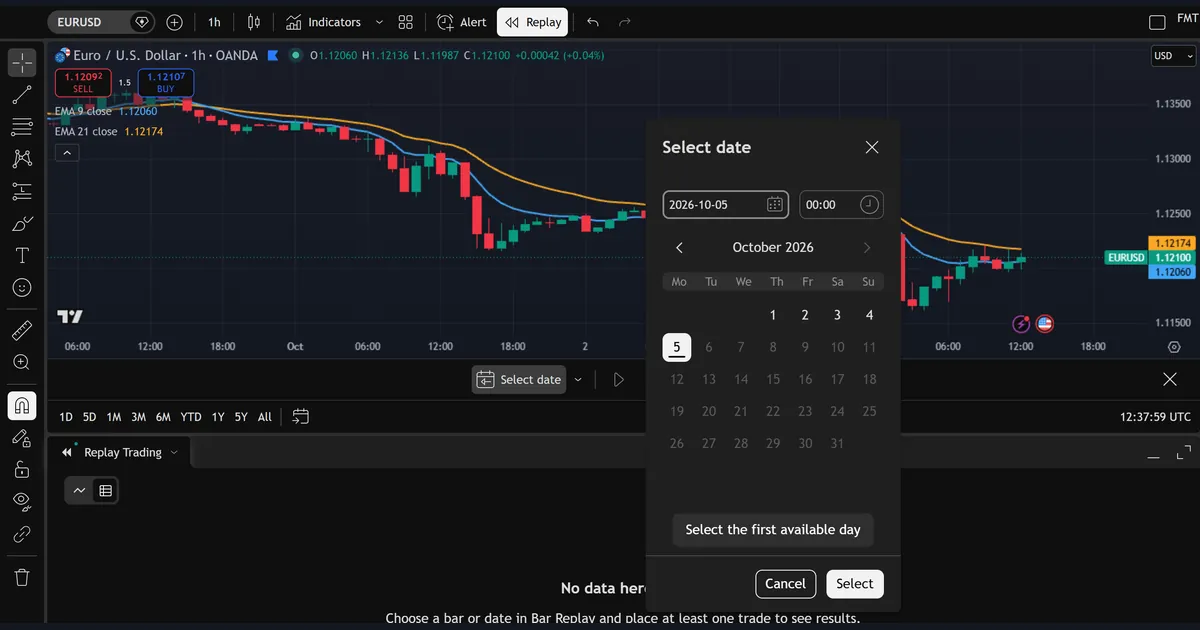
TradingView names the feature Bar Replay. Most traders call it market replay, so both names point to the same tool. You open it with the Replay button in the top toolbar. Then a “Select date” dialog asks for a day and a time. In our first shot the dialog sat on 5 October 2026, 00:00, with a calendar for October below it.
Once you confirm a date, every bar after it disappears, and your indicators stop there too. So you face the right edge the way you would have faced it live.
So replay lets you practise reading a chart and log decisions before you know the outcome. But it is not an automated backtest: you do the work by hand, one step at a time. For a broad view of the main chart screen first, our TradingView chart guide covers the toolbar and panels.
How Bar Replay works under the hood
Replay rebuilds the chart from stored history. Each step adds data and redraws the price and the studies. The key setting is the update interval. With a one-hour interval on an H1 chart, each step adds one finished bar. With a shorter interval, each step adds a slice of the next bar, so you watch that bar form.
That matters because indicators recalculate on the forming bar. Take an exponential moving average. The formula is EMA = a x close + (1 - a) x previous EMA, where a = 2 / (n + 1). For the EMA 9 that weight is 0.2. For the EMA 21 it is about 0.091. On a bar that is still open, “close” just means the latest price. So both lines move with every update until the bar ends.
As a result, two lines can cross mid-bar and then uncross before the close. Replay at a short interval shows this; replay at the chart’s own timeframe hides it. For the difference between the two averages, see our SMA vs EMA explainer. StockCharts also has a useful read on the topic: Arthur Hill on moving average crossovers at StockCharts ChartSchool.
How we tested
We ran two checks. First, we used Bar Replay on the TradingView web chart on 5 October 2026. The chart was OANDA EURUSD on the 1-hour timeframe with an EMA 9 (blue) and an EMA 21 (orange). We started the replay at 1 October 2026, 00:00, then stepped forward and opened each menu. Every interface image here comes from that session.
Second, we measured how often a forming bar shows a cross that later disappears, using MetaTrader 4, build 1471, on a Capital Point Trading terminal. We built H1 EMA 9 and EMA 21 values from M15 closes. Then, at each M15 close inside an hour, we recomputed the forming H1 bar’s EMAs. “Seen intrabar” means the lines crossed at some point inside the hour. “Vanished” means no cross was left when the hour closed.
The M15 history runs from 2 June 2025 to 26 August 2026 at most. However, the usable hours differ by symbol: 7,155 for EURUSD, 5,592 for GBPUSD, 2,410 for USDJPY and 6,200 for XAUUSD. This is broker data, not OANDA’s feed. Our method notes sit in the editorial testing policy.
Bar Replay controls and settings
After the start, a control bar appears under the chart. Our shots show the same set of controls each time. Here is what each one did on our chart.
| Control | What it does | Value in our session |
|---|---|---|
| Select date | Picks the cut-off point for the replay | 1 October 2026, 00:00 |
| Select the first available day | Button in the date dialog that starts from the earliest day on offer | Not used |
| Play | Runs the replay on its own at the chosen speed | Shown, not used |
| Step forward | Adds one update and stops | Clicked 10 times |
| Speed | Updates per second while playing, from 10x down to 0.1x | 7x (7 updates per second) |
| Update interval | How much data each update adds: 1 tick, 1 second, 1 to 30 minutes, or 1 hour | 1 hour |
| Auto select interval | Switch at the foot of the interval menu that lets TradingView pick the interval | On |
| Jump to real time | Skips forward to the live edge of the chart | Not used |
| Exit (X) | Closes replay and returns to the live chart | Shown in the bar |
A “Replay Trading” panel also opened below the chart. Before any trade it read “No data here, yet”.
Reading a replay on the chart
First, check the cut-off. Below, the last bar sits just before the “Oct” label, which fits a start at 1 October, 00:00. A faint “Replay” watermark also sits behind the candles, so you can tell a replay chart from a live one at a glance.
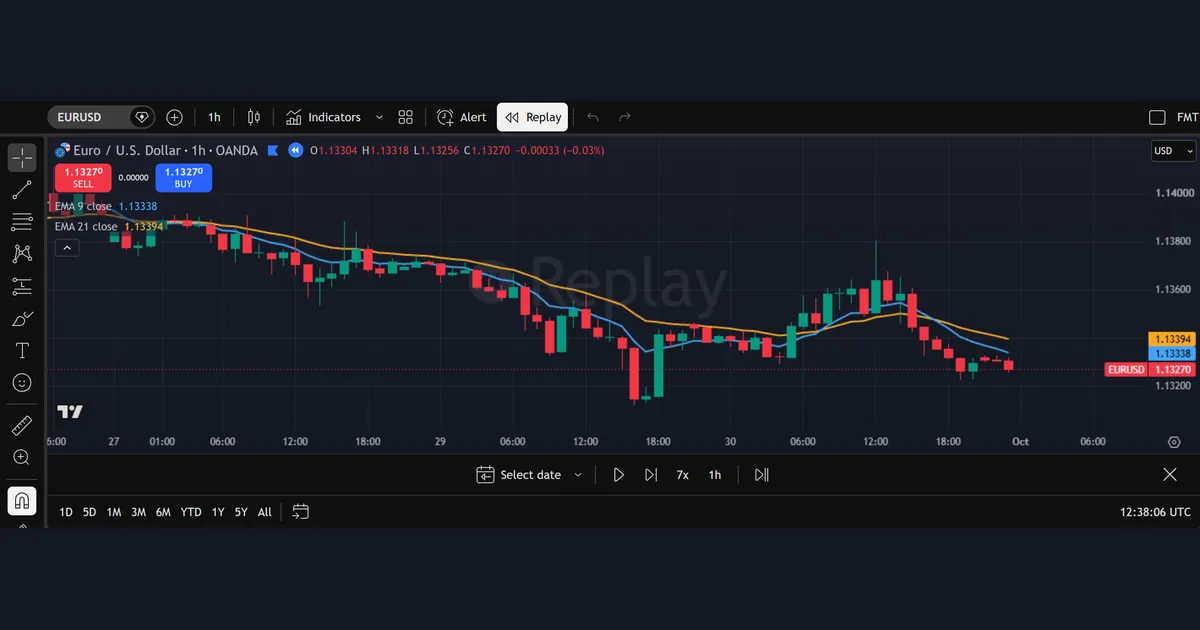
Next, read the legend. It showed O 1.13304, H 1.13318, L 1.13256 and C 1.13270 for the last bar. The EMA 9 read 1.13338 and the EMA 21 read 1.13394. So the fast line sat below the slow one and price sat below both. The chart had turned lower from a peak near 1.138 on 30 September.
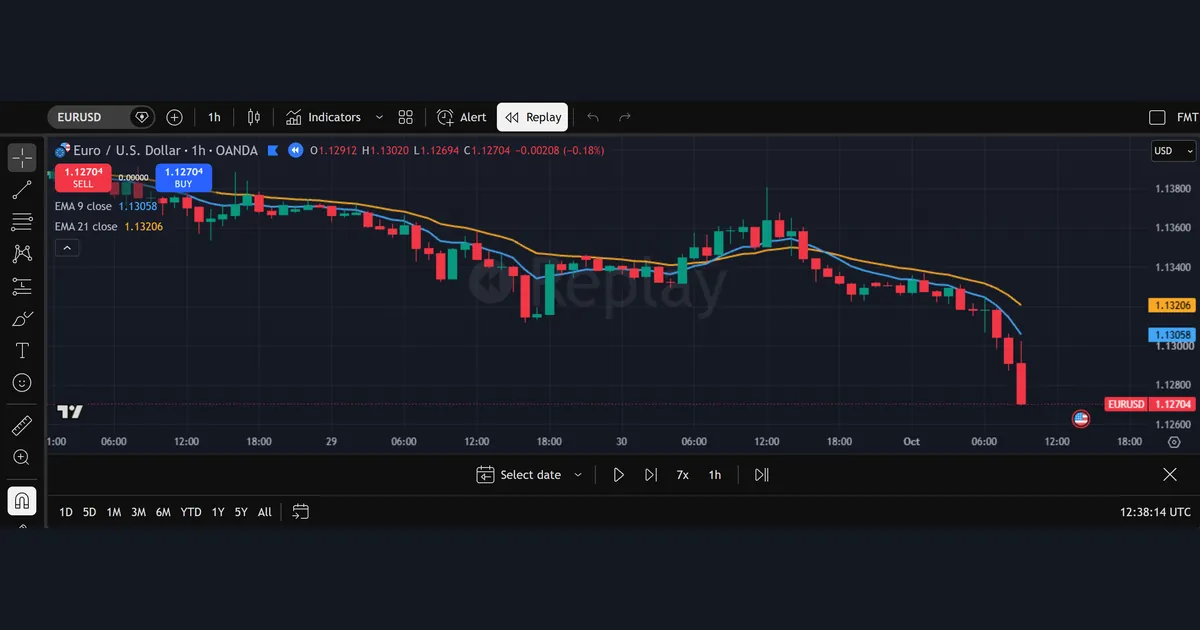
Then we clicked step forward ten times. With a 1-hour interval, each click added one finished H1 bar. The new right edge showed a long red candle with a low at 1.12694, and both EMAs had bent down. Write your read down before each step; that habit turns replay into practice.
Worked example: ten steps on EURUSD H1
Here are the numbers from our two replay shots, taken from the chart legends.
- At the start (1 October, 00:00): close 1.13270, EMA 9 at 1.13338, EMA 21 at 1.13394. So the EMA 9 sat 5.6 pips under the EMA 21.
- After ten steps: the last bar opened at 1.12912, hit 1.13020 high and 1.12694 low, and closed at 1.12704. That bar alone fell 20.8 pips (0.18%) from its open.
- EMAs after ten steps: EMA 9 at 1.13058, EMA 21 at 1.13206. So the gap had grown from 5.6 to 14.8 pips.
- Net move: from 1.13270 to 1.12704, the close dropped 56.6 pips over the ten bars.
First, the EMAs lagged the drop. Price moved 56.6 pips, yet the EMA 9 moved only 28 pips, from 1.13338 to 1.13058. Still, ten bars is a single case, and our guide to backtest sample size explains why you need far more before a count means anything.
Also note the quotes in the top-left corner. Live, the panel showed SELL 1.12092 and BUY 1.12107 with 1.5 between them. In replay, both read 1.13270 and the gap read 0.00000. So on our chart, replay trades filled with no spread at all.
What our intrabar measurement found
Replay at a 1-hour interval only ever shows finished H1 bars. But a live chart, or replay at a short interval, shows each bar as it forms. So we asked a direct question. How often does an EMA 9 / EMA 21 cross appear inside an hour and then vanish by the close?
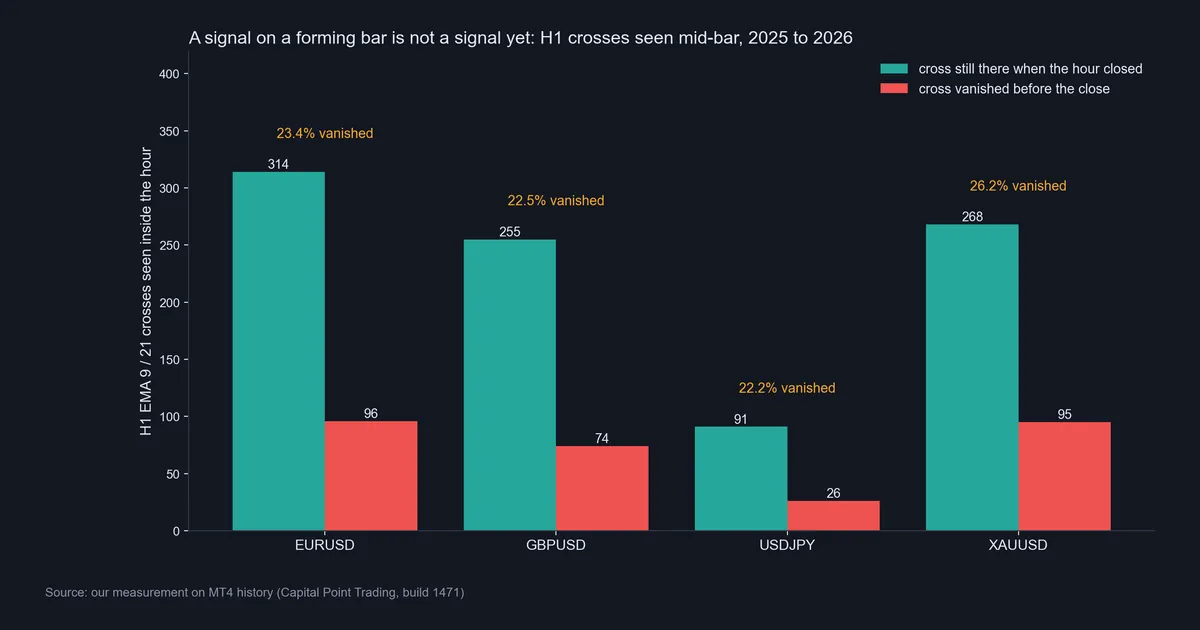
- EURUSD: 410 crosses seen inside the hour, 314 still there at the close, 96 vanished (23.4%).
- GBPUSD: 329 seen, 255 kept, 74 vanished (22.5%).
- USDJPY: 117 seen, 91 kept, 26 vanished (22.2%).
- XAUUSD: 363 seen, 268 kept, 95 vanished (26.2%).
Across all four, 291 of 1,219 mid-bar crosses were gone at the close, about 23.9%. That is roughly one in four. In short, a cross on a forming bar is a draft, not a signal. Gold had the highest share, but all four sit within four points. Also, our check sees only four prices per hour, so a tick-level view would likely catch more brief crosses.
Replay speed: how fast the chart plays
The speed menu sets how many updates play each second. Our menu listed 10x, 7x, 5x, 3x and 1x, which run 10, 7, 5, 3 and 1 updates per second. Below that, 0.5x, 0.3x, 0.2x and 0.1x slow down to one update every 2, 3, 5 and 10 seconds.
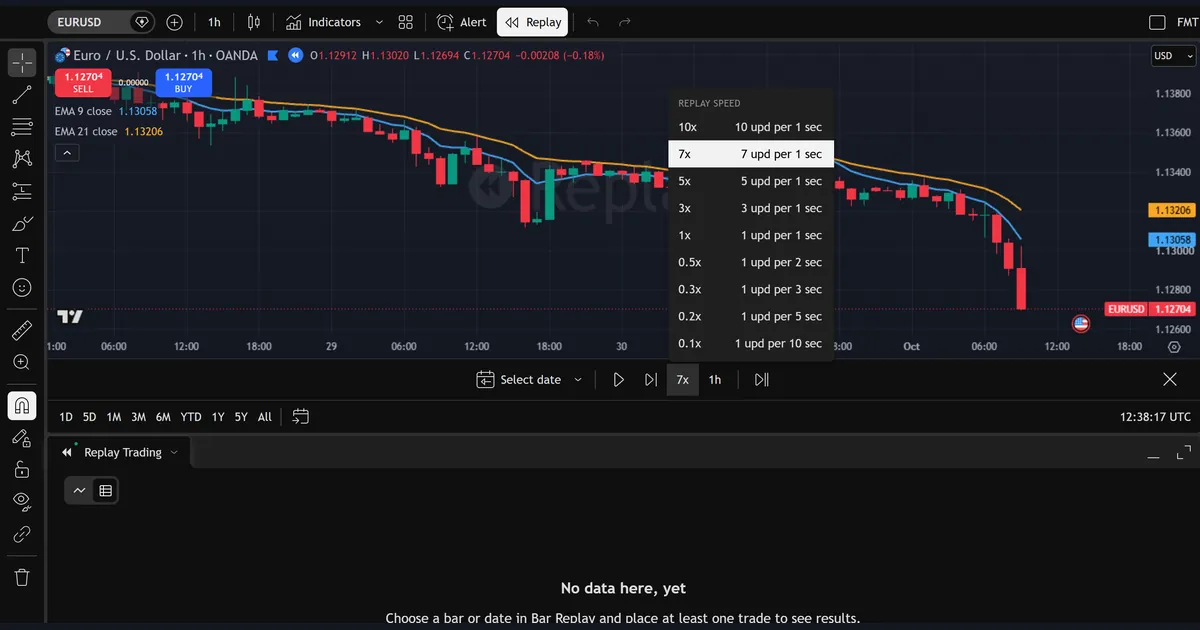
Speed and interval work together. At 7x with a 1-hour interval, the chart adds seven H1 bars a second. That is fine for skipping a quiet session, but far too fast to judge anything. So for practice, use slow speeds or single steps, and log each call. Our trading journal guide shows a simple format that suits replay sessions too.
Download the complete indicator database
Put these concepts on your charts. One email unlocks the full library of 1,380+ indicators with compiled MT4 and MT5 files, plus my TradingView scripts. No paywall, no spam, unsubscribe any time.
Get free access to my indicator database
One email unlocks 1,380+ free MT4, MT5 and TradingView indicators — the complete library. No single-tool download; you get the whole database.
Where it fails
Replay is good practice, but it has real limits.
- No spread on our replay trades. As shown above, buy and sell quotes matched in replay. So any practice result ignores the cost of entry. Our transaction costs guide shows how fast that cost adds up.
- Data depth depends on the plan. TradingView’s page on how much data is available for Bar Replay at TradingView Support says intraday replay history scales with the subscription. Higher plans reach further back.
- You know the era. Pick a famous date and memory leaks into your calls.
- Slow and small samples. Stepping by hand gives you tens of trades, not thousands. That is too few to judge a rule.
- Fills are idealised. Replay shows no slippage, so fills look cleaner than real ones.
In short, replay is a practice room. It is not proof that a method works. For that gap, read our backtesting vs forward testing guide.
One hour where the cross came and went
Here is a single hour from the 96 EURUSD cases. It is the H1 bar that started at 19:00 server time on 18 August 2026. The chart plots EMA 9 minus EMA 21 in pips, so a change of sign means the lines crossed on screen.
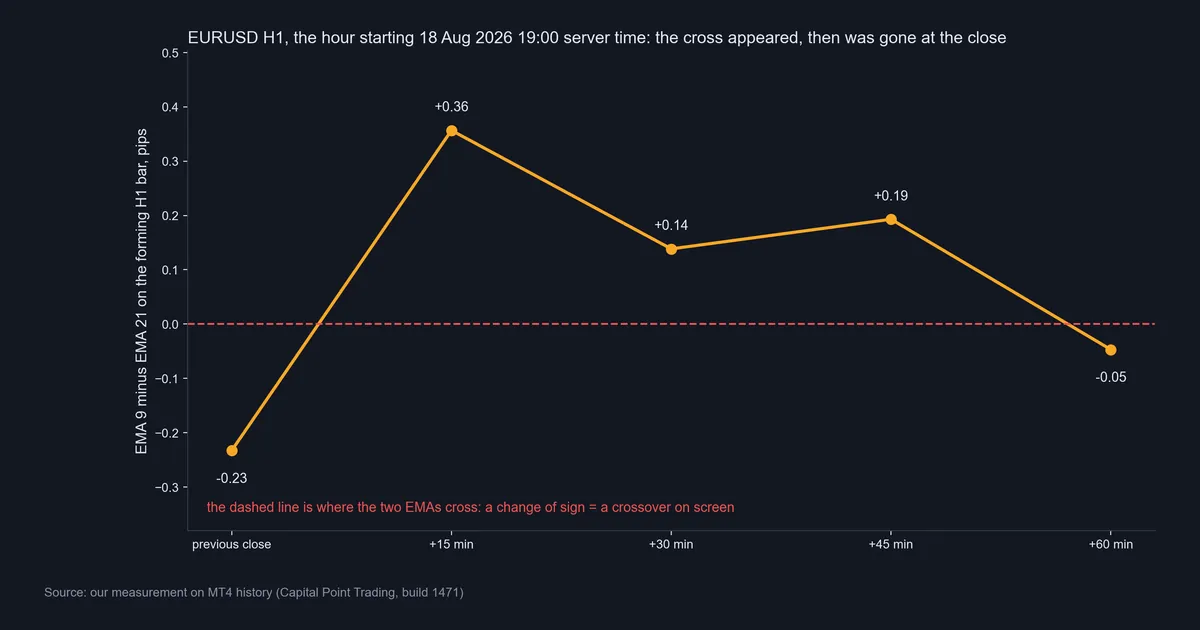
At the previous close, the gap was -0.23 pips, so the EMA 9 sat just under the EMA 21. Fifteen minutes in, it read +0.36, so a bullish cross was on screen. Then it read +0.14 at 30 minutes and +0.19 at 45 minutes. But at the close, it ended at -0.05. So the cross that showed for most of the hour never made it into the finished bar.
Now look at the interval menu: 1 tick, 1 second, 1 to 30 minutes, and 1 hour, plus an “Auto select interval” switch. With a 15-minute interval, that hour would build in four slices, so the cross would appear at the first and fade by the last.
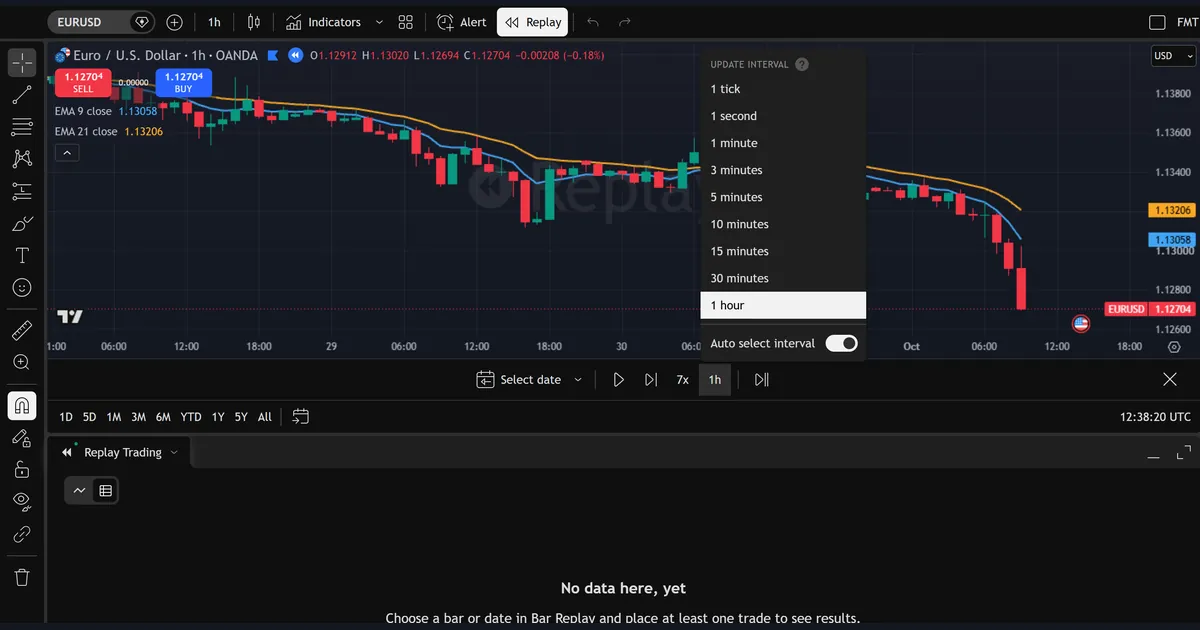
The same trap sits behind many repainting arrows. If you want arrows that only print on closed bars, start with our list of non-repaint MT4 indicators.
Common mistakes with market replay
- Acting on a forming bar. In our data, about one mid-bar EMA cross in four did not survive the close. So wait for the bar to finish before you count a signal.
- Treating practice results as a backtest. A few dozen hand-picked trades say little about a rule. Our list of common backtesting mistakes covers this and more.
- Forgetting costs. On our chart, replay trades had no spread. Instead of trusting the panel, subtract a cost from every practice trade yourself.
- Playing too fast. At 7x or 10x the bars land before you can think. Then the session turns into a show, not training. Step forward instead, and write each call down first.
Where to go next
If you have a fixed rule, a coded test covers far more trades than replay. Start with our guide to backtesting a trading strategy, then the MT4 strategy tester guide. Also check how a tester fills prices inside a bar. The help page on tick generation in the MetaTrader 5 Strategy Tester lists modes from every tick down to open prices only. A test on closes alone never sees a mid-bar cross, as our tick data backtesting guide explains.
For exits, the risk reward tool on TradingView also works inside replay. Our TradingView real-time data guide covers feeds and delays. If you trade EMA crosses on MT4, the EMA crossover alert indicator marks them. Finally, backtesting on Wikipedia gives general background.
FAQ
What is TradingView market replay called in the app?
TradingView calls it Bar Replay. You start it from the Replay button in the top toolbar, then pick a date and time in the “Select date” dialog.
How do I move forward one bar in replay?
Click the step forward button next to play in the control bar. With the update interval set to match your chart’s timeframe, each click adds one finished bar, as our ten clicks on EURUSD H1 did.
Can replay show a bar forming inside the hour?
Yes. Pick a shorter update interval, such as 15 minutes, on an H1 chart. Each update then adds a slice of the next bar.
What replay speeds can I choose?
Our menu offered 10x, 7x, 5x, 3x and 1x, plus 0.5x, 0.3x, 0.2x and 0.1x. The fastest plays 10 updates a second and the slowest plays one update every 10 seconds.
Does replay include spread on practice trades?
On our chart it did not. The buy and sell quotes matched and the spread field read 0.00000 during replay, while the live chart showed 1.5. So subtract a cost from your practice results yourself.
How far back can I replay intraday data?
It depends on your plan. TradingView’s support page on Bar Replay data says intraday history scales with the subscription, so check that page for your own limits.
Why did a cross I saw during replay disappear?
Because it formed on a bar that was still open. In our MT4 data, 96 of 410 mid-hour EMA 9 / EMA 21 crosses on EURUSD had vanished by the close, which is 23.4%.
Is replay practice the same as a backtest?
No. Replay trains your reading and lets you rehearse a plan, but the sample is small and fills are idealised. Use it for practice, then test fixed rules on far more data; results are not guaranteed; past performance is not indicative of future results.
Last updated: 5 October 2026.

About the author
Written by Dominic Walsh, a Forex trader and MT4/MT5 indicator, Expert Advisor and script developer. Every tool on forexmt4systems.com is tested on live charts before release and ships with ready-to-use compiled MT4 (.ex4) and MT5 (.ex5) files. Learn more about the trader and developer behind this site.
How we build, test and correct every tool: Editorial & Testing Policy. Trading carries risk; see the disclaimer.