
The Adam and Eve pattern is a double bottom with a sharp first low and a wide, rounded second low. Many trading sites treat that mix as a stronger reversal signal than a plain double bottom. So we tested the claim on eight years of daily forex data. This guide shows how to spot and measure the pattern. It also settles whether the shape of the lows changed what came next. In our data, it did not.
What the Adam and Eve pattern is
It is a double bottom with a twist. Thomas Bulkowski, author of the Encyclopedia of Chart Patterns, split double bottoms into four types by the shape of each low. He calls a narrow, pointed low “Adam”. Often it is a single long wick, a one-day spike down. He calls a wider low “Eve”. There, price spends several bars near the bottom, so the low looks rounded.
That gives four pairs: Adam and Adam, Adam and Eve, Eve and Adam, and Eve and Eve. The first name always describes the first low. Bulkowski explains the shapes on his Adam and Eve double bottom page at ThePatternSite. His figures come from stocks, while ours come from currency pairs.
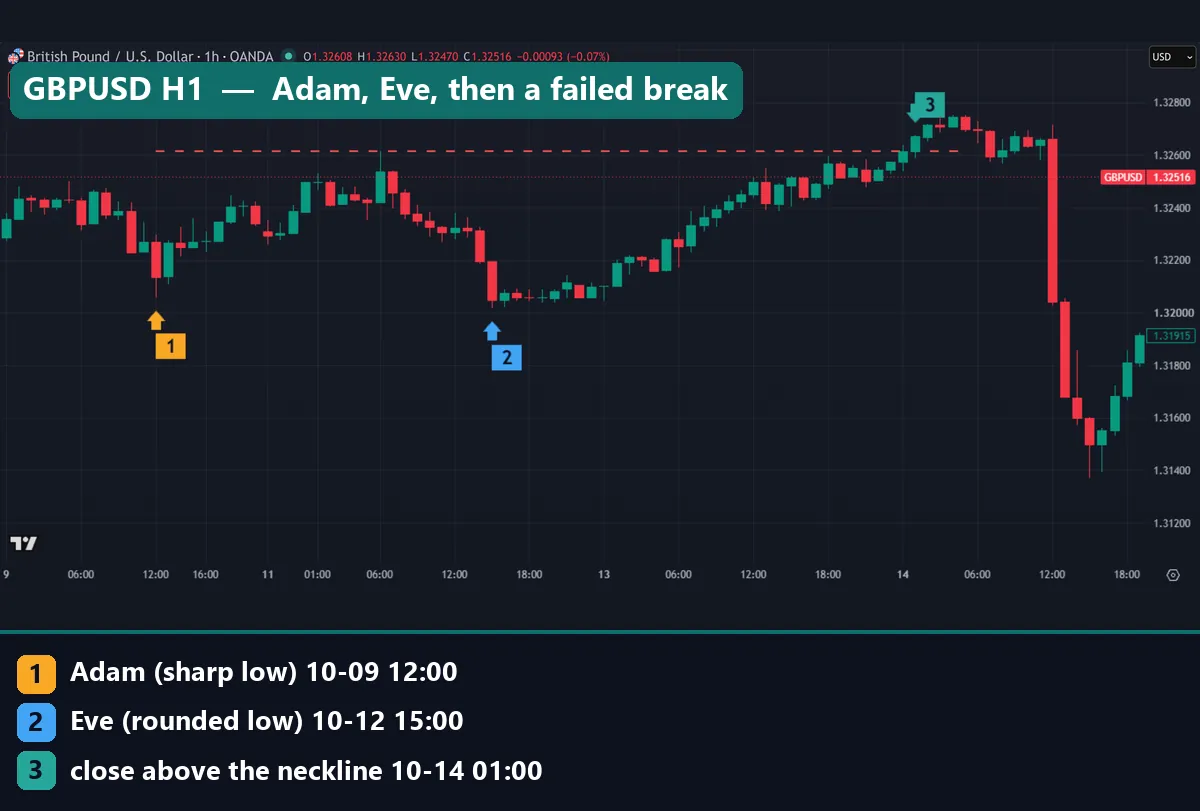
The GBPUSD hourly chart above shows both shapes. Marker 1 is a one-bar spike to 1.32058 at 12:00 UTC on 9 October 2026. Marker 2 is the low of 1.32017 on 12 October, followed by a flat run of small candles. Price closed above the 1.32616 neckline at 01:00 UTC on 14 October. Yet within 12 hours, it closed below both lows.
The mirror, an Adam and Eve double top, flips the shapes upside down. We did not test tops, so we print no numbers for them. Our double top pattern guide covers the plain version.
How the pattern works: lows, neckline and target
The story is simple. The first low is a panic. Sellers flush price down hard, and buyers snap it back within a bar or two. Then the second low comes in calmer. Price drifts to the same area, sits there for a while, and turns up. Chart books read that slow second low as sellers running out of steam.
In practice, the levels match any double bottom pattern:
neckline = highest high between the two lows
height = neckline - lower of the two lows
target = neckline + height
Next, the pattern only completes when a candle closes above the neckline. A wick through the line does not count. The classic stop sits under the lower low, because a close down there voids the idea. Our guide to measured move targets covers the target rule.
Nothing in the formula changes between Adam and Eve. So the real question is whether the shape adds anything.
How we tested the Adam and Eve pattern
We used two sets of data. For the statistics, we read MetaTrader 4, build 1471, terminal history from Capital Point Trading. That gave us daily bars on 23 forex pairs from 12 June 2018 to 24 August 2026.
We also ran the scan on hourly bars. EURUSD, GBPUSD and USDJPY covered 22 December 2025 to August 2026. Gold (XAUUSD) covered 1 July 2025 to 20 August 2026.
For the chart examples, we used the TradingView web chart with OANDA data, captured on 15 October 2026. Every marker and line on them comes from our scan, not from drawing by eye.
We placed no trades. Instead, we counted what price did after each pattern, before spread, swap and commission. Pattern books also check volume, but MT4 and OANDA only show tick volume, a count of price changes. So we left it out. Our full method sits in the editorial testing policy.
Our detection rules and settings
A pattern only exists once you define it. Here is our exact rule set.
| Parameter | Our setting |
|---|---|
| Swing low | Lowest low of an 11-bar window, 5 bars on each side |
| Pairing | Two swing lows in a row, 10 to 60 bars apart |
| Equal lows | Within 0.5 ATR of each other |
| Neckline | Highest high from the first low to the second |
| Minimum height | 1.5 ATR from the lower low to the neckline |
| Shape count | Bars within 7 of each low whose low sits inside 0.35 ATR of it |
| Adam (sharp) | 1 or 2 bars |
| Eve (rounded) | 4 or more bars |
| Not classified | Exactly 3 bars (left out) |
| Break | First close above the neckline, from 5 bars after the second low, within 30 bars |
| Target | Neckline plus height, within 40 bars |
| Failure | A close below the lower low before the target |
| Follow-through | Close 10 bars after the break vs the break close |
ATR is the 14-bar average true range at the second low. The iATR reference in the MQL5 documentation shows how MetaTrader computes it. Our guide to what ATR means in trading explains why we scale by it.
Our swing low is a wider Williams fractal, which uses two bars on each side. See the Williams Fractal help page on TradingView or our Williams fractals guide.
Reading an Adam and Eve double bottom on a chart
All our charts work the same way. Markers 1 and 2 are the lows, labelled Adam (sharp) or Eve (rounded) by our rule. The red dashed line is the neckline. Marker 3, where it appears, is the first close above it after our five-bar wait.
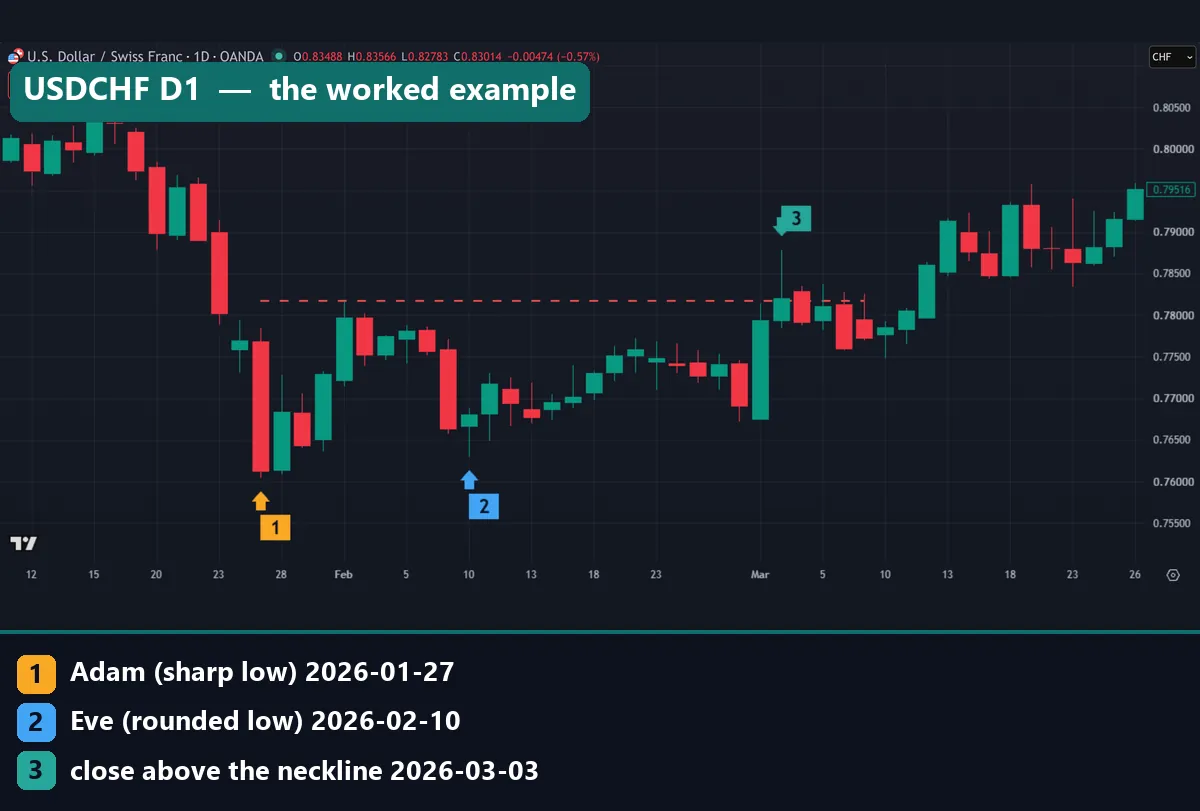
USDCHF on the daily chart is a textbook case. The Adam low on 27 January 2026 came from one long red candle that reached 0.76038. Then the Eve low on 10 February sat at 0.76292, with nearby candles holding just above it. Price ground higher for three weeks and closed above the 0.78174 neckline on 3 March.
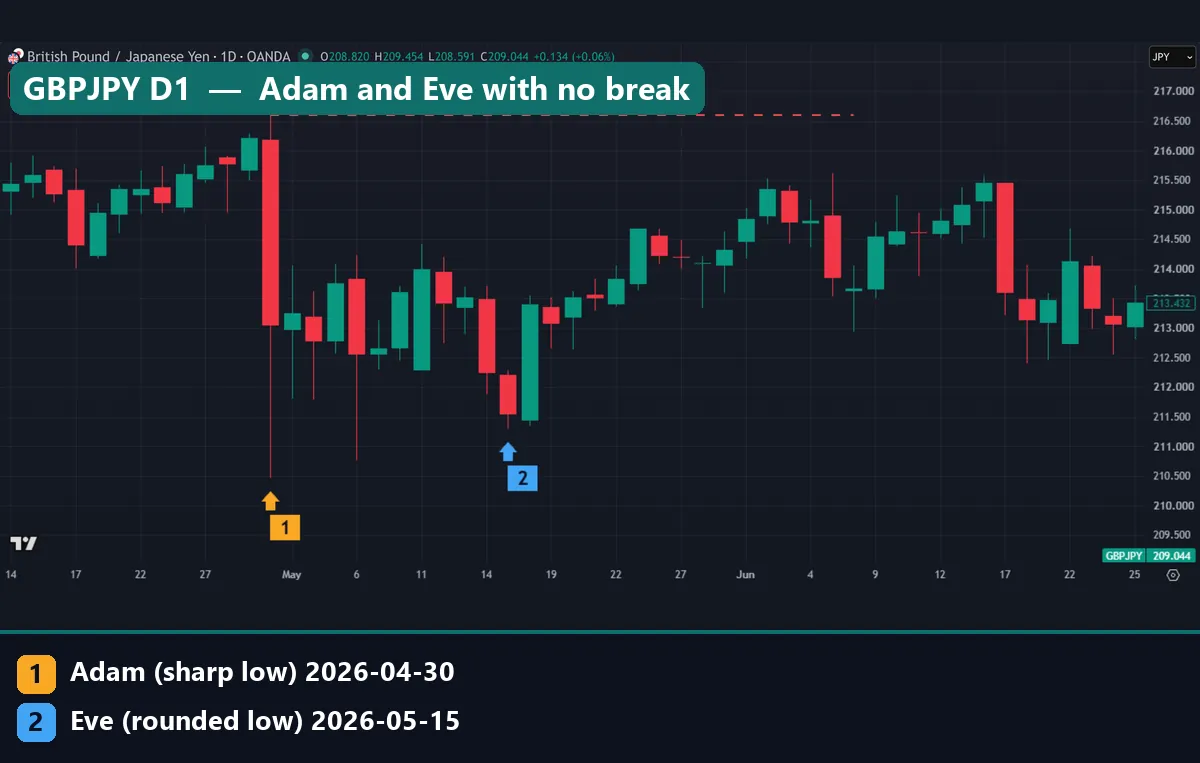
GBPJPY shows the same shapes with no result. On 30 April 2026, one candle spiked down to 210.46 and closed far above its low. The Eve low followed on 15 May at 211.296. Yet the neckline sits at 216.602, the high of that same 30 April candle. So the pattern stood 614.2 pips tall from day one. Price got to about 215.5 in June but never closed above the line.
Worked example: USDCHF daily, January to March 2026
Here are the USDCHF numbers.
- Adam low: 0.76038 on 27 January 2026 (2 bars near the low).
- Eve low: 0.76292 on 10 February, 10 bars later (4 bars near the low).
- Neckline: 0.78174, the highest high between the lows.
- Height: 0.78174 minus 0.76038 equals 213.6 pips.
- Target: 0.78174 plus 0.02136 equals 0.80310.
- Break: a daily close at 0.78199 on 3 March, 2.5 pips over the line.
- Classic stop: under 0.76038.
From the break close, the stop sat 216.1 pips away and the target 211.1 pips away. So the trade offered about 1 to 1 before costs. Our risk reward ratio guide explains why that needs a high hit rate.
Next, look past marker 3. The next six daily candles all closed back under the neckline. A tight stop just below the line would not have survived. However, the pullback stayed far above 0.76038. On 12 March price closed above the line again and kept going.
The chart ends on 26 March, short of the target. In the same OANDA daily bars, price reached 0.80310 a few sessions later. So this one worked, but slowly. It also sits in the minority, as the next section shows.
What 183 daily double bottoms did
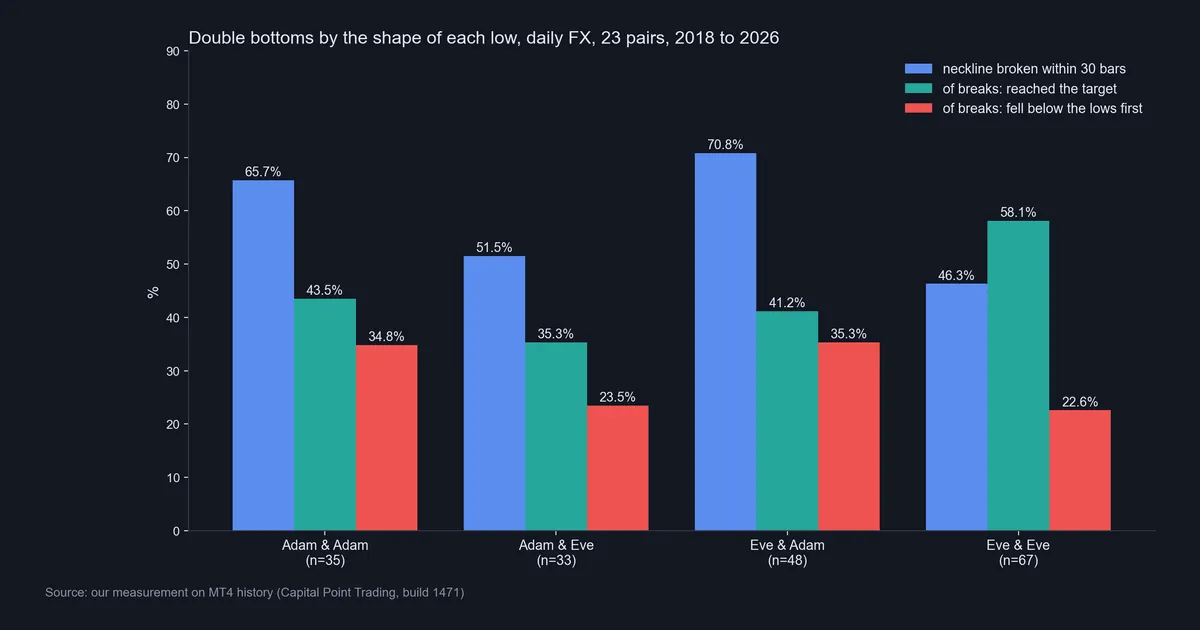
The scan found 183 classified double bottoms. Only 33 were Adam and Eve, about four a year across 23 pairs.
| Shape pair | Patterns | Broke neckline | Breaks that hit target | Breaks that closed below the lows first | Breaks higher 10 bars later | Median 10-bar move |
|---|---|---|---|---|---|---|
| Adam and Adam | 35 | 65.7% | 43.5% | 34.8% | 56.5% | +0.43 ATR |
| Adam and Eve | 33 | 51.5% | 35.3% | 23.5% | 47.1% | -0.01 ATR |
| Eve and Adam | 48 | 70.8% | 41.2% | 35.3% | 29.4% | -0.29 ATR |
| Eve and Eve | 67 | 46.3% | 58.1% | 22.6% | 48.4% | -0.17 ATR |
Adam and Eve broke its neckline in 51.5% of cases. That trails Adam and Adam at 65.7% and Eve and Adam at 70.8%. But it beat Eve and Eve at 46.3%. So the pattern sits mid-table, not at the top.
After the break: no follow-through
The picture gets worse after the break. Only 47.1% of Adam and Eve breaks closed higher 10 days later. By comparison, any day in the same data closed higher 10 days later 52.3% of the time. The median move came out flat, at -0.01 ATR. In short, the breaks did no better than chance.
Targets tell the same story. Of 17 Adam and Eve breaks, 6 reached the target within 40 bars, and 4 closed below the lows first.
The other groups do not rescue the idea. Across all four shapes, 46 of 105 breaks closed higher 10 days later. Adam and Adam did best, at 56.5%, but on only 23 breaks. Eve and Adam broke most often, yet only 29.4% of its breaks closed higher. No order emerges that the shape story would predict.
Also mind the sample sizes. Each group holds 33 to 67 patterns. So a gap of 10 points between two groups can be noise. Our guide to backtest sample size explains why.
Does the shape of the lows matter?
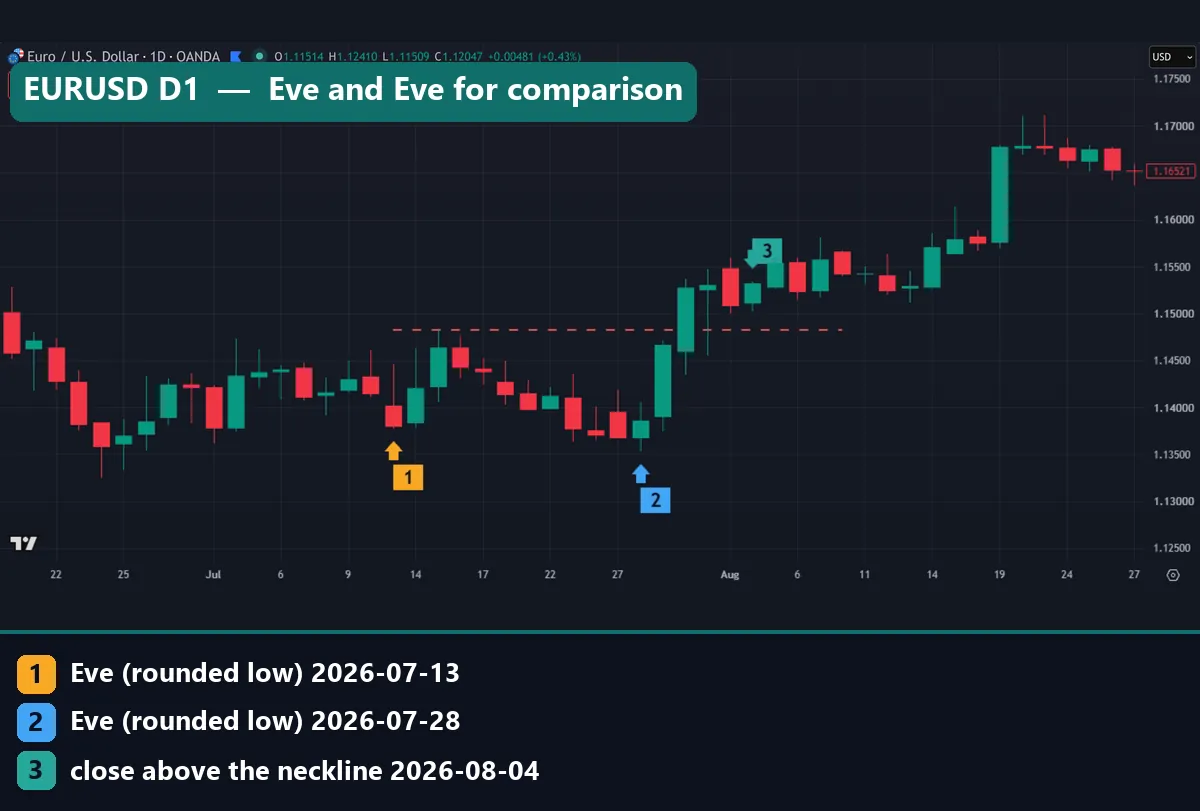
Compare a classic Eve and Eve. On the EURUSD daily chart, both lows look rounded. They printed 1.13775 on 13 July 2026 and 1.13532 on 28 July. The neckline sat at 1.14824, so the target came to 1.16116.
Notice one detail. EURUSD closed above the neckline on 30 July, 31 July and 3 August. Still, marker 3 sits on 4 August. That is because nobody can confirm a five-bar swing low until five more bars print. A live trader faces the same wait.
From there, a wick touched the target on 17 August. Then the 19 August candle closed well above it. So this one worked with no Adam in sight.
On hourly charts, the samples get tiny. We found only 12 Adam and Eve patterns on H1, and just 4 broke the neckline. The other groups ran from 12 to 34 cases. Numbers that small cannot rank the shapes.
Download the complete indicator database
Put these concepts on your charts. One email unlocks the full library of 1,380+ indicators with compiled MT4 and MT5 files, plus my TradingView scripts. No paywall, no spam, unsubscribe any time.
Get free access to my indicator database
One email unlocks 1,380+ free MT4, MT5 and TradingView indicators — the complete library. No single-tool download; you get the whole database.
Where it fails: weak points of the pattern
The weak points are concrete.
- Half never complete. Only 51.5% of daily Adam and Eve patterns closed above the neckline within 30 bars.
- Breaks do not follow through. 47.1% closed higher 10 days later, below the 52.3% rate for any day.
- Targets are usually missed. 35.3% of breaks reached the target, and 23.5% closed below the lows first.
- The shape is a judgment call. Change our 0.35 ATR band or 7-bar window and some lows flip from Adam to Eve.
- One bar can distort the neckline. On GBPJPY, the Adam spike also set a neckline 614.2 pips higher.
- Small samples. 33 daily cases in eight years cannot prove much.
Also, every result here comes before spread, swap and commission. Costs would only make these numbers worse. Our guide to chart pattern failure covers the wider problem.
Two hourly charts where it failed
Gold shows a break that reversed within hours.
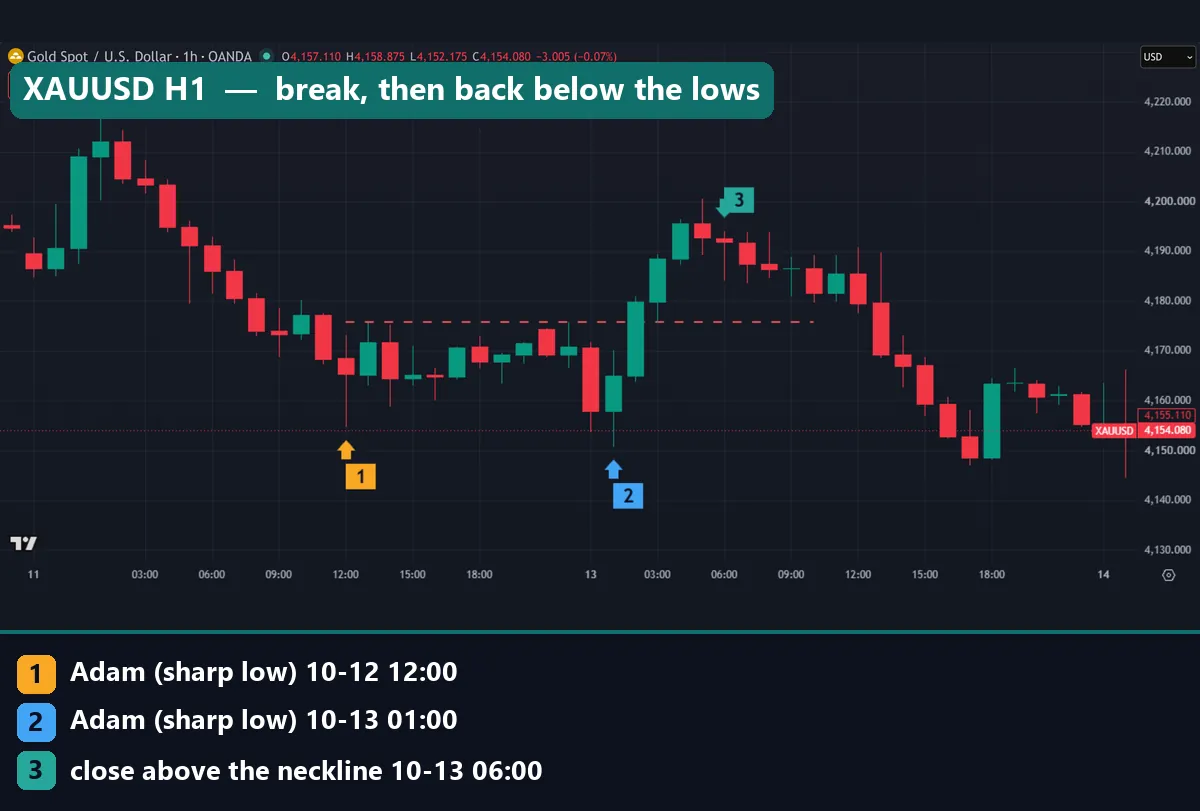
Both lows look sharp, so this one is Adam and Adam. The first printed $4,154.73 at 12:00 UTC on 12 October 2026. Then the second printed $4,150.79 at 01:00 UTC on 13 October. The neckline sat at $4,175.89.
Price first closed above the line at 02:00 UTC, inside our five-bar wait. So marker 3 sits at the 06:00 UTC close of $4,191.91. The rally topped out just under the $4,200.99 target. Then gold slid all afternoon, and by 17:00 UTC an hourly candle closed below both lows.
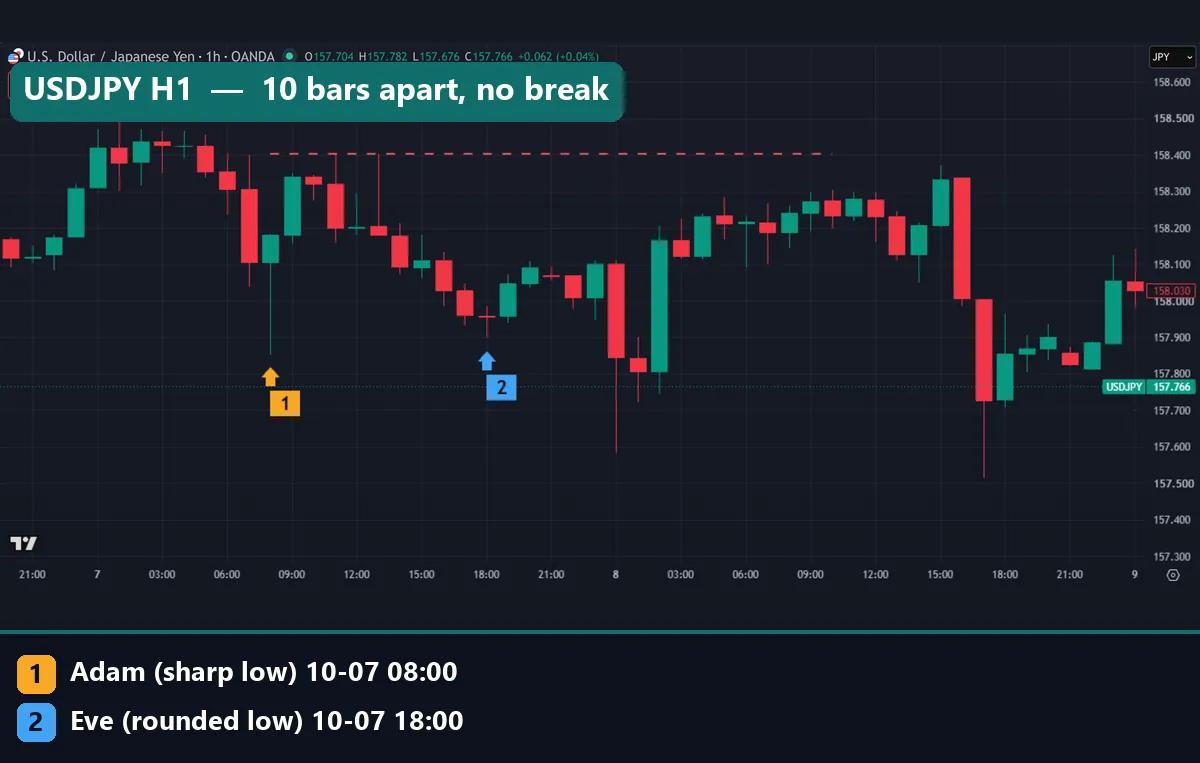
USDJPY shows an Adam and Eve that never broke. The Adam low came at 08:00 UTC on 7 October 2026, one long wick down to 157.853. Next, the Eve low formed at 18:00 UTC at 157.898, after a slow drift lower.
Six hours later, a candle closed a hair below both lows. Then price bounced and spent most of 8 October just under the 158.402 neckline. At 15:00 UTC, a high came within a few pips of the line. No candle closed above it, and two hours later the pair dropped to about 157.5.
Common mistakes with the Adam and Eve pattern
Four errors come up again and again.
- Buying the Eve low. The rounded second low feels safe, but it is not a signal. Wait for the close above the neckline.
- Paying extra for the shape. Do not size up because the lows look like Adam and Eve. In our data, the shape did not change the follow-through.
- Treating the first close as final. The USDCHF break cleared the line by 2.5 pips, then slipped back for six sessions. Our break and retest strategy test shows how often first breaks stall.
- Ignoring the stop distance. A stop under the lows can sit a full pattern height away. Size the position to that distance, as our guide on how to use a stop loss explains.
Where to go next
Start with our double bottom guide. Then read the triple bottom chart pattern test. For slow, rounded lows on their own, see the rounded bottom pattern guide.
To mark swing lows, our fractal indicator for MT4 plots fractal highs and lows.
For outside reading, StockCharts explains the plain pattern in its double bottom reversal article at StockCharts ChartSchool.
FAQ about the Adam and Eve pattern
What is the Adam and Eve pattern?
It is a double bottom with a sharp first low (Adam) and a wide, rounded second low (Eve). It completes when price closes above the neckline.
Is the Adam and Eve pattern bullish?
Only after the break. Before that, it is just a range with two lows. In our daily test, 51.5% of 33 patterns broke the neckline. Of those breaks, 47.1% closed higher 10 days later.
How do you tell an Adam low from an Eve low?
Look at how long price stayed near the low. A one or two-bar spike is Adam. Several bars near the same level make an Eve. Our cut-off was 4 or more bars within 0.35 ATR.
How do you calculate the Adam and Eve target?
Subtract the lower low from the neckline to get the height, then add it to the neckline. On USDCHF, that gave 213.6 pips and a target of 0.80310.
Is Adam and Eve better than a normal double bottom?
Not in our data. Adam and Eve broke the neckline 51.5% of the time: more often than Eve and Eve (46.3%), but less often than the other two pairs. After the break, it did no better than an average day.
Where does the stop loss go?
The classic stop sits under the lower of the two lows. In our daily sample, 23.5% of Adam and Eve breaks closed below the lows before reaching the target.
Does the Adam and Eve pattern work on lower timeframes?
We found only 12 cases on H1, and 4 of them broke. That is too few to judge. Smaller patterns also make costs a bigger share of the move.
Does volume confirm the pattern in forex?
Not in the classic sense. MT4 and OANDA show tick volume, a count of price changes, so we did not use it. Every figure here comes before costs; results are not guaranteed; past performance is not indicative of future results.
Last updated: 15 October 2026.

About the author
Written by Dominic Walsh, a Forex trader and MT4/MT5 indicator, Expert Advisor and script developer. Every tool on forexmt4systems.com is tested on live charts before release and ships with ready-to-use compiled MT4 (.ex4) and MT5 (.ex5) files. Learn more about the trader and developer behind this site.
How we build, test and correct every tool: Editorial & Testing Policy. Trading carries risk; see the disclaimer.