
A rounded bottom is a slow, U-shaped low where price drifts down, flattens out and then climbs back toward where the fall began. This guide settles three questions. First, how to define the shape with a rule instead of a hunch. Next, what 149 of them did on 23 daily currency pairs. Finally, why the breakout above the rim was often the end of the move, not the start.
What a rounded bottom is
The pattern has two common names. Older chart books call it a rounding bottom. Many traders call it a saucer bottom, because the curve looks like the side view of a saucer. Both names describe the same thing: a gradual turn from falling prices to rising prices, with no sharp low in the middle.
That gradual turn is the whole point. A double bottom has two clear lows. An inverse head and shoulders has three. In contrast, a rounded bottom has one wide, soft base.
The shape also forms the first half of a cup and handle. The cup is a rounded bottom. The handle is a small pullback after it.
Thomas Bulkowski, who has catalogued chart patterns for decades, notes on his page about rounding bottoms at ThePatternSite that they are hard to spot unless you look at long charts. We found the same.
How the saucer shape forms
Think of it in three phases. First, price falls from a starting level we call the rim. Then it drifts near the low, with small bars. Finally, it rises back toward the rim. When price closes above the rim, the textbook calls that the breakout.
To test that story, we needed a number for “round”. So we used a parabola, the simplest curve that opens upward:
fitted price = a x t^2 + b x t + c     (a > 0 means it opens upward)
R^2 = 1 - (sum of squared misses) / (sum of squared distances from the mean)
Here t is the bar number inside the window. The fit picks a, b and c so the curve sits as close to the closes as possible. This is an ordinary least squares fit, the same method the NIST Engineering Statistics Handbook on linear least squares explains.
Then R squared tells you how well the curve fits. A value of 1 means every close sits on the curve. A value near 0 means the curve explains almost nothing. We required at least 0.6, so the bowl had to be clear, but not perfect.
How we tested the rounded bottom
We ran one fixed rule over MetaTrader 4 history from Capital Point Trading, MetaTrader 4, build 1471. The data covered 23 currency pairs on the daily chart, from 12 June 2018 to 24 August 2026. The rule found 149 rounded bottoms.
For each one, we checked two things. First, did price close above the rim within 20 days? Second, for the bottoms that did, was price higher 10 days after the break?
We placed no trades. So every figure here is the outcome of a rule, before spread, swap and commission. The ATR we mention is the average true range, which our guide on what ATR measures explains.
For the chart examples, we used the TradingView web chart with OANDA data. We took the shots on 9 October 2026. They show EURUSD daily, plus GBPUSD, USDJPY, AUDUSD and XAUUSD hourly. The blue line is our fitted curve. The yellow dashed line is the rim, which is the first close of the window. Our method follows the editorial testing policy.
Detection settings we used
Every number below shapes what counts as a rounded bottom. Change one, and you get a different sample.
| Setting | Our value | What it does |
|---|---|---|
| Window length | 40 daily bars | The span the curve must fit |
| Low position | Middle third of the window | Stops a late bounce in a downtrend from passing as a bowl |
| Left edge height | At least 2 ATR above the low | The fall into the bowl must be real |
| Right edge height | At least 1.2 ATR above the low | Price must have climbed back part of the way |
| Curve | Parabola that opens upward | Gives “round” a number |
| Fit quality | R squared of 0.6 or more | The closes must hug the curve |
| Rim | First close of the window | The level a breakout must clear |
| Breakout | A daily close above the rim within 20 days | A close, not a wick |
| Outcome | Close 10 days after the break | Higher or lower than the break close |
Reading a rounded bottom on a chart
Start with the rim, not the curve. Find where the decline began and mark that close. Then check that price spent time near the low, and watch for closes back toward the rim. This is plain support and resistance reading, with a curve on top.
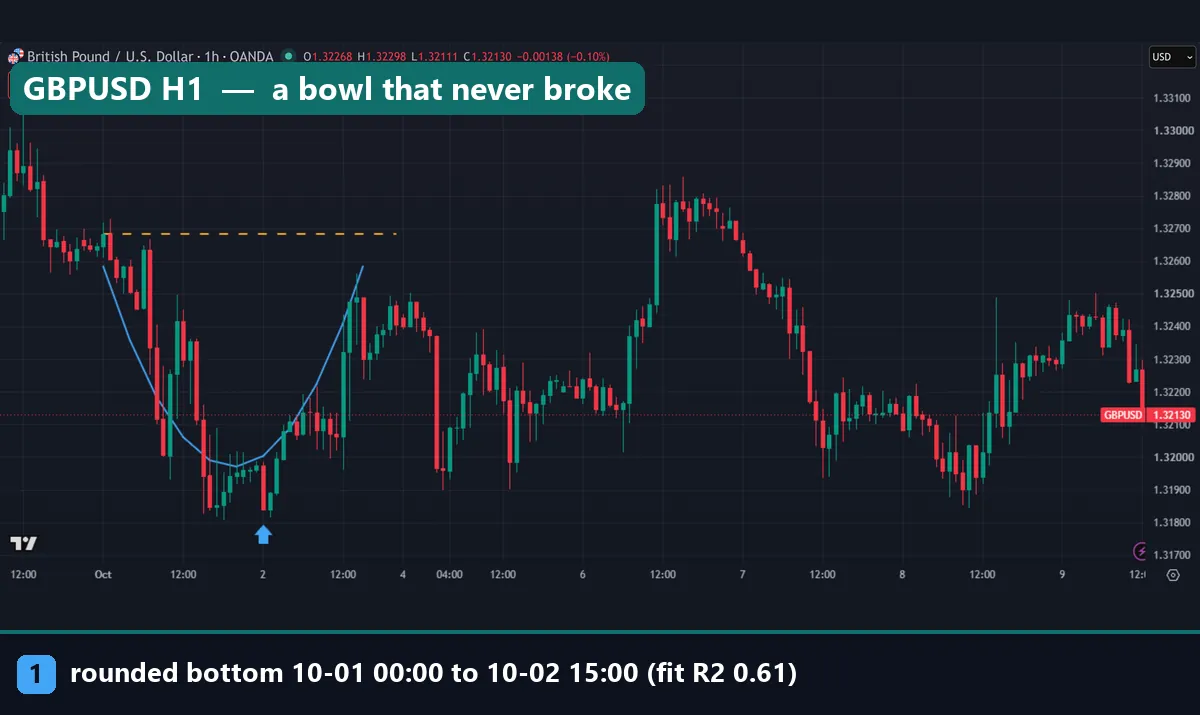
The GBPUSD hourly chart shows a bowl that never confirmed. Our rule found it from 00:00 UTC on 1 October to 15:00 UTC on 2 October 2026, with a fit of 0.61. The low close was 1.3184 and the rim was 1.32684. That is a bowl 84.4 pips deep.
However, no close above the rim came within 20 bars. Price slid instead. Later, on 6 October, price did trade above that level. But by then the bowl was days old, and nothing tied the move to it.
A rounded bottom that broke, then reversed
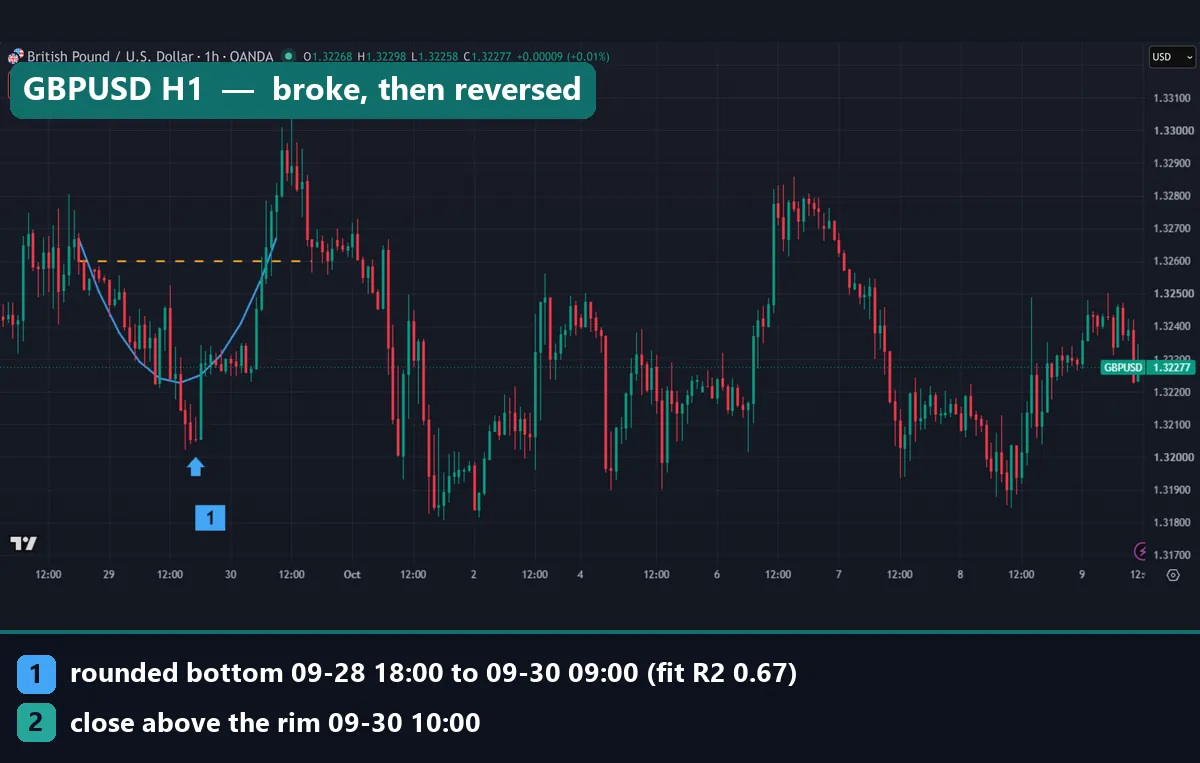
Now look at the earlier GBPUSD hourly bowl. It ran from 18:00 UTC on 28 September to 09:00 UTC on 30 September 2026. The low close was 1.32054, the rim was 1.326, and the fit was 0.67. Then at 10:00 UTC on 30 September, price closed above the rim.
So far, so textbook. Yet the chart shows what came next. Price pushed a little higher, then fell hard. By 2 October it traded below the low of the bowl. The break marked the top of the swing, not the start of a trend.
Worked example: EURUSD daily, February to April 2026
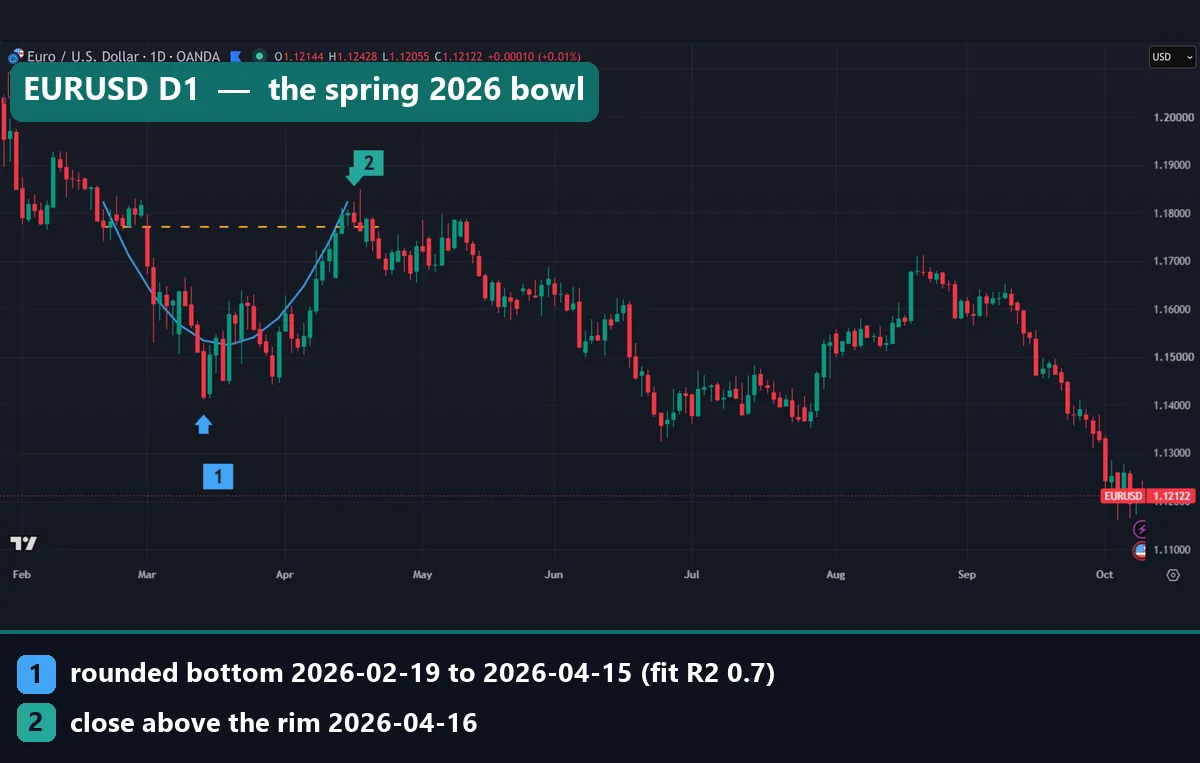
The opening EURUSD daily chart gives the cleanest numbers. Here is what our rule found, all from TradingView OANDA data:
- Window: 19 February to 15 April 2026
- Lowest close: 1.14164
- Rim (first close of the window): 1.17716
- Fit quality: R squared 0.7
- First close above the rim: 16 April 2026
First, measure the depth. The rim minus the low is 355.2 pips. Next, apply the classic target, which adds the depth to the rim. That gives 1.21268. Our guide to measured move targets explains where that habit comes from.
Then check what happened. Price stalled within days of the break and never got above 1.19 on our chart. By the capture date, EURUSD sat at 1.12122, below the low of the bowl. So the target was never close.
A second daily case had no image, but the numbers tell the same story. On GBPUSD, our rule found a bowl from 14 October to 8 December 2025. The low close was 1.30202, the rim was 1.33204 and the fit was 0.64. Price closed above the rim on 10 December 2025. The bowl was 300.2 pips deep.
What 149 rounded bottoms did next
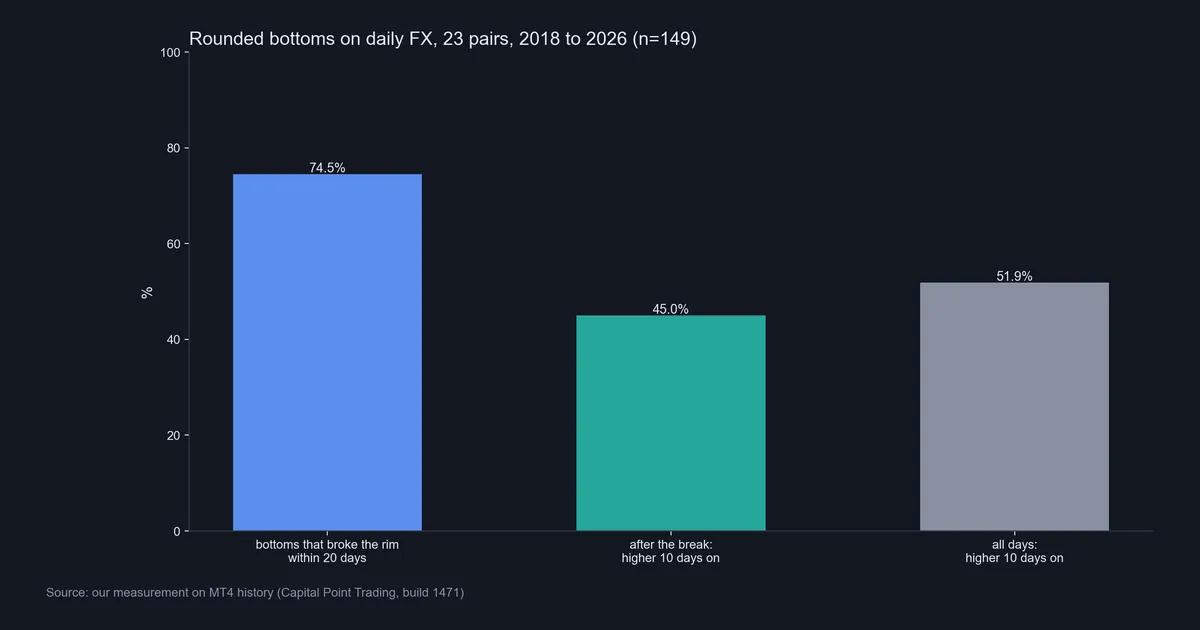
Here is the full sample. Of the 149 bottoms, 74.5% closed above the rim within 20 days. That sounds strong. However, it is partly built in. Our rule already demands that the right edge climbs back at least 1.2 ATR from the low. So price starts close to the rim.
The second number matters more. After the break, only 45.0% of cases closed higher 10 days later. In comparison, 51.9% of all days in the same data closed higher 10 days later. The median move over those 10 days was minus 0.26 ATR.
In short, the break was more often the end of the move than the start. Price had already rallied from the low to the rim. Then the extra push above the rim tended to fade. The sample is too small to call 45% a sell signal. Still, it is not the bullish edge the textbook implies.
A break that held on USDJPY
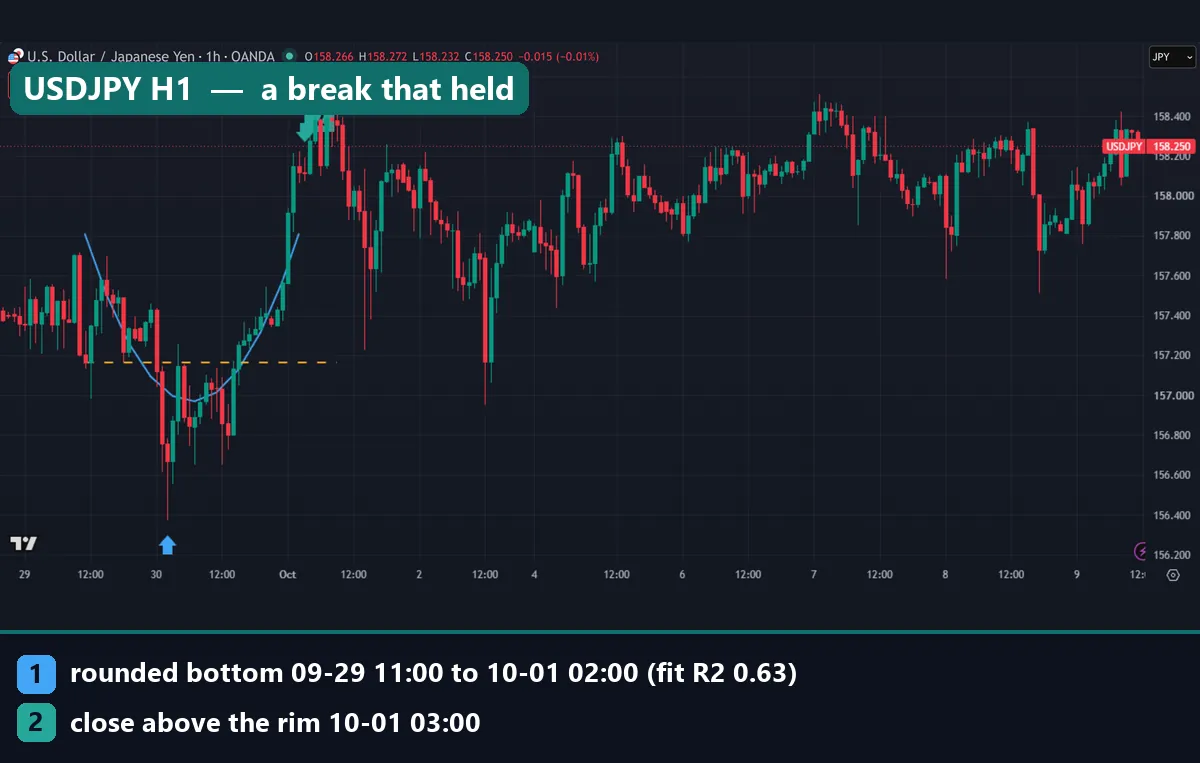
The USDJPY hourly chart shows the exception. The bowl ran from 11:00 UTC on 29 September to 02:00 UTC on 1 October 2026. The low close was 156.668 and the rim was 157.164, with a fit of 0.63. Price closed above the rim at 03:00 UTC on 1 October. After that, it held above 157.6 for most of the following week. Cases like this exist, but they were not the majority.
Download the complete indicator database
Put these concepts on your charts. One email unlocks the full library of 1,380+ indicators with compiled MT4 and MT5 files, plus my TradingView scripts. No paywall, no spam, unsubscribe any time.
Get free access to my indicator database
One email unlocks 1,380+ free MT4, MT5 and TradingView indicators — the complete library. No single-tool download; you get the whole database.
Where it fails: limits of the rounded bottom
The biggest failure is timing. By the time a bowl is visible, much of the rally has already happened. The shape only exists once price has climbed back toward the rim. So the “buy on the break” plan buys after a long move up. In our data, that is the point where the move most often stalled.
Second, the rim is fragile. Our rule used the first close of the window. Move the window a few bars and the rim moves too. Other traders use the highest close or a swing high, and each choice changes which bowls break.
Third, the curve is fitted after the fact. A parabola will fit almost any dip and recovery if you choose the window well. So a pretty curve on a past chart proves little. Our guide on why chart patterns fail covers this hindsight problem in more depth.
Fourth, the sample is small. With 149 daily cases across 23 pairs over eight years, a few points either way is noise. Also, we tested forex only, not stocks.
Finally, there is no volume to lean on. Classic descriptions want volume to rise on the right side of the bowl. But forex has no central volume, and MT4 and TradingView OANDA volume is tick volume, a count of price changes. So the volume check that chart books describe does not translate cleanly.
Two more hourly cases
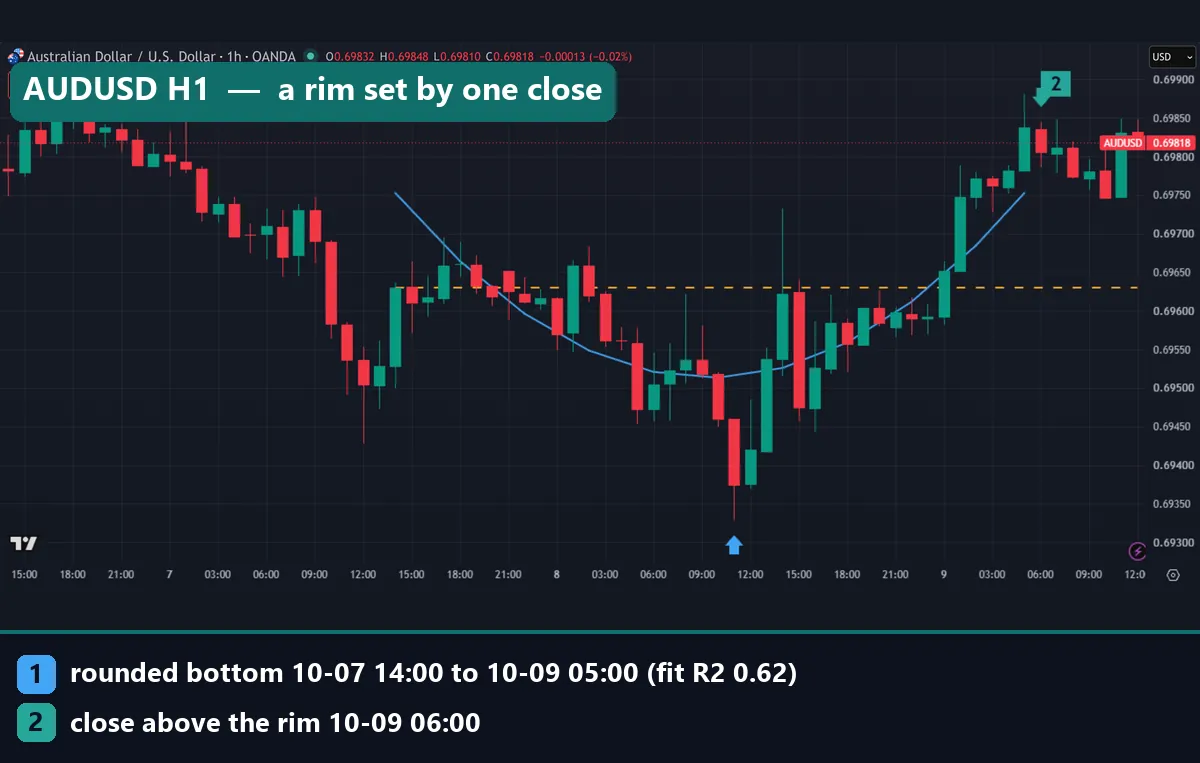
The AUDUSD hourly chart shows how odd the rim can look. Our rule found a bowl from 14:00 UTC on 7 October to 05:00 UTC on 9 October 2026. The low close was 0.69374, the rim was 0.6963, and the fit was 0.62. Price closed above the rim at 06:00 UTC on 9 October.
But look at the dashed line. It cuts straight through a block of candles on 7 October, before the low. That is because the rim is a single close. So the “resistance” it marks was crossed back and forth several times. The chart ends soon after the break, so we cannot judge what followed.
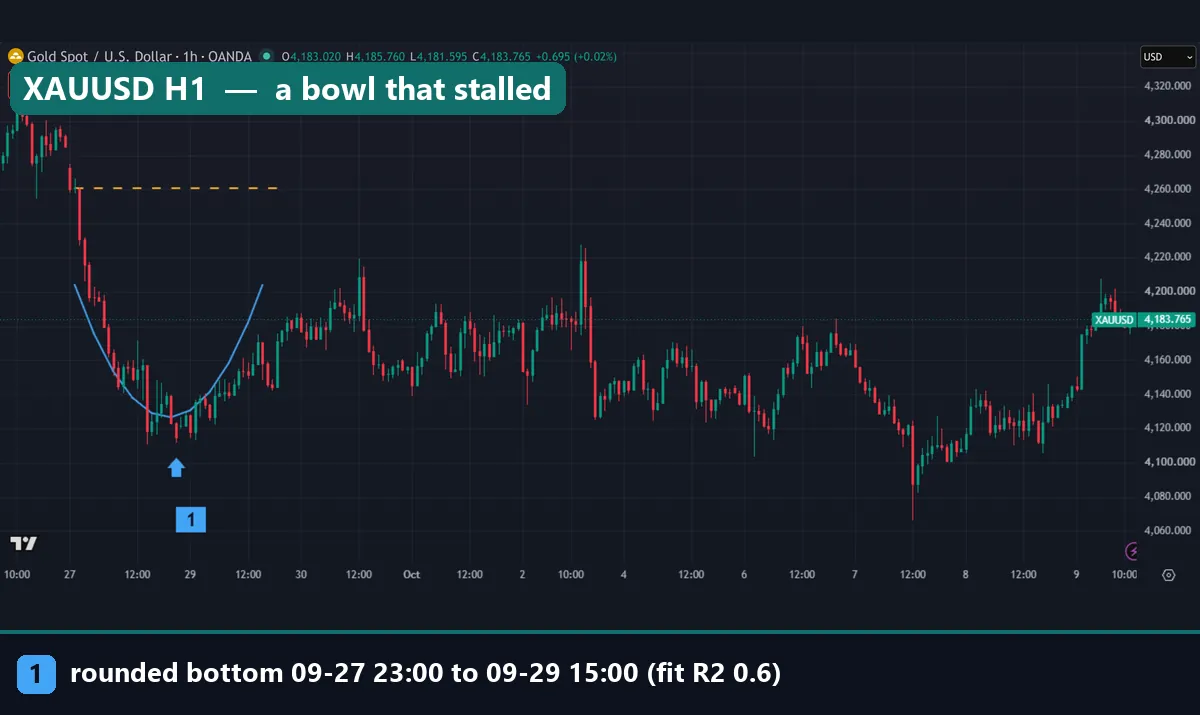
The gold chart shows the opposite problem. The bowl ran from 23:00 UTC on 27 September to 15:00 UTC on 29 September 2026, with a fit of 0.6. The low close was 4,114.985 and the rim was 4,260.455. That is $145.47 deep, which is a lot for an hourly bowl. Price climbed back about two-thirds of the way, to 4,219, then went sideways for over a week. It never closed above the rim on our chart.
Common mistakes with the rounded bottom
- Calling every dip a saucer. A V-shaped drop and bounce is not a rounded bottom. Look for time spent near the low, with small bars, before the climb.
- Buying the break as if it starts a trend. In our sample, price was lower 10 days after the break more often than on an average day. Instead, treat the rim as a level where a rally often runs out of steam.
- Trusting the measured target. On EURUSD the target sat at 1.21268, and price never got near it. A target is a guess about distance, not a forecast.
- Reading tick volume as real volume. Rising tick volume on the right side only means more price changes. It does not tell you that large buyers stepped in.
If you plan any trade near the rim, size it from the distance to your stop. Our guide on using ATR as a stop loss shows one way to set that distance.
Where to go next
These guides cover the close relatives of the rounded bottom and the skills behind them:
- Peaks and troughs, the base skill for marking any swing low.
- Break and retest strategy, for what to watch after price clears a level.
- Falling wedge pattern, another shape often read as a bullish turn.
- Parabolic pattern, the steep cousin of the gentle curve shown here.
For outside reading, the rounding bottom article at StockCharts ChartSchool gives the classic stock-market view. Also, the rounding bottom definition at Investopedia is a short summary.
FAQ: rounded bottom questions
Is a rounded bottom the same as a saucer bottom?
Yes. Both names describe the same slow, U-shaped low.
Is a rounded bottom bullish?
The textbook says yes. In our test of 149 daily forex cases, 74.5% closed above the rim within 20 days. But after that break, only 45.0% were higher 10 days later, against 51.9% for all days.
How long does a rounded bottom take to form?
Our rule used a 40-bar window. On a daily chart that is about two months of trading. Hourly bowls form in a day or two, as the GBPUSD and USDJPY charts show.
Where is the rim of a rounded bottom?
We used the first close of the window. Others use the highest close or a swing high on the left side. Each choice gives different breaks.
What is the difference between a rounded bottom and a cup and handle?
The cup in a cup and handle is a rounded bottom. The handle is a small pullback after the cup reaches the rim.
Can I use volume to confirm a rounded bottom in forex?
Not in the way chart books describe. Forex has no central exchange, so MT4 and TradingView OANDA volume is tick volume. It counts price changes, not traded size.
Does the pattern work better on daily or hourly charts?
We measured the daily chart only. Our hourly charts are examples, not a test. So we cannot say that one timeframe works better than the other.
Should I trade the breakout above the rim?
Our data does not support it as a long entry on its own. The break was more often the end of the move than the start. Whatever you decide, test your own rule first, because results are not guaranteed; past performance is not indicative of future results.
Last updated: 9 October 2026.

About the author
Written by Dominic Walsh, a Forex trader and MT4/MT5 indicator, Expert Advisor and script developer. Every tool on forexmt4systems.com is tested on live charts before release and ships with ready-to-use compiled MT4 (.ex4) and MT5 (.ex5) files. Learn more about the trader and developer behind this site.
How we build, test and correct every tool: Editorial & Testing Policy. Trading carries risk; see the disclaimer.